Copyright
©The Author(s) 2023.
World J Hepatol. Dec 27, 2023; 15(12): 1294-1306
Published online Dec 27, 2023. doi: 10.4254/wjh.v15.i12.1294
Published online Dec 27, 2023. doi: 10.4254/wjh.v15.i12.1294
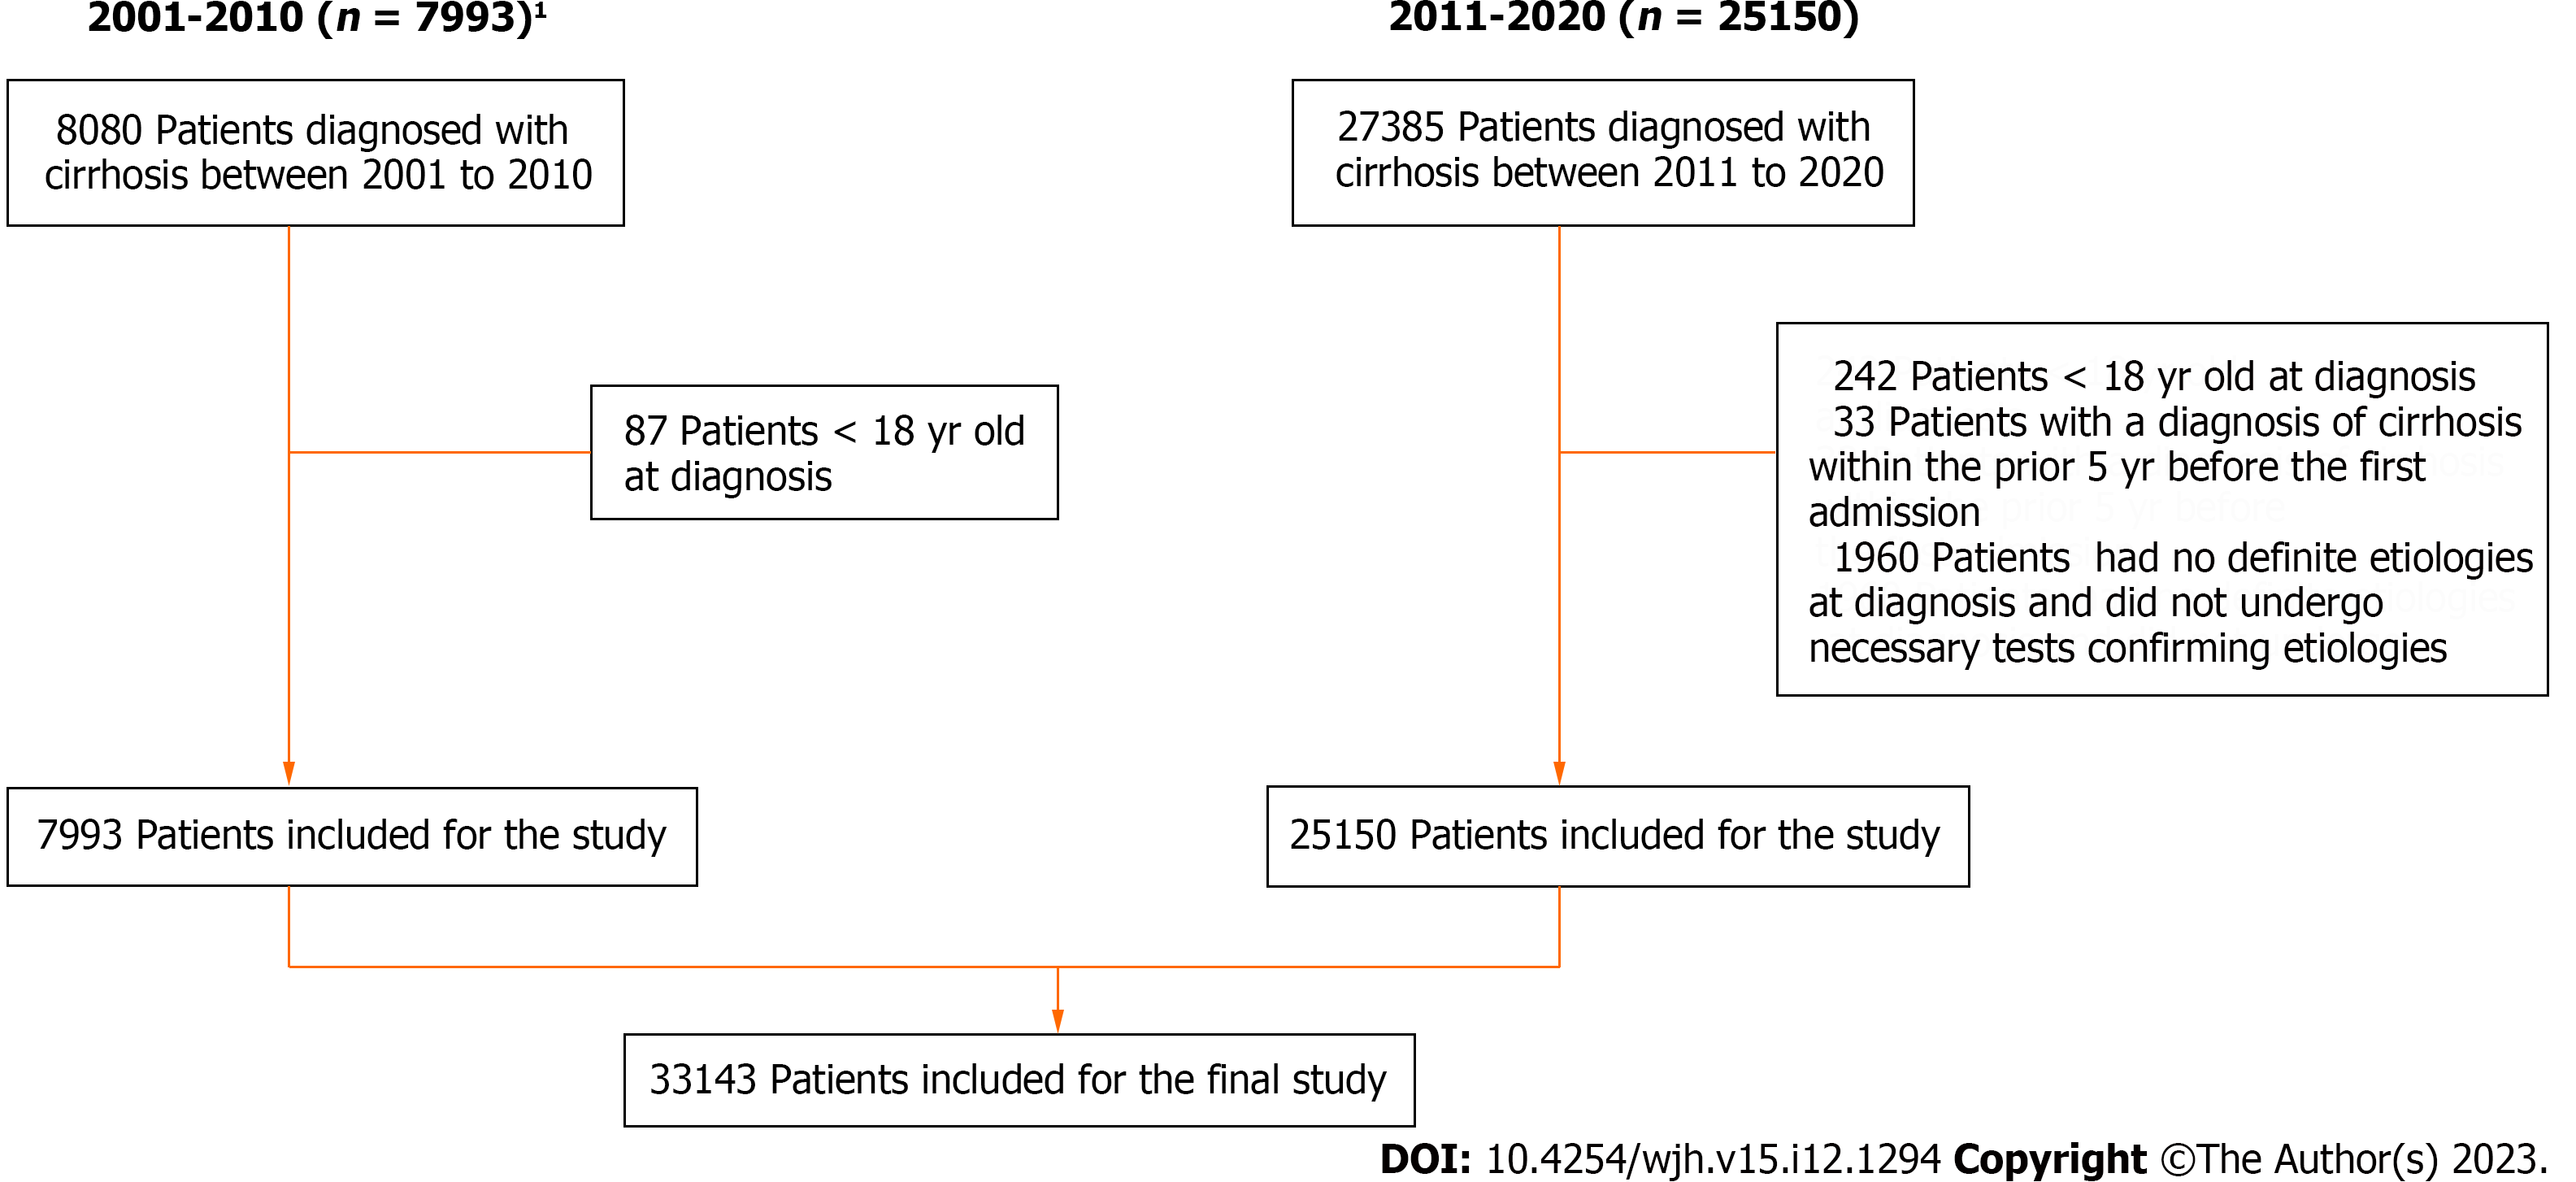
Figure 1 Flowchart of the study population selection.
A total of 33143 patients were finally included in the study out of 35465 patients diagnosed with liver cirrhosis from 2001 to 2020. 1Detailed patient selection was elaborated in our previous study[8].
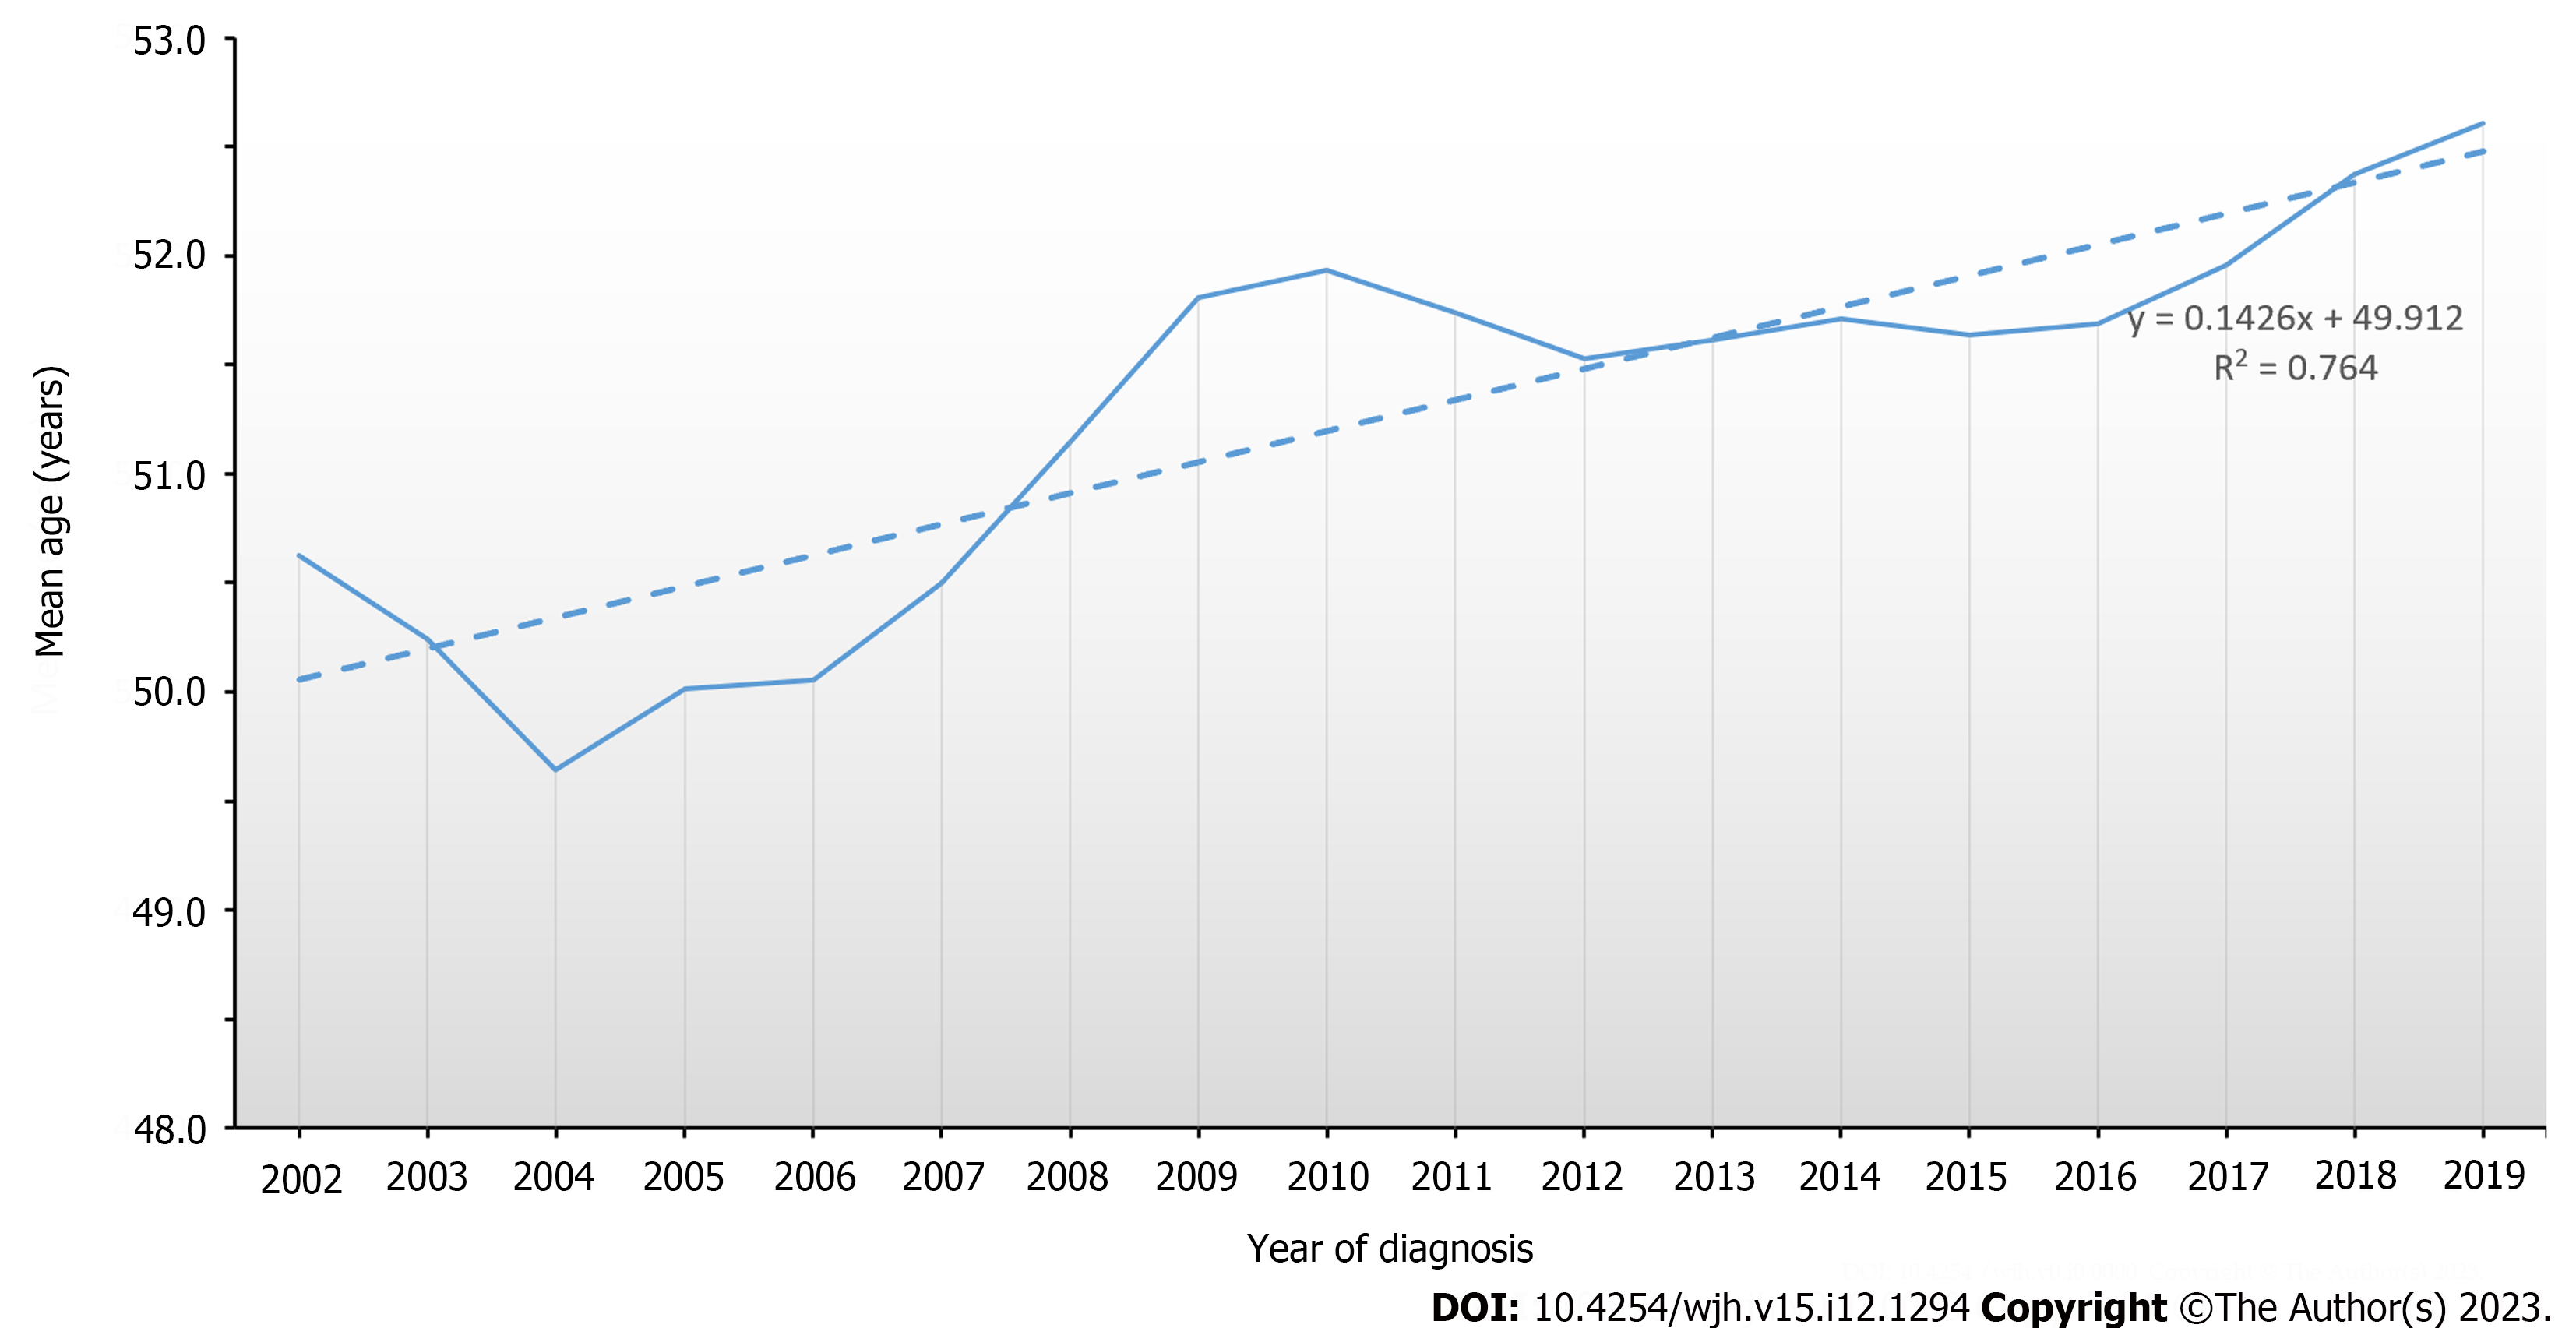
Figure 2 Trend in the mean age of the study population in 2001-2020.
The three-year moving averages in ages were calculated and shown. The mean age of cirrhotic patients increased continuously over the 20-year study period, with a high coefficient of determination in linear regression (R2 = 0.764). The three-year moving averages were plotted on the central year, as the year of diagnosis in the horizontal axis (e.g. 2002 represented 2001-2003, and 2019 represented 2018-2020).
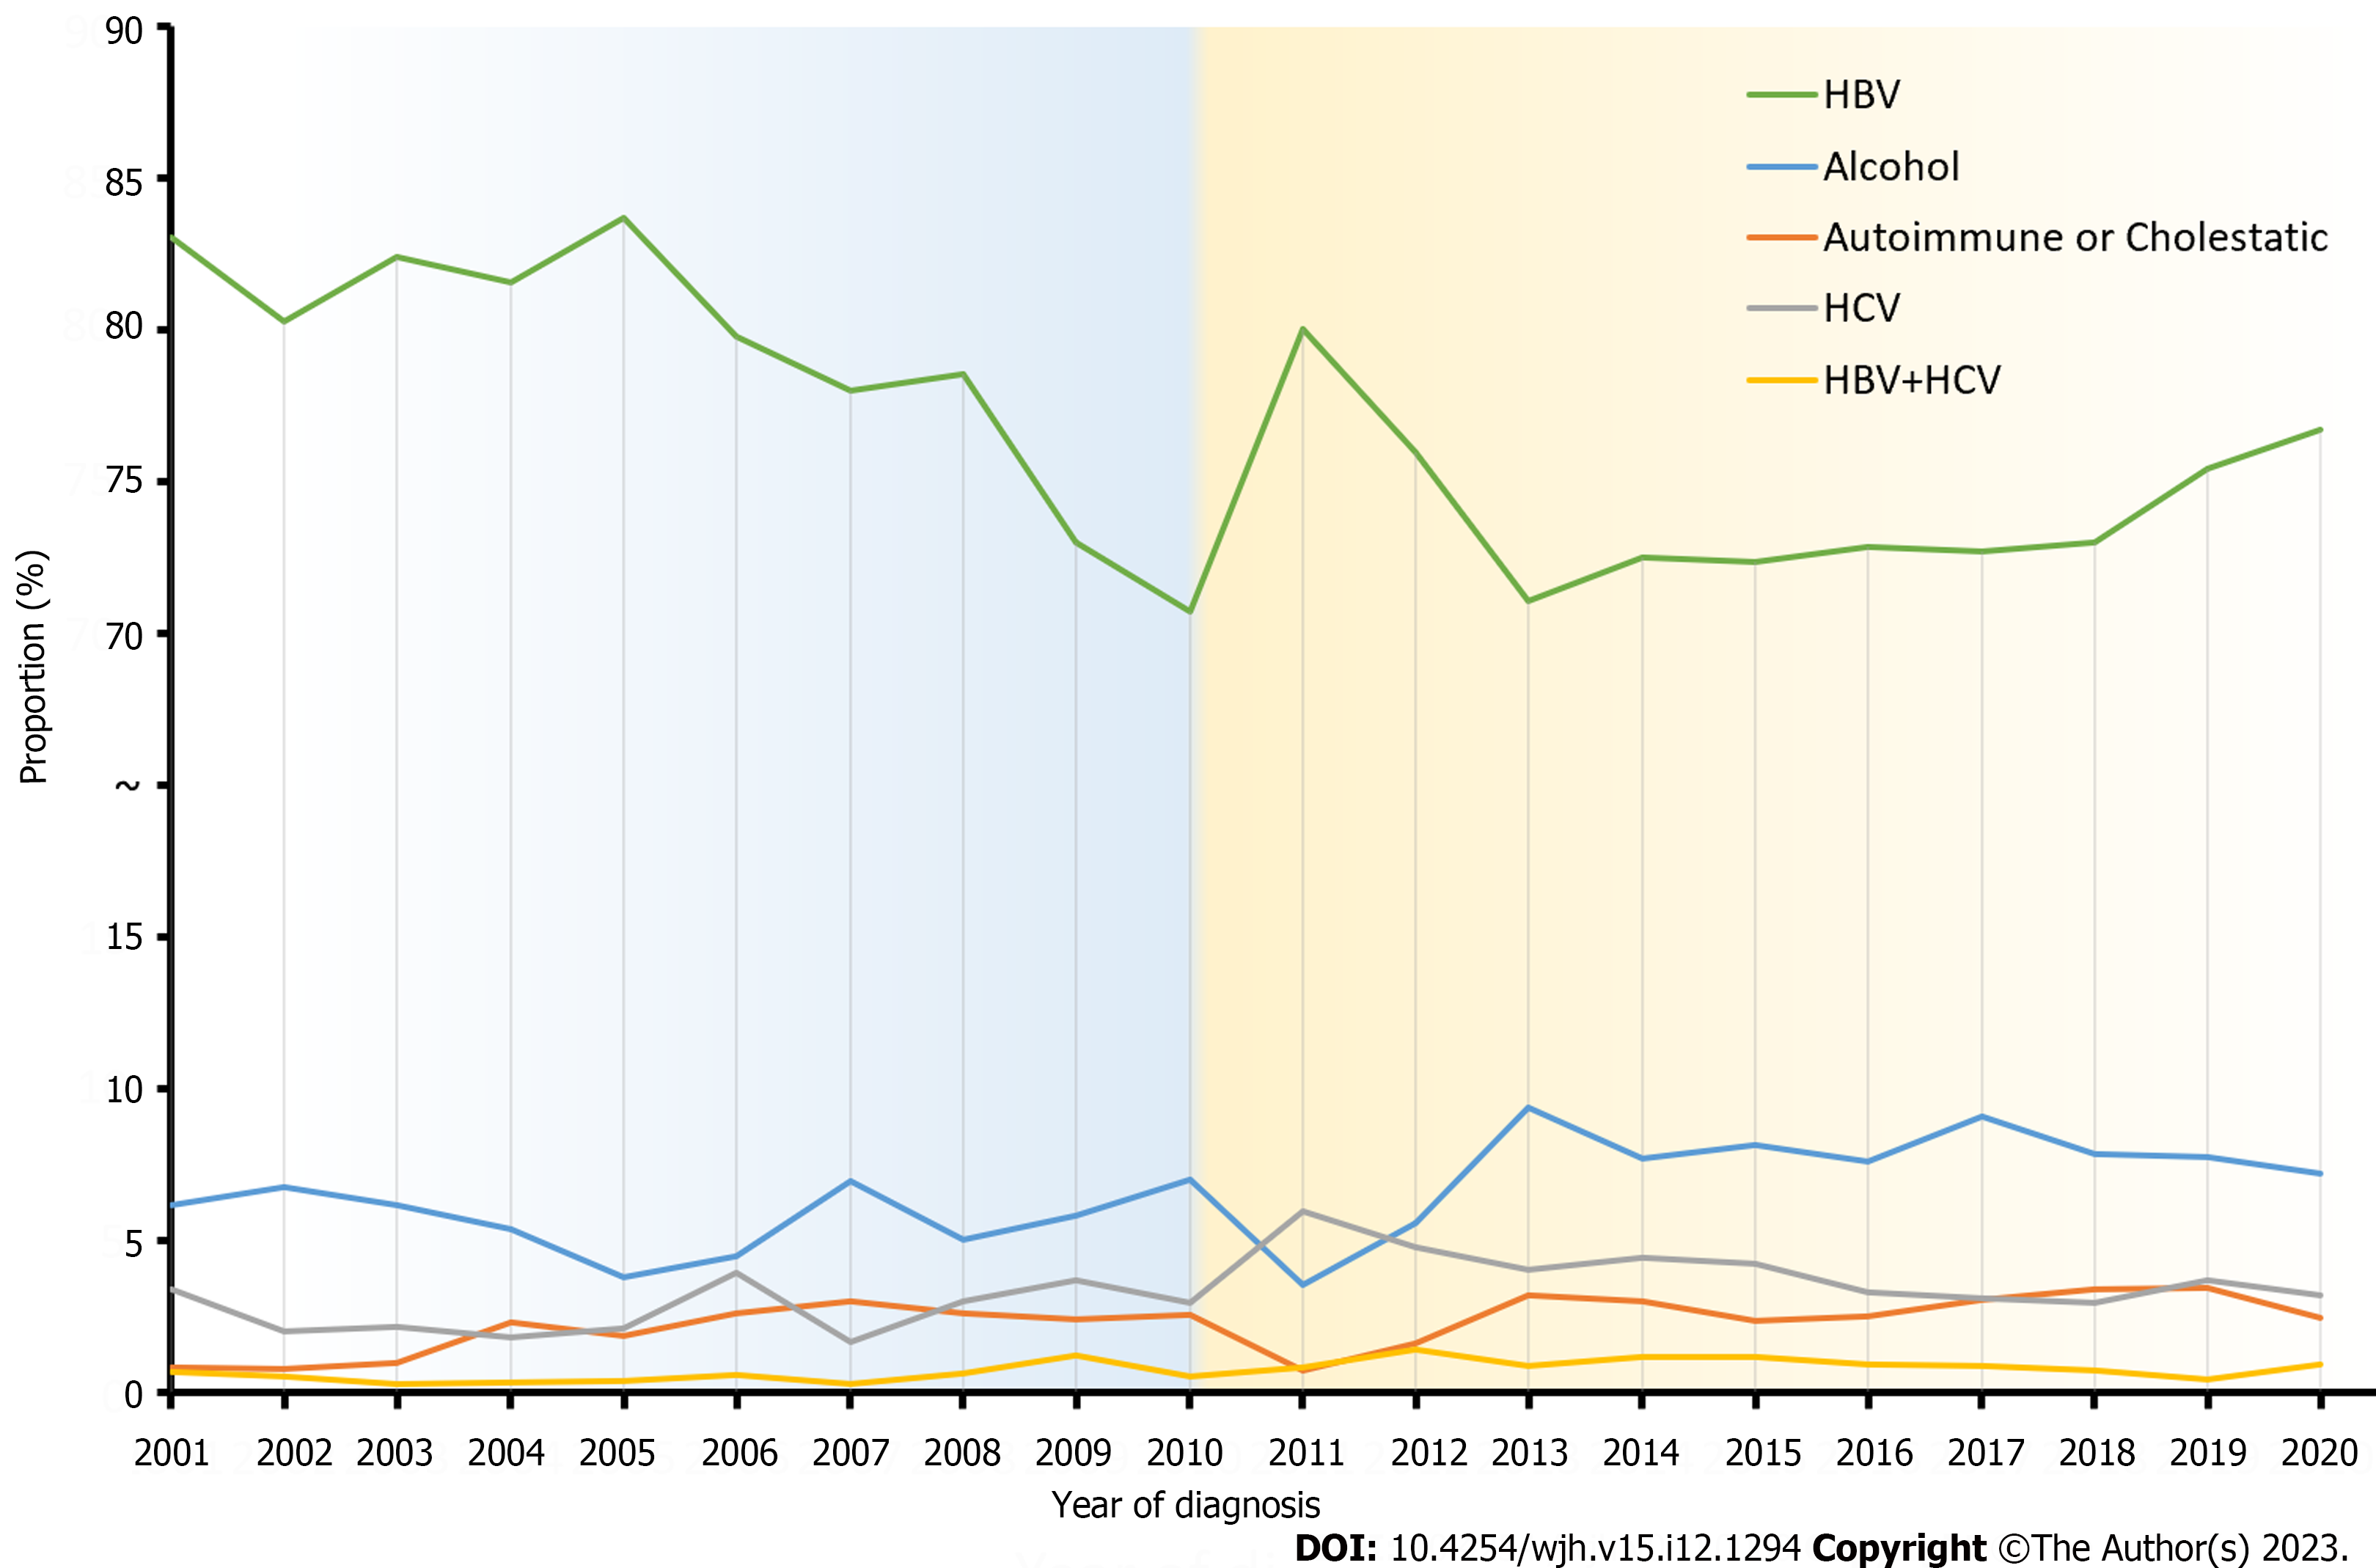
Figure 3 Temporal trends of viral hepatitis and other major etiologies in 2001-2020.
The proportion of hepatitis B virus-liver cirrhosis (HBV-LC) decreased dramatically during the 2001-2010 period but fluctuated and decreased slightly during the 2011-2020 period. Meanwhile, proportions of alcoholic-LC and autoimmune or cholestatic-LC have increased during the 20-year period. Hepatitis C virus (HCV)-LC and (HBV + HCV)-LC have not shown explicit trends. The Cochran-Armitage test for P trend found no statistical significance (P > 0.05) when comparing proportions in separated years (P > 0.05). HBV: Hepatitis B virus; HCV: Hepatitis C virus.
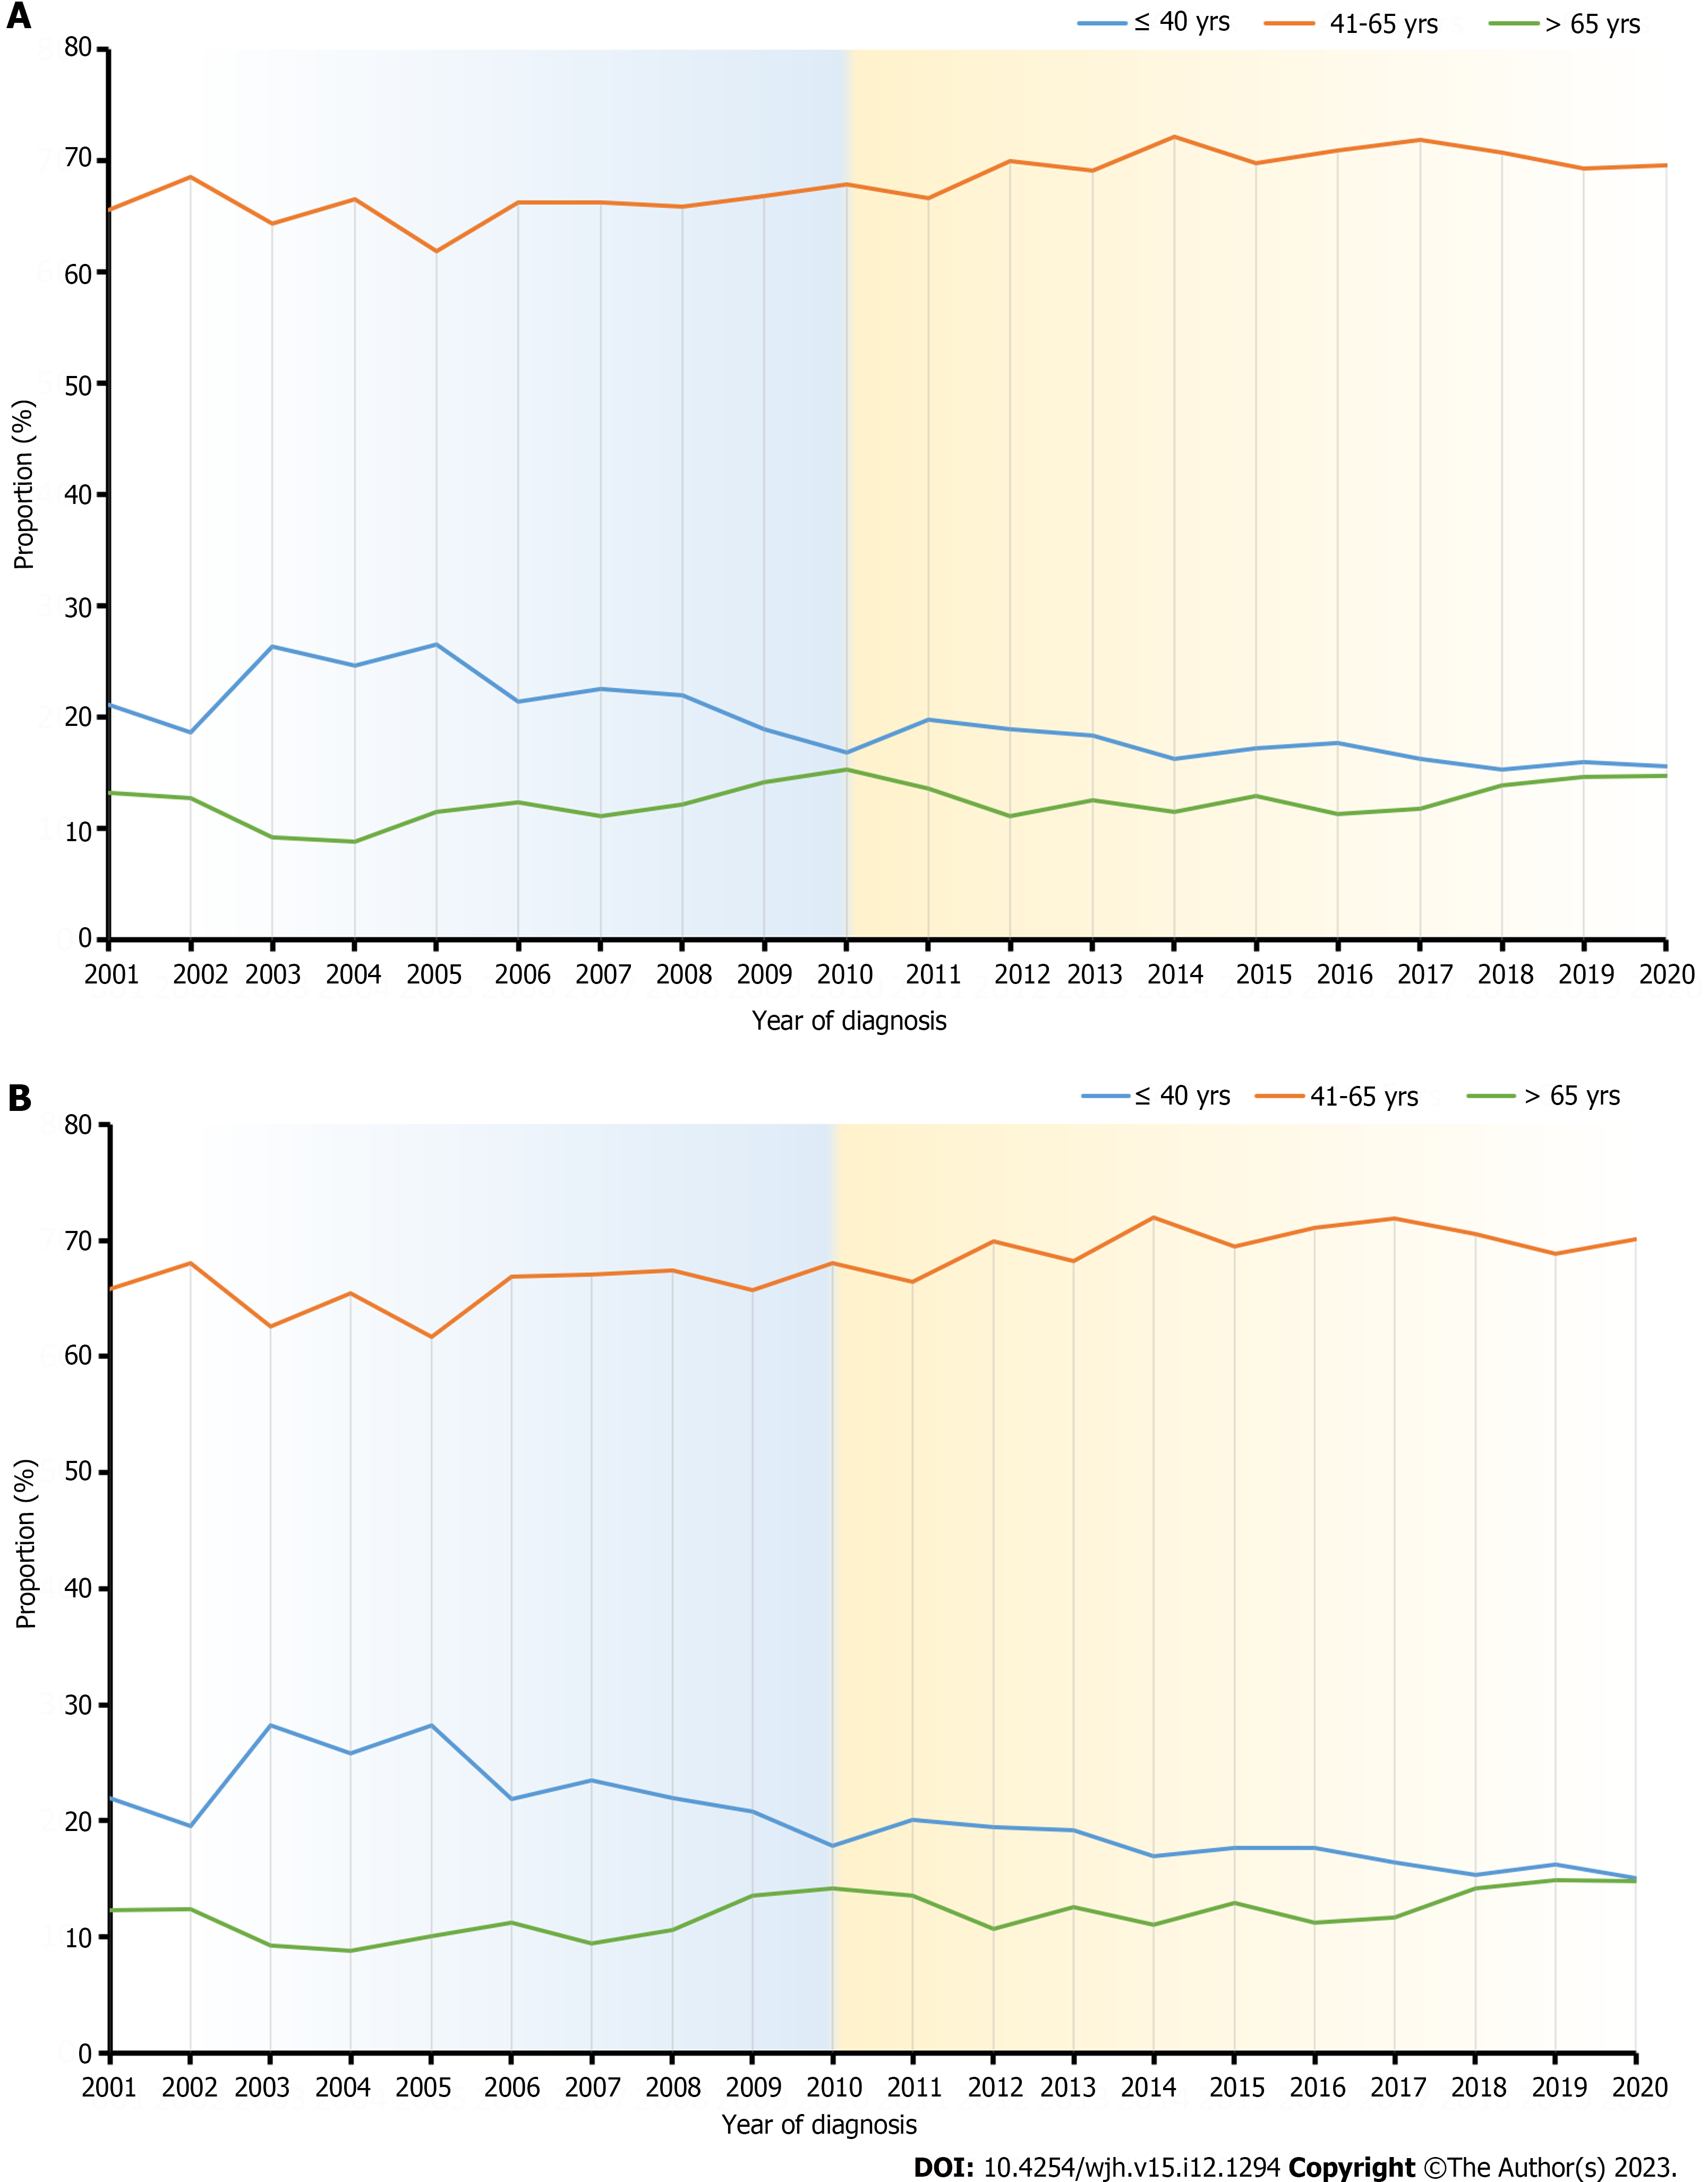
Figure 4 Temporal trends in different age groups of the study population.
A: In the whole population, the proportion of patients ≤ 40 years was decreasing (21.2% in 2001 to 15.7% in 2020), and those aged 41-65 years and > 65 years were increasing (65.6% in 2001 to 69.6% in 2020, and 13.3% in 2001 to 14.7% in 2020, respectively) during the 20-year study period; B: In patients with hepatitis B virus-liver cirrhosis, the proportion ≤ 40 years decreased (22.0% in 2001 to 15.1% in 2020), and those aged 41-65 years and > 65 years increased (65.8% in 2001 to 70.1% in 2020, and 12.3% in 2001 to 14.8% in 2020, respectively) during the 20-year study period.
- Citation: Wang X, Luo JN, Wu XY, Zhang QX, Wu B. Study of liver cirrhosis over twenty consecutive years in adults in Southern China. World J Hepatol 2023; 15(12): 1294-1306
- URL: https://www.wjgnet.com/1948-5182/full/v15/i12/1294.htm
- DOI: https://dx.doi.org/10.4254/wjh.v15.i12.1294


