Copyright
©The Author(s) 2022.
World J Hepatol. May 27, 2022; 14(5): 1016-1024
Published online May 27, 2022. doi: 10.4254/wjh.v14.i5.1016
Published online May 27, 2022. doi: 10.4254/wjh.v14.i5.1016
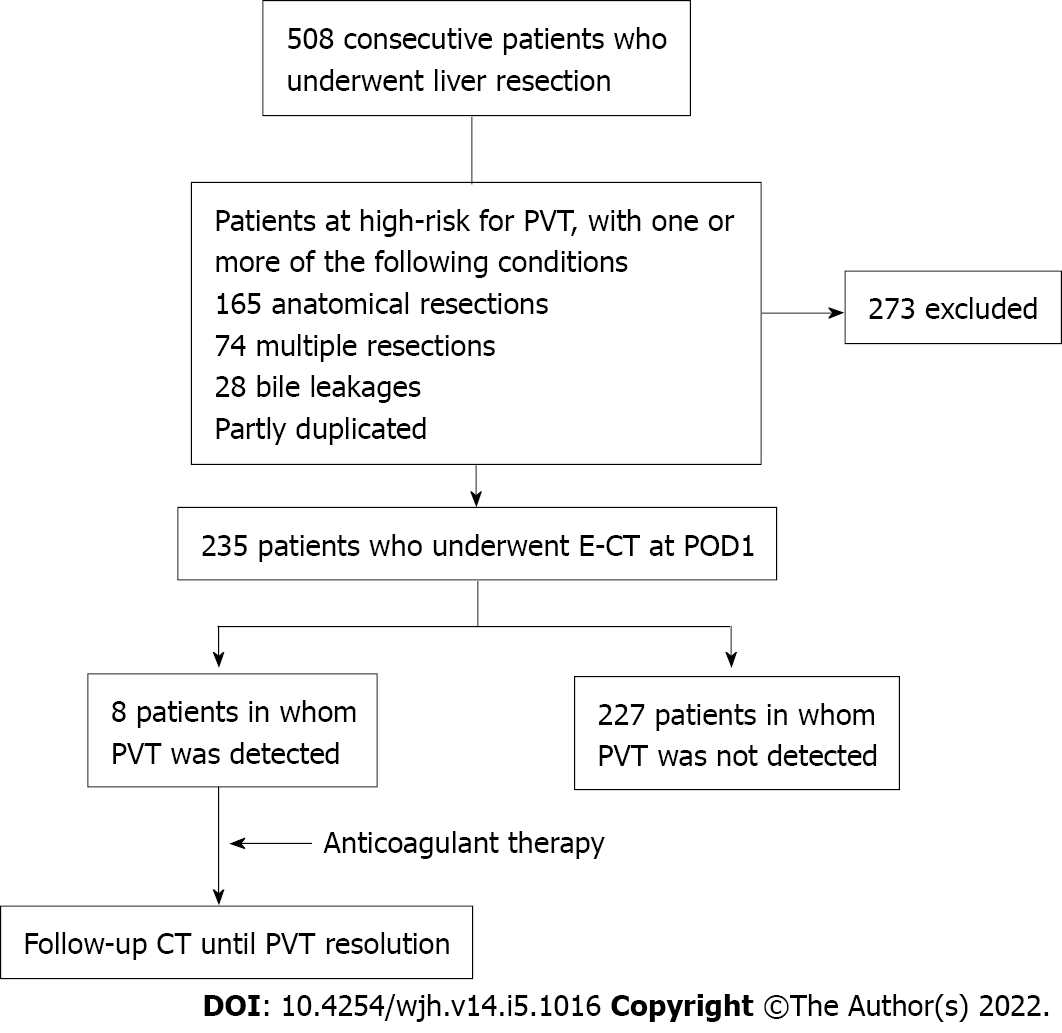
Figure 1 Patient flow of the analysis of portal vein thrombosis.
Contrast-enhanced computed tomography was performed on the first day in 235 patients, who were categorized as high risk by three factors: Anatomical resection (165 patients), multiple resections (74 patients), and bile leakage (28 patients). Eight patients were detected with portal vein thrombosis in the high-risk group. E-CT: Contrast-enhanced computed tomography; POD: Post operative day; PVT: Portal vein thrombosis.
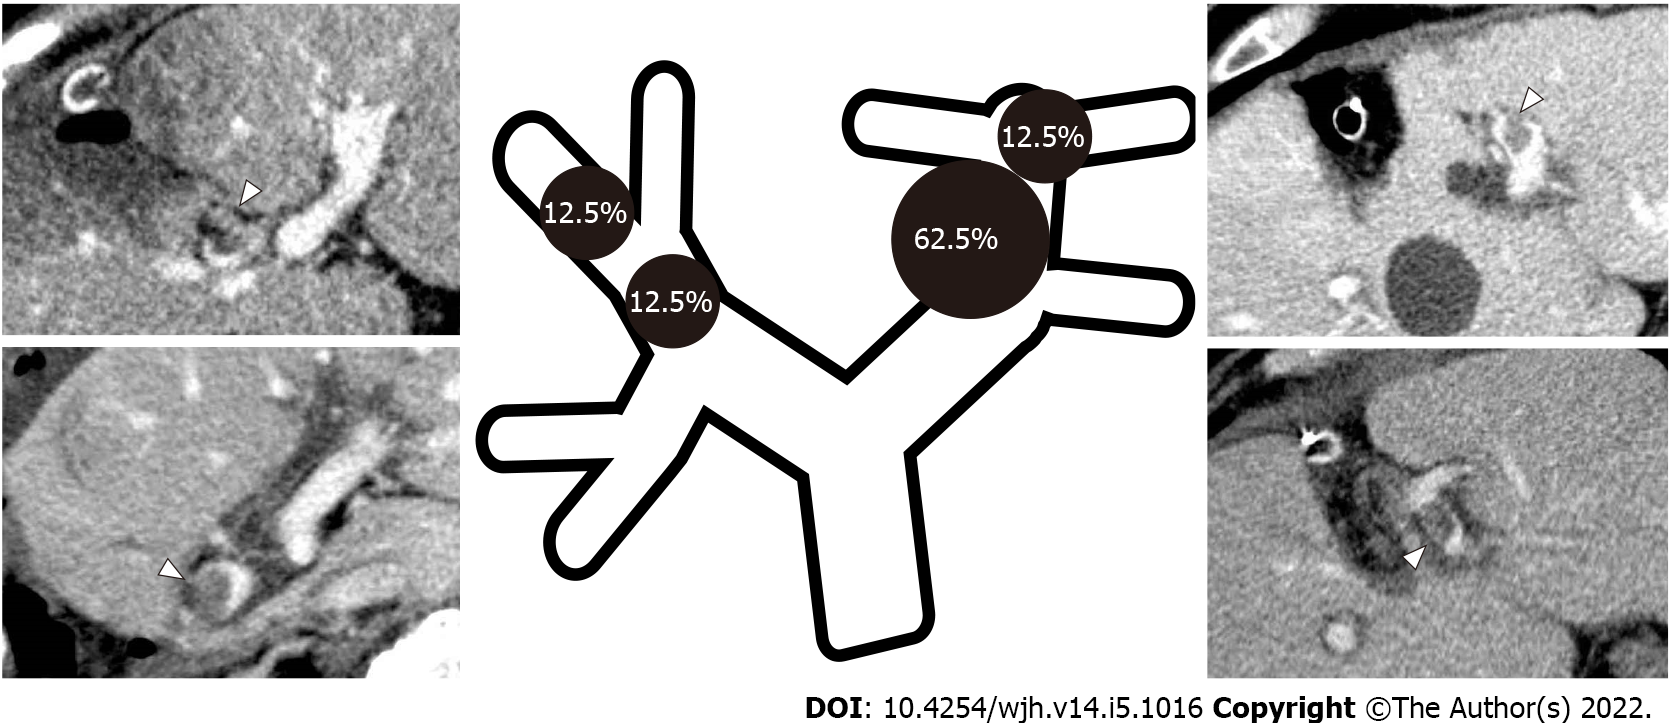
Figure 2 Portal vein thrombosis distribution and frequency.
The sites of portal vein thrombosis included those around the umbilical portion (UP) (62.5%, 5/8 patients) and in the apex of the UP (12.5%, 1 patient), as well as the P8 resection stump (12.5%, 1 patient) and the anterior portal vein branch (12.5%, 1 patient).
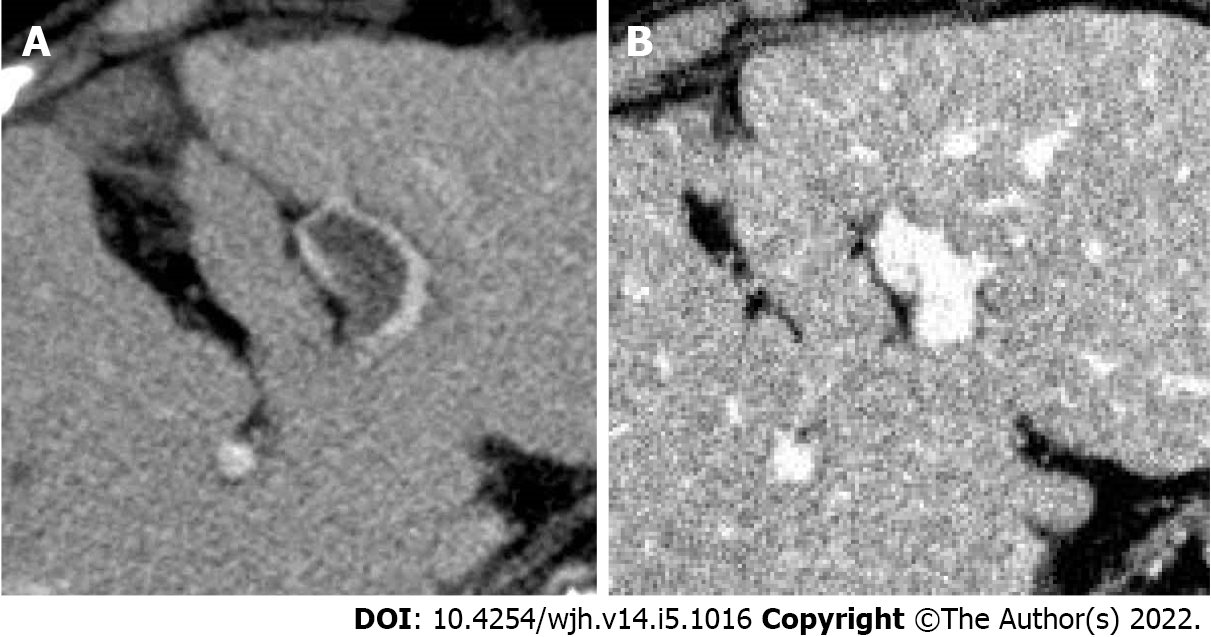
Figure 3 Before and after anticoagulation therapy.
A: In case 7, portal vein thrombosis (PVT) was found in the umbilical portion; B: PVT disappeared 140 d after starting anticoagulant therapy.
- Citation: Yoshida N, Yamazaki S, Masamichi M, Okamura Y, Takayama T. Prospective validation to prevent symptomatic portal vein thrombosis after liver resection. World J Hepatol 2022; 14(5): 1016-1024
- URL: https://www.wjgnet.com/1948-5182/full/v14/i5/1016.htm
- DOI: https://dx.doi.org/10.4254/wjh.v14.i5.1016


