Copyright
©The Author(s) 2022.
World J Hepatol. Feb 27, 2022; 14(2): 386-399
Published online Feb 27, 2022. doi: 10.4254/wjh.v14.i2.386
Published online Feb 27, 2022. doi: 10.4254/wjh.v14.i2.386
Figure 1 Anatomy of the mouse liver.
Schema of the mouse liver and microphotograph of the mouse liver at postnatal day 7. The inside and outside of the red line were defined as the center (around the hepatic hilus) and periphery, respectively. Histologically, cytokeratin 19-positive hilar bile duct (yellow arrows) and portal vein (blue arrows) were found in the center. Scale bar = 1 mm. A: Schema of the mouse liver; B: Microphotograph of the mouse liver at postnatal day 7.
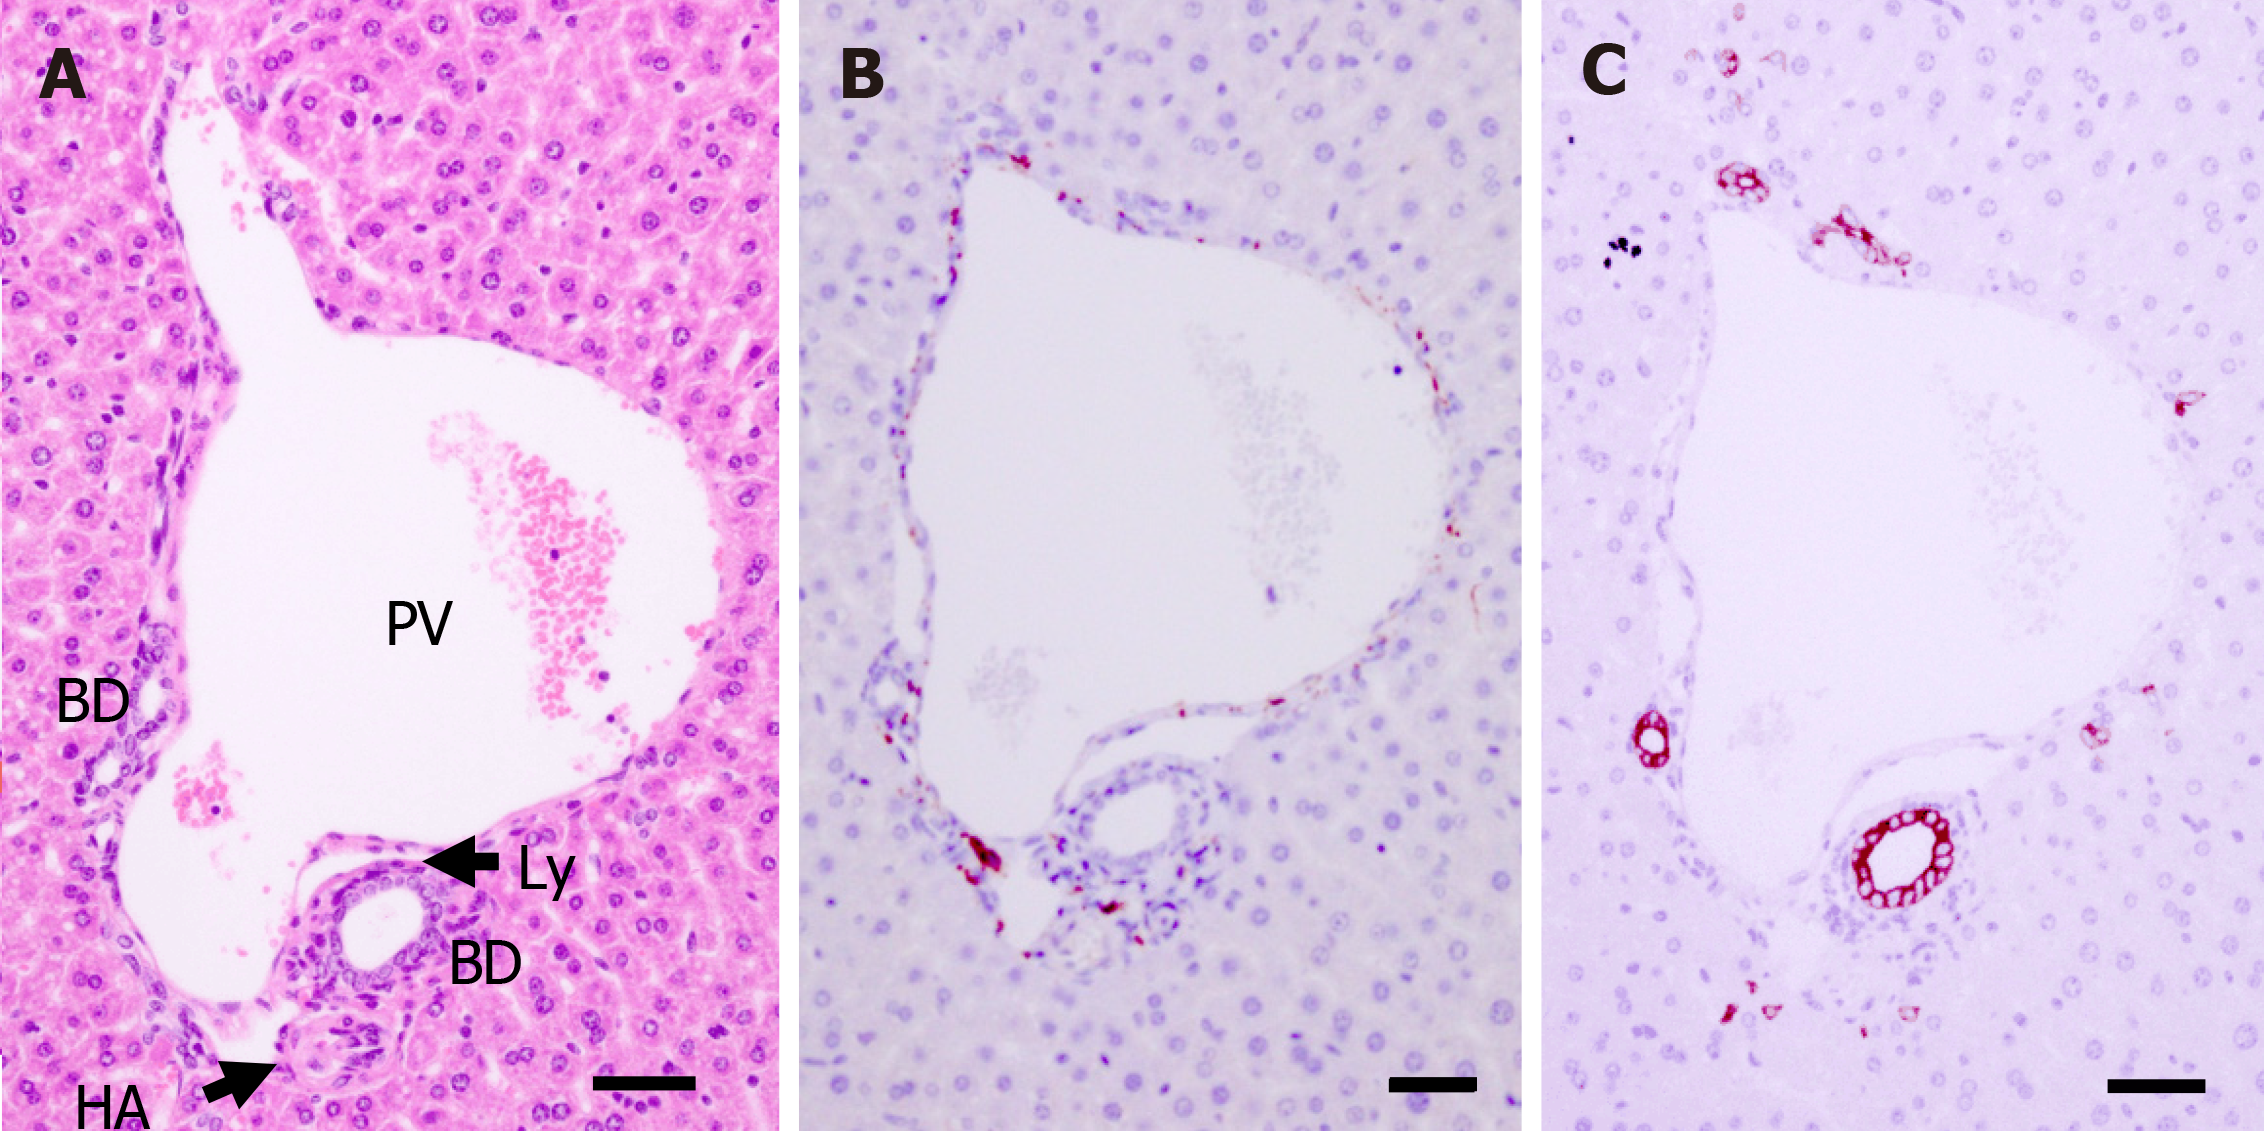
Figure 2 Histology of the portal tract of a postnatal day 56 mouse.
A: Morphological analysis of a portal tract via hematoxylin-eosin staining; B and C: Neurons and bile ducts formed around the portal tract are shown by protein gene product 9.5 staining (B) and cytokeratin 19 staining (C), respectively. PV: Portal vein; HA: Hepatic artery; BD: Bile duct; Ly: Lymphatic vessel. Scale bar = 50 μm.
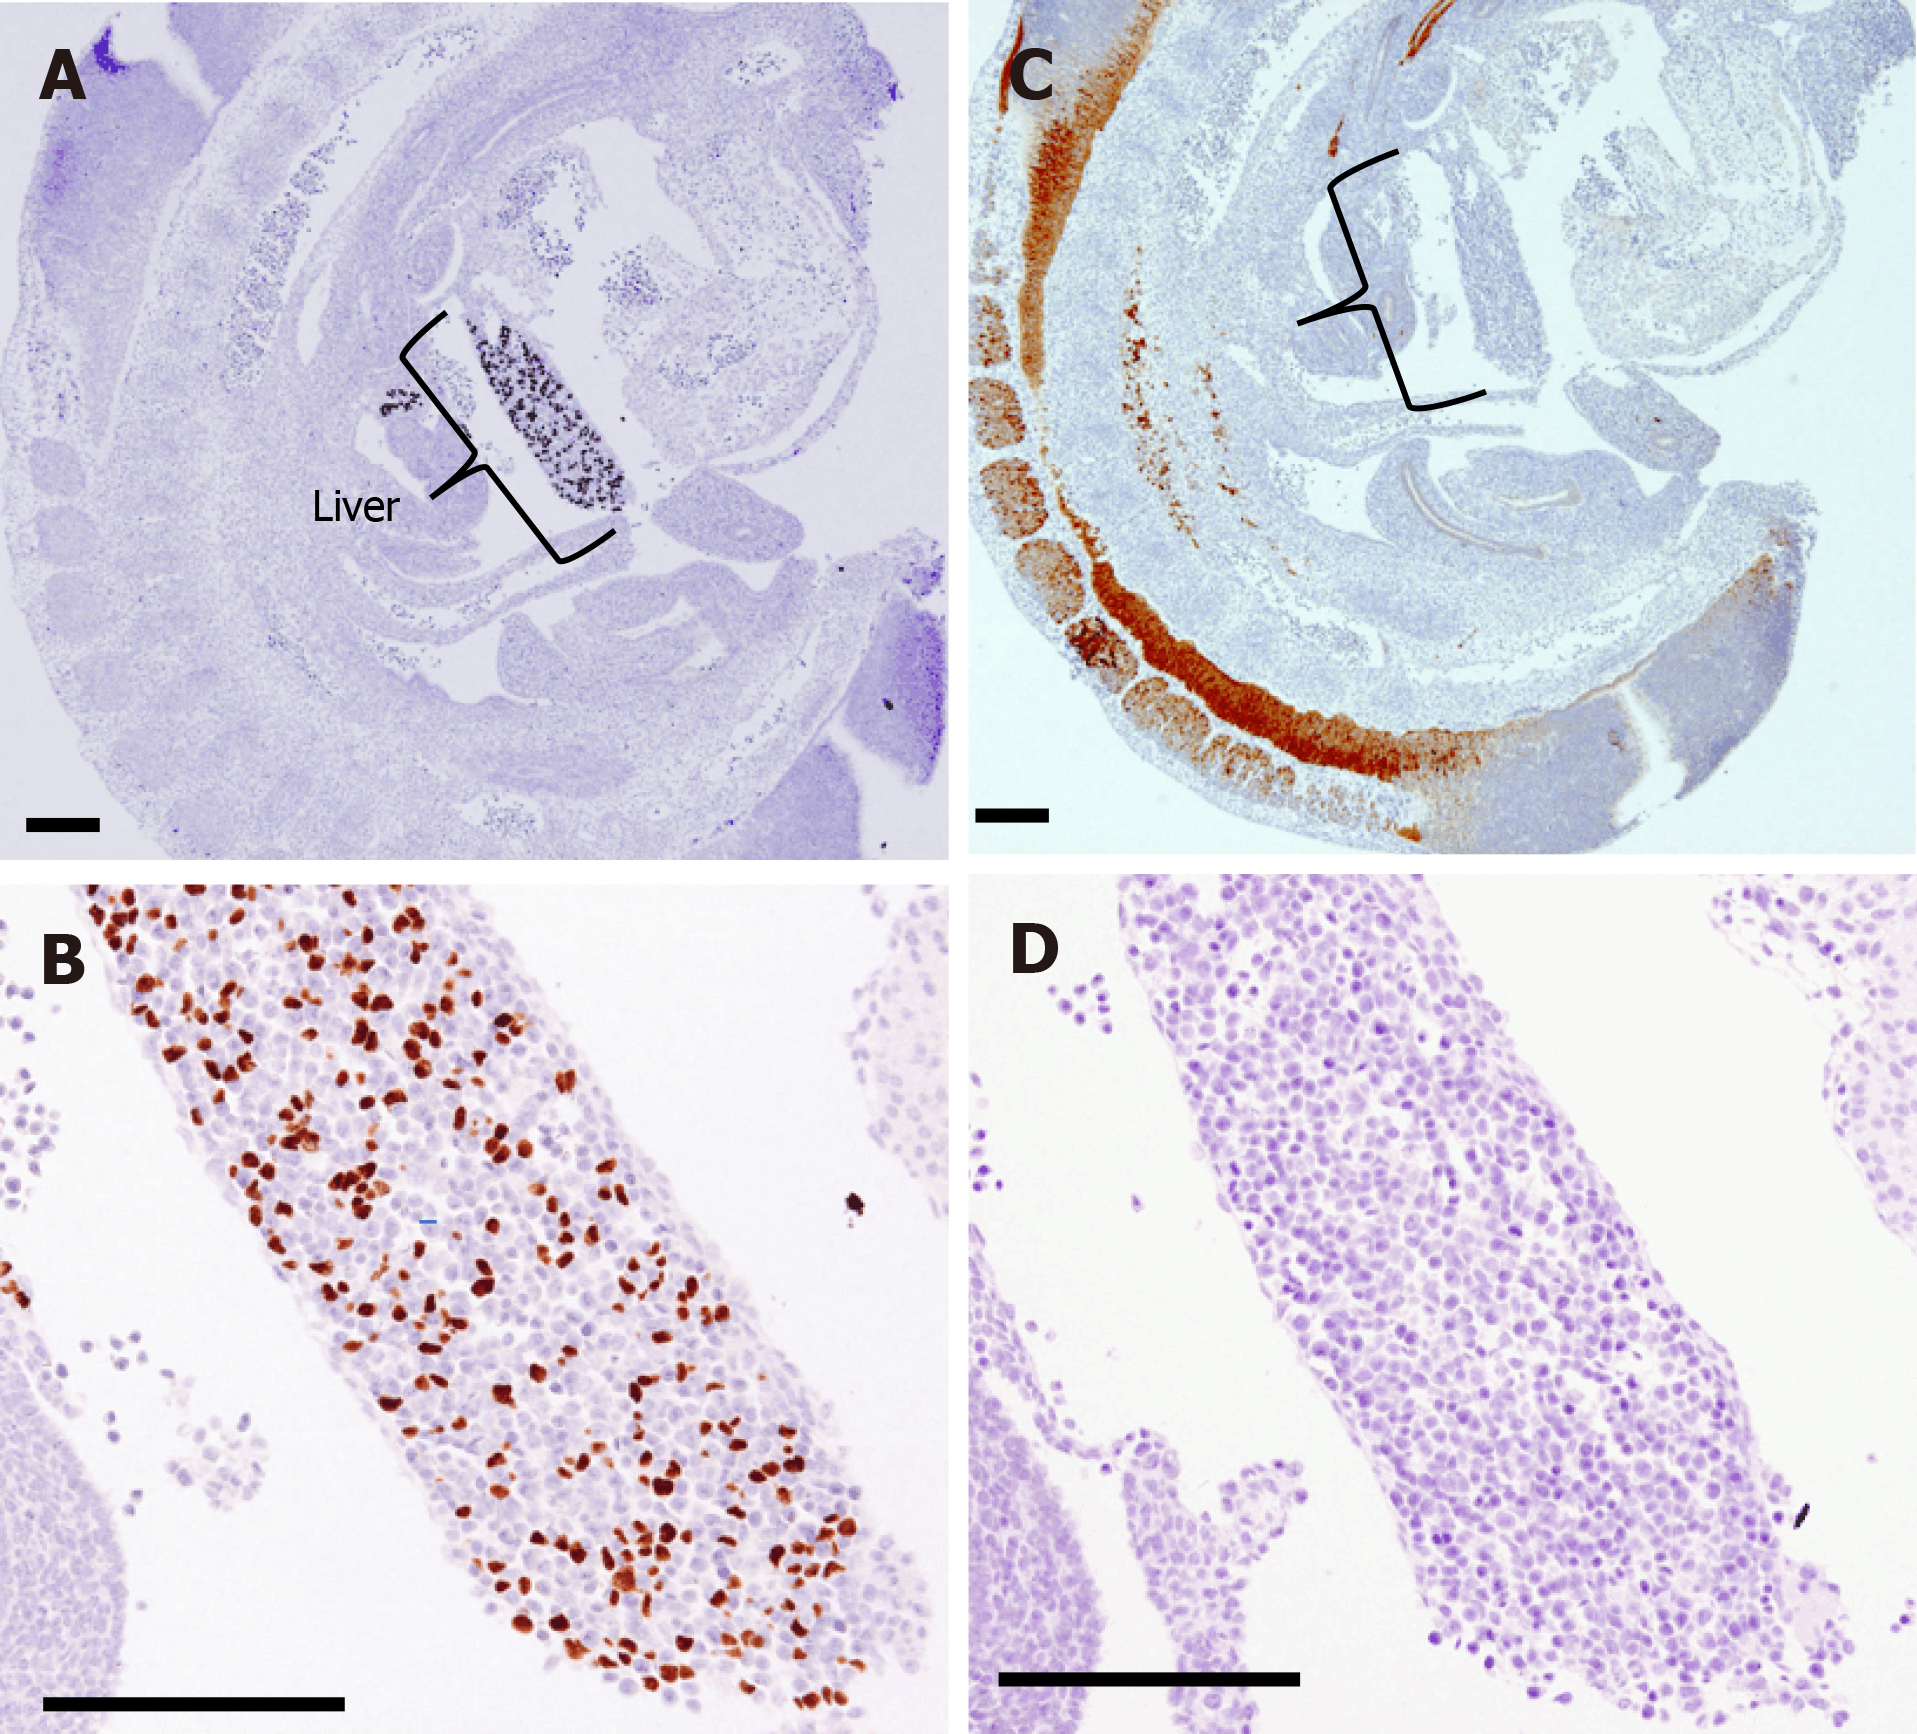
Figure 3 Immunohistochemical analysis of the liver at embryonic day 11.
5 by hepatocyte nuclear factor 4α and protein gene product 9.5. A and B: Hepatic progenitors were observed by hepatocyte nuclear factor 4α (HNF4α) immunostaining; B: Liver tissue at a higher magnification than shown in A; C and D: Neurons or neural progenitors were observed by protein gene product 9.5 (PGP9.5) immunostaining; D: Liver tissue at a higher magnification than shown in C. HNF4α was expressed in the nuclei of many cells in the primitive liver; however, PGP9.5 expression was mainly found in the neural tube at the dorsal area of the embryo and but not found in the liver. Scale bar = 200 μm.
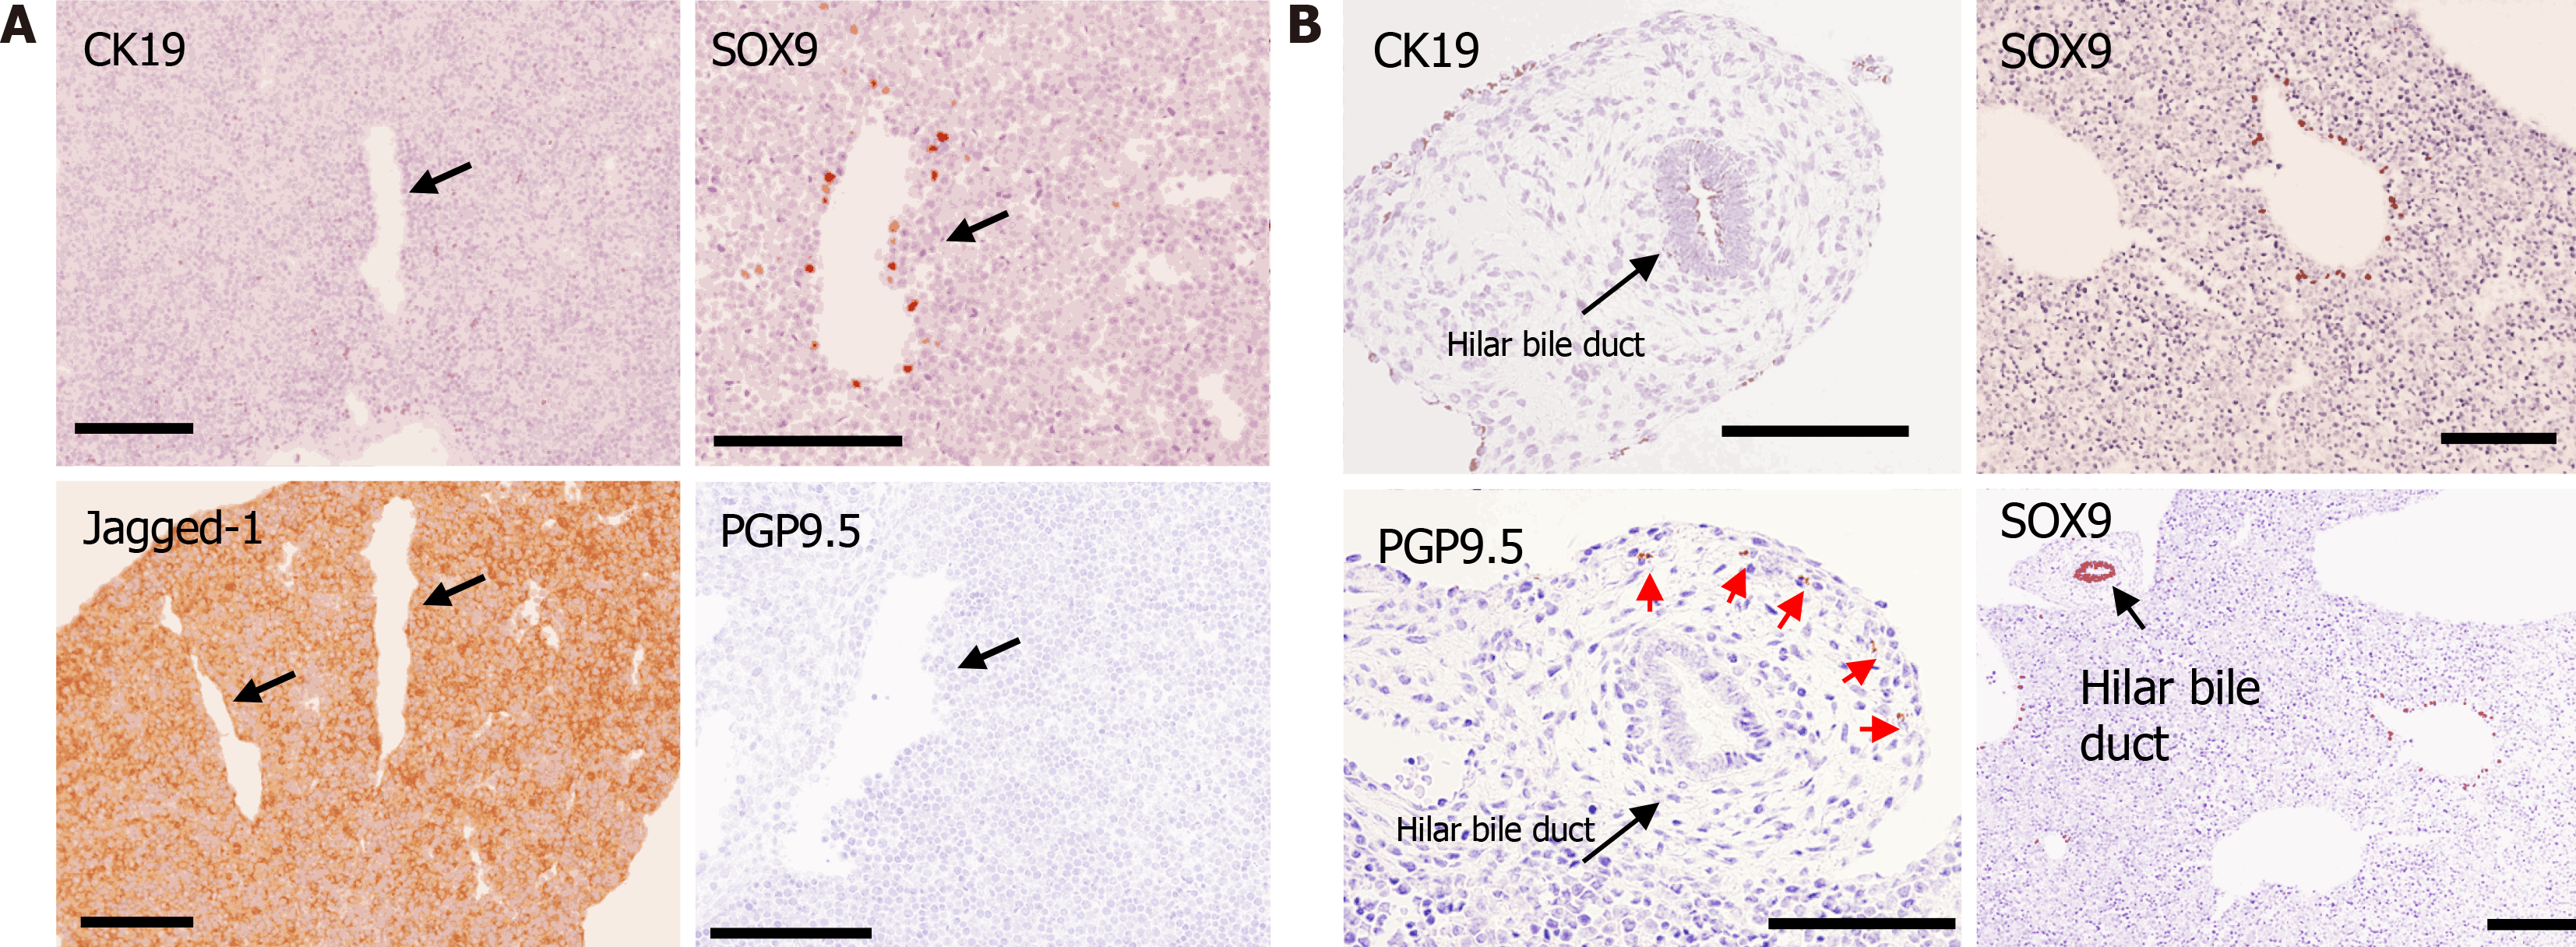
Figure 4 Immunohistochemical analysis.
A: Immunohistochemical analysis of the liver at embryonic day 12.5. Jagged-1 was diffusely positive in the liver (lower left panel), and SRY-related high mobility group-box gene 9 (SOX9)-positive bile duct progenitor cells were found around the large vessels presumably defined as portal veins (upper right panel); however, cytokeratin 19 (CK19) (another marker for bile duct)- and protein gene product 9.5 (PGP9.5) (a marker for neurons)-positive cells were not found (shown in the upper left panel and lower right panels, respectively). Arrows indicate portal veins; B: Immunohistochemical analysis of the center of the liver at embryonic day 15.5. SOX9-positive bile duct progenitor cells were found around the large vessel presumably defined as portal veins. The hilar bile duct strongly expressed SOX9 and weakly expressed CK19. PGP9.5-positive bodies were only found in the parenchyma around the hilar bile duct (red arrow). Scale bars = 200 μm. CK19: Cytokeratin 19; SOX9: SRY-related high mobility group-box gene 9; PGP9.5: Protein gene product 9.5.
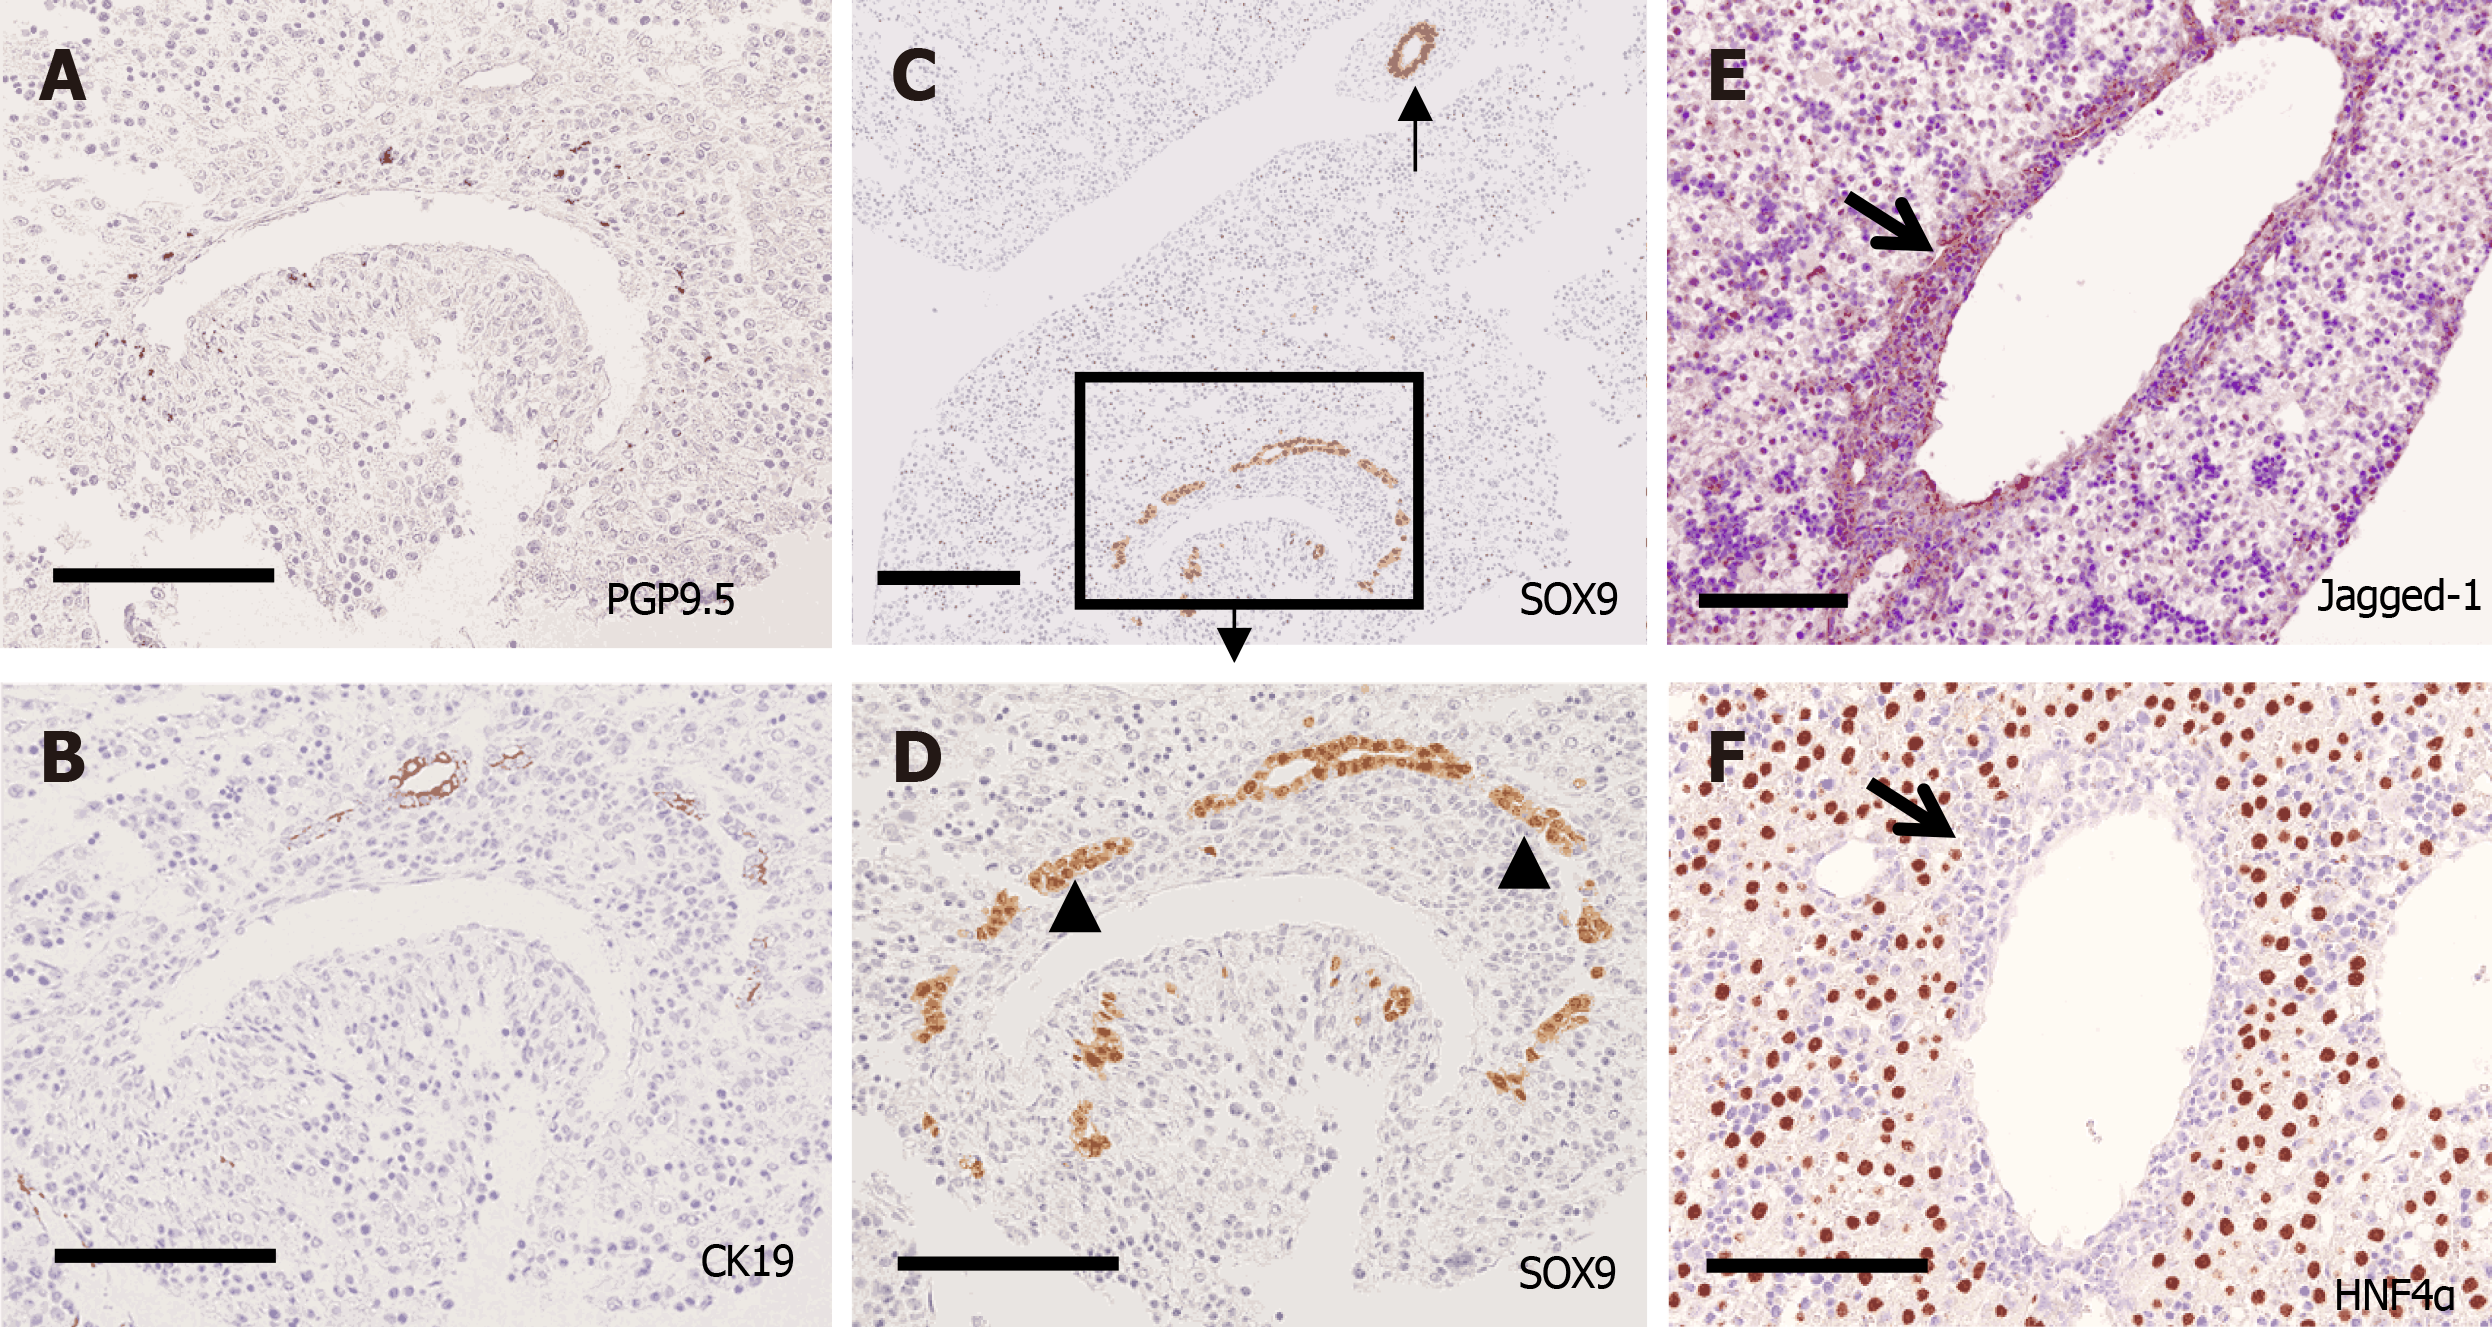
Figure 5 Immunohistochemical analysis of the center of the liver at embryonic day 16.
5 and embryonic day 17.5. A-D: Embryonic day 16.5; E and F: E17.5; A: Protein gene product 9.5 (PGP9.5)-positive bodies were found in the periportal tissue; B: Cytokeratin 19 (CK19) was partly positive in SRY-related high mobility group-box gene 9 (SOX9)-positive structures; C and D: SOX9-positive cells partly from double-layered cylindrical structures called ductal plates (arrowhead) and partly form ductal structures; C: The arrow indicates the hilar bile duct; E: Jagged-1 was mainly expressed in the periportal tissue (thick arrow); F: Hepatocyte nuclear factor 4α was expressed in the liver parenchyma but not in the Jagged-1-positive periportal tissue (thick arrow). Scale bars = 200 μm. CK19: Cytokeratin 19; SOX9: SRY-related high mobility group-box gene 9; PGP9.5: Protein gene product 9.5; HNF4α: Hepatocyte nuclear factor 4α.
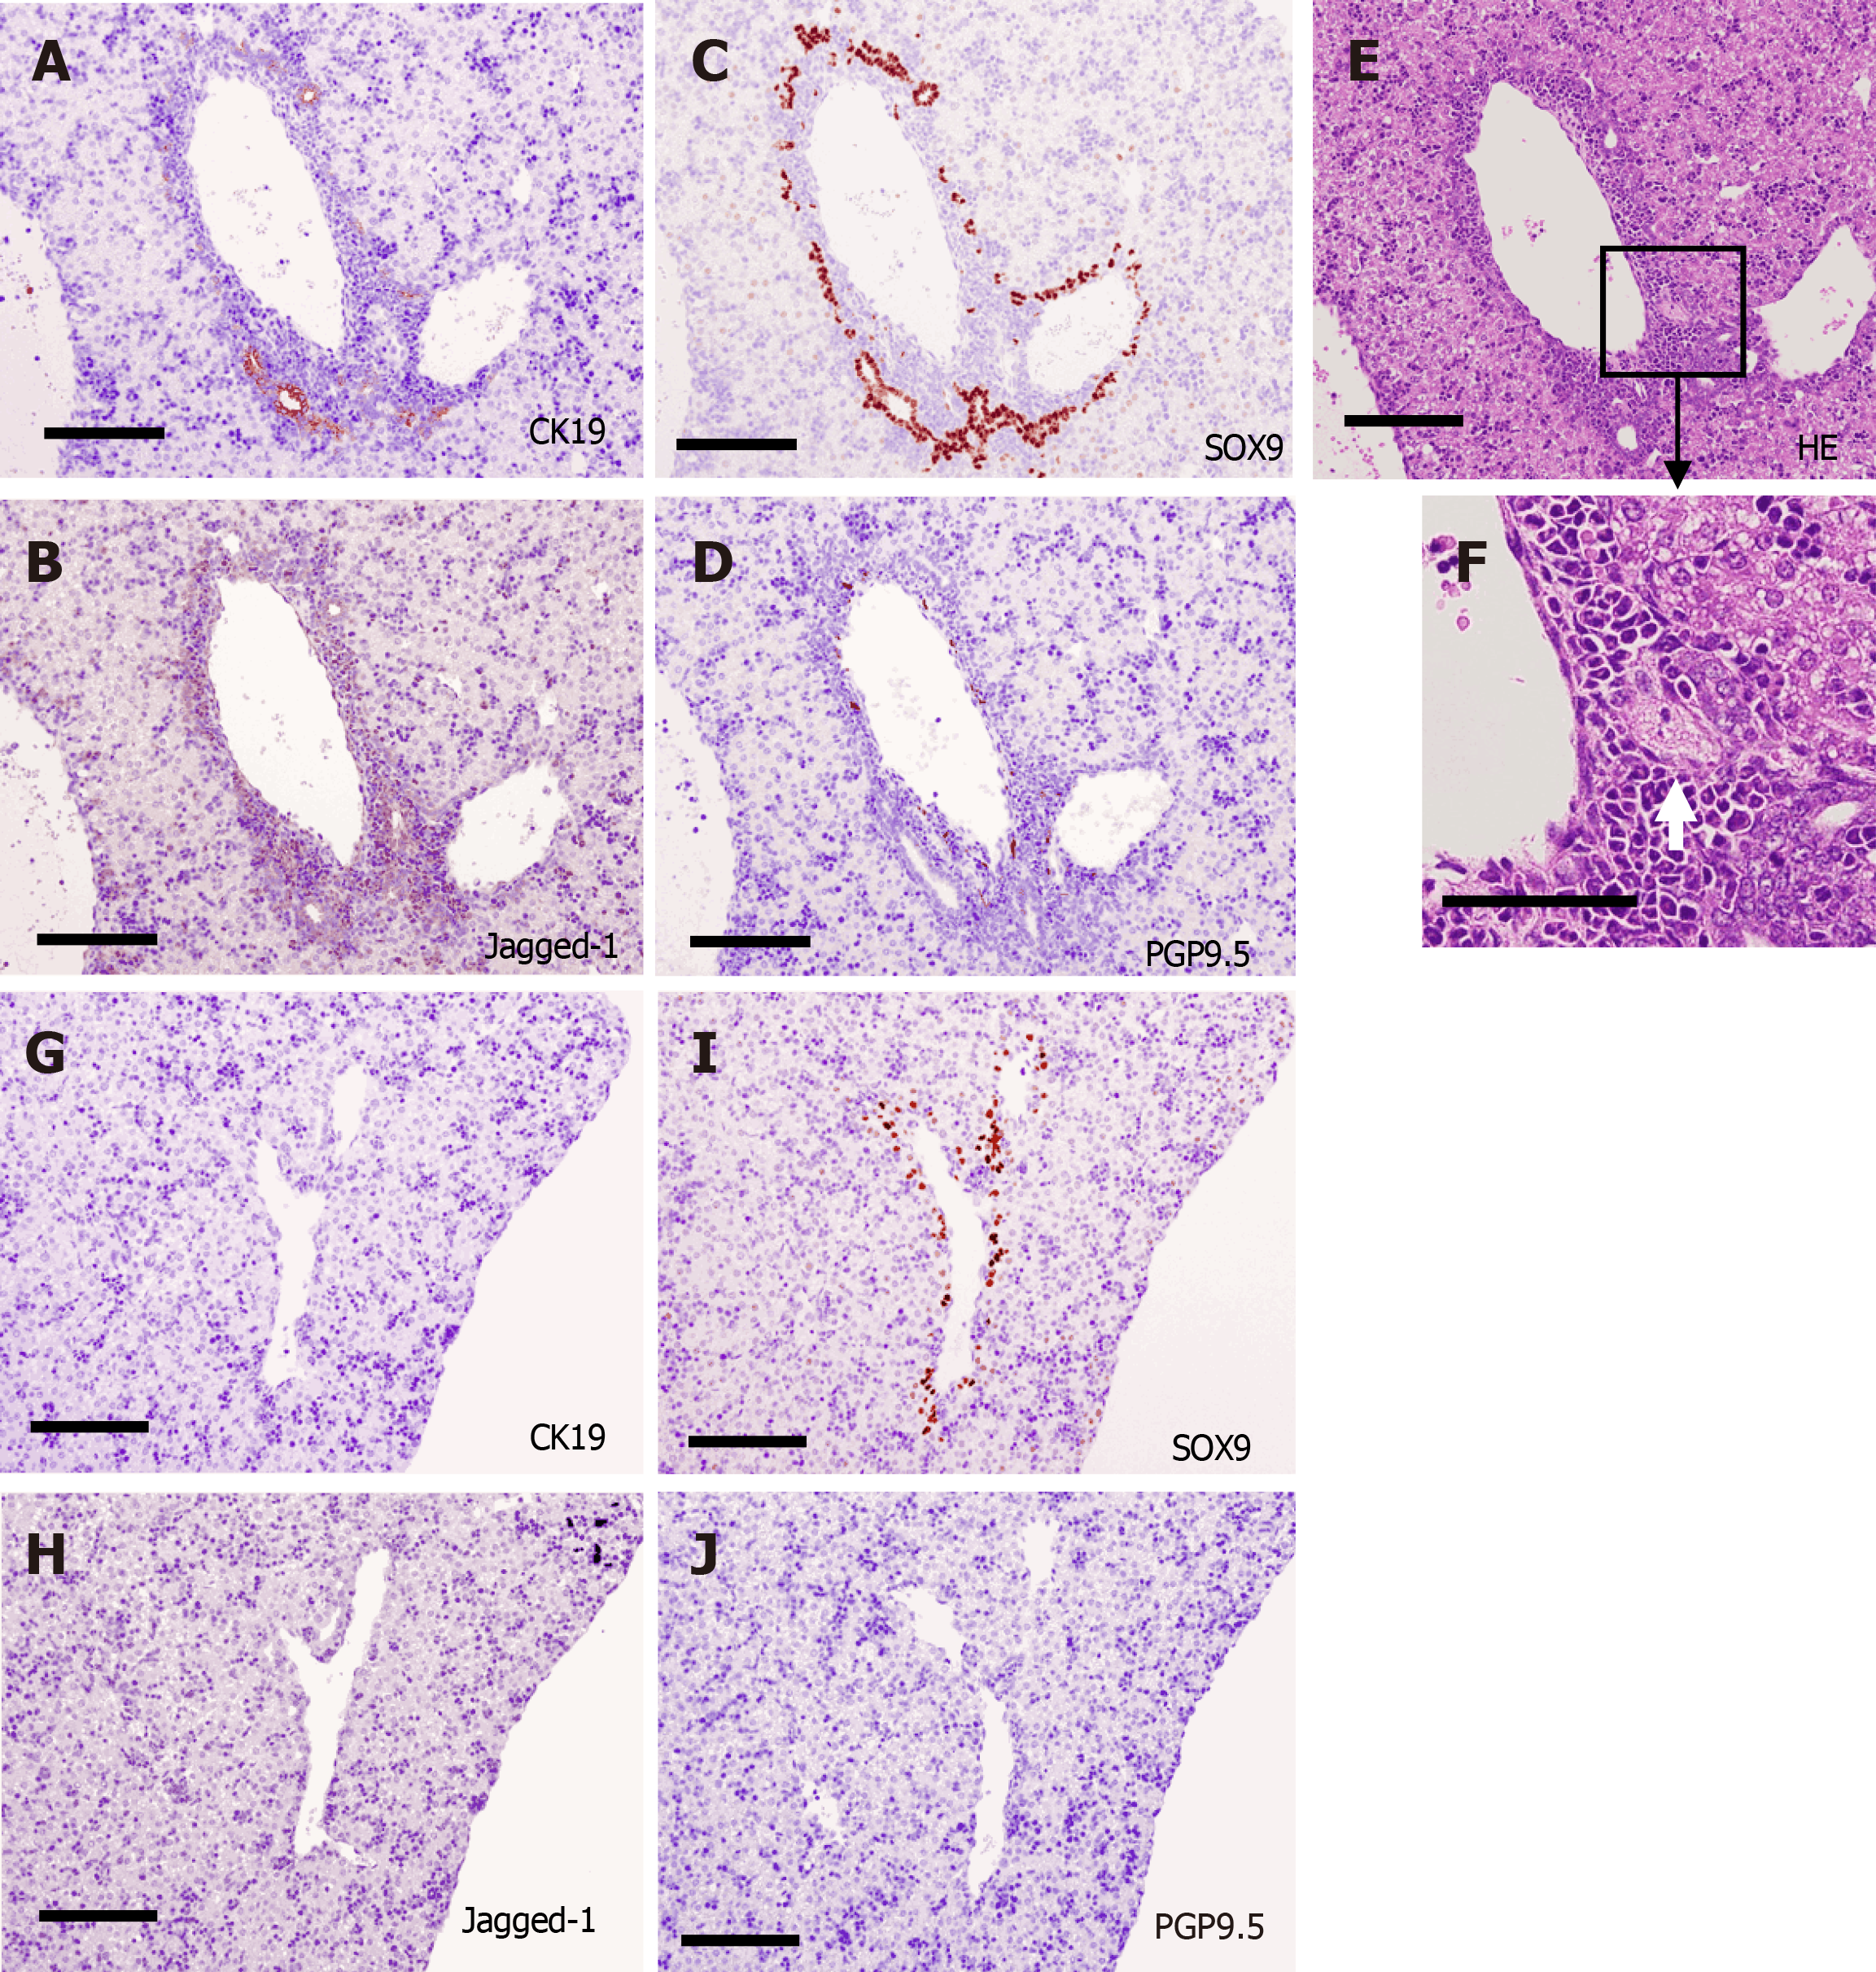
Figure 6 Immunohistochemical analysis of the area around the portal vein at postnatal day 0.
A-F: Center of the liver; A-C: Many SRY-related high mobility group-box gene 9 (SOX9)-positive cells were found in Jagged-1-positive periportal tissue, and they formed cytokeratin 19 (CK19)-positive bile ducts in the center; D: Protein gene product 9.5 (PGP9.5)-positive nerve fibers were found in the periportal tissue in the center; E and F: Branching of the hepatic artery was found in the periportal tissue (white arrow); G-J: Periphery of the liver. The Jagged-1-positive periportal tissue was thinner in the periphery than in the center, and the number of biliary structures was smaller in the periphery. Neither CK19-positive bile ducts nor PGP9.5-positive nerve fibers were found in the periphery. Scale bars = 200 μm. HE: Hematoxylin-eosin; CK19: Cytokeratin 19; SOX9: SRY-related high mobility group-box gene 9; PGP9.5: Protein gene product 9.5.
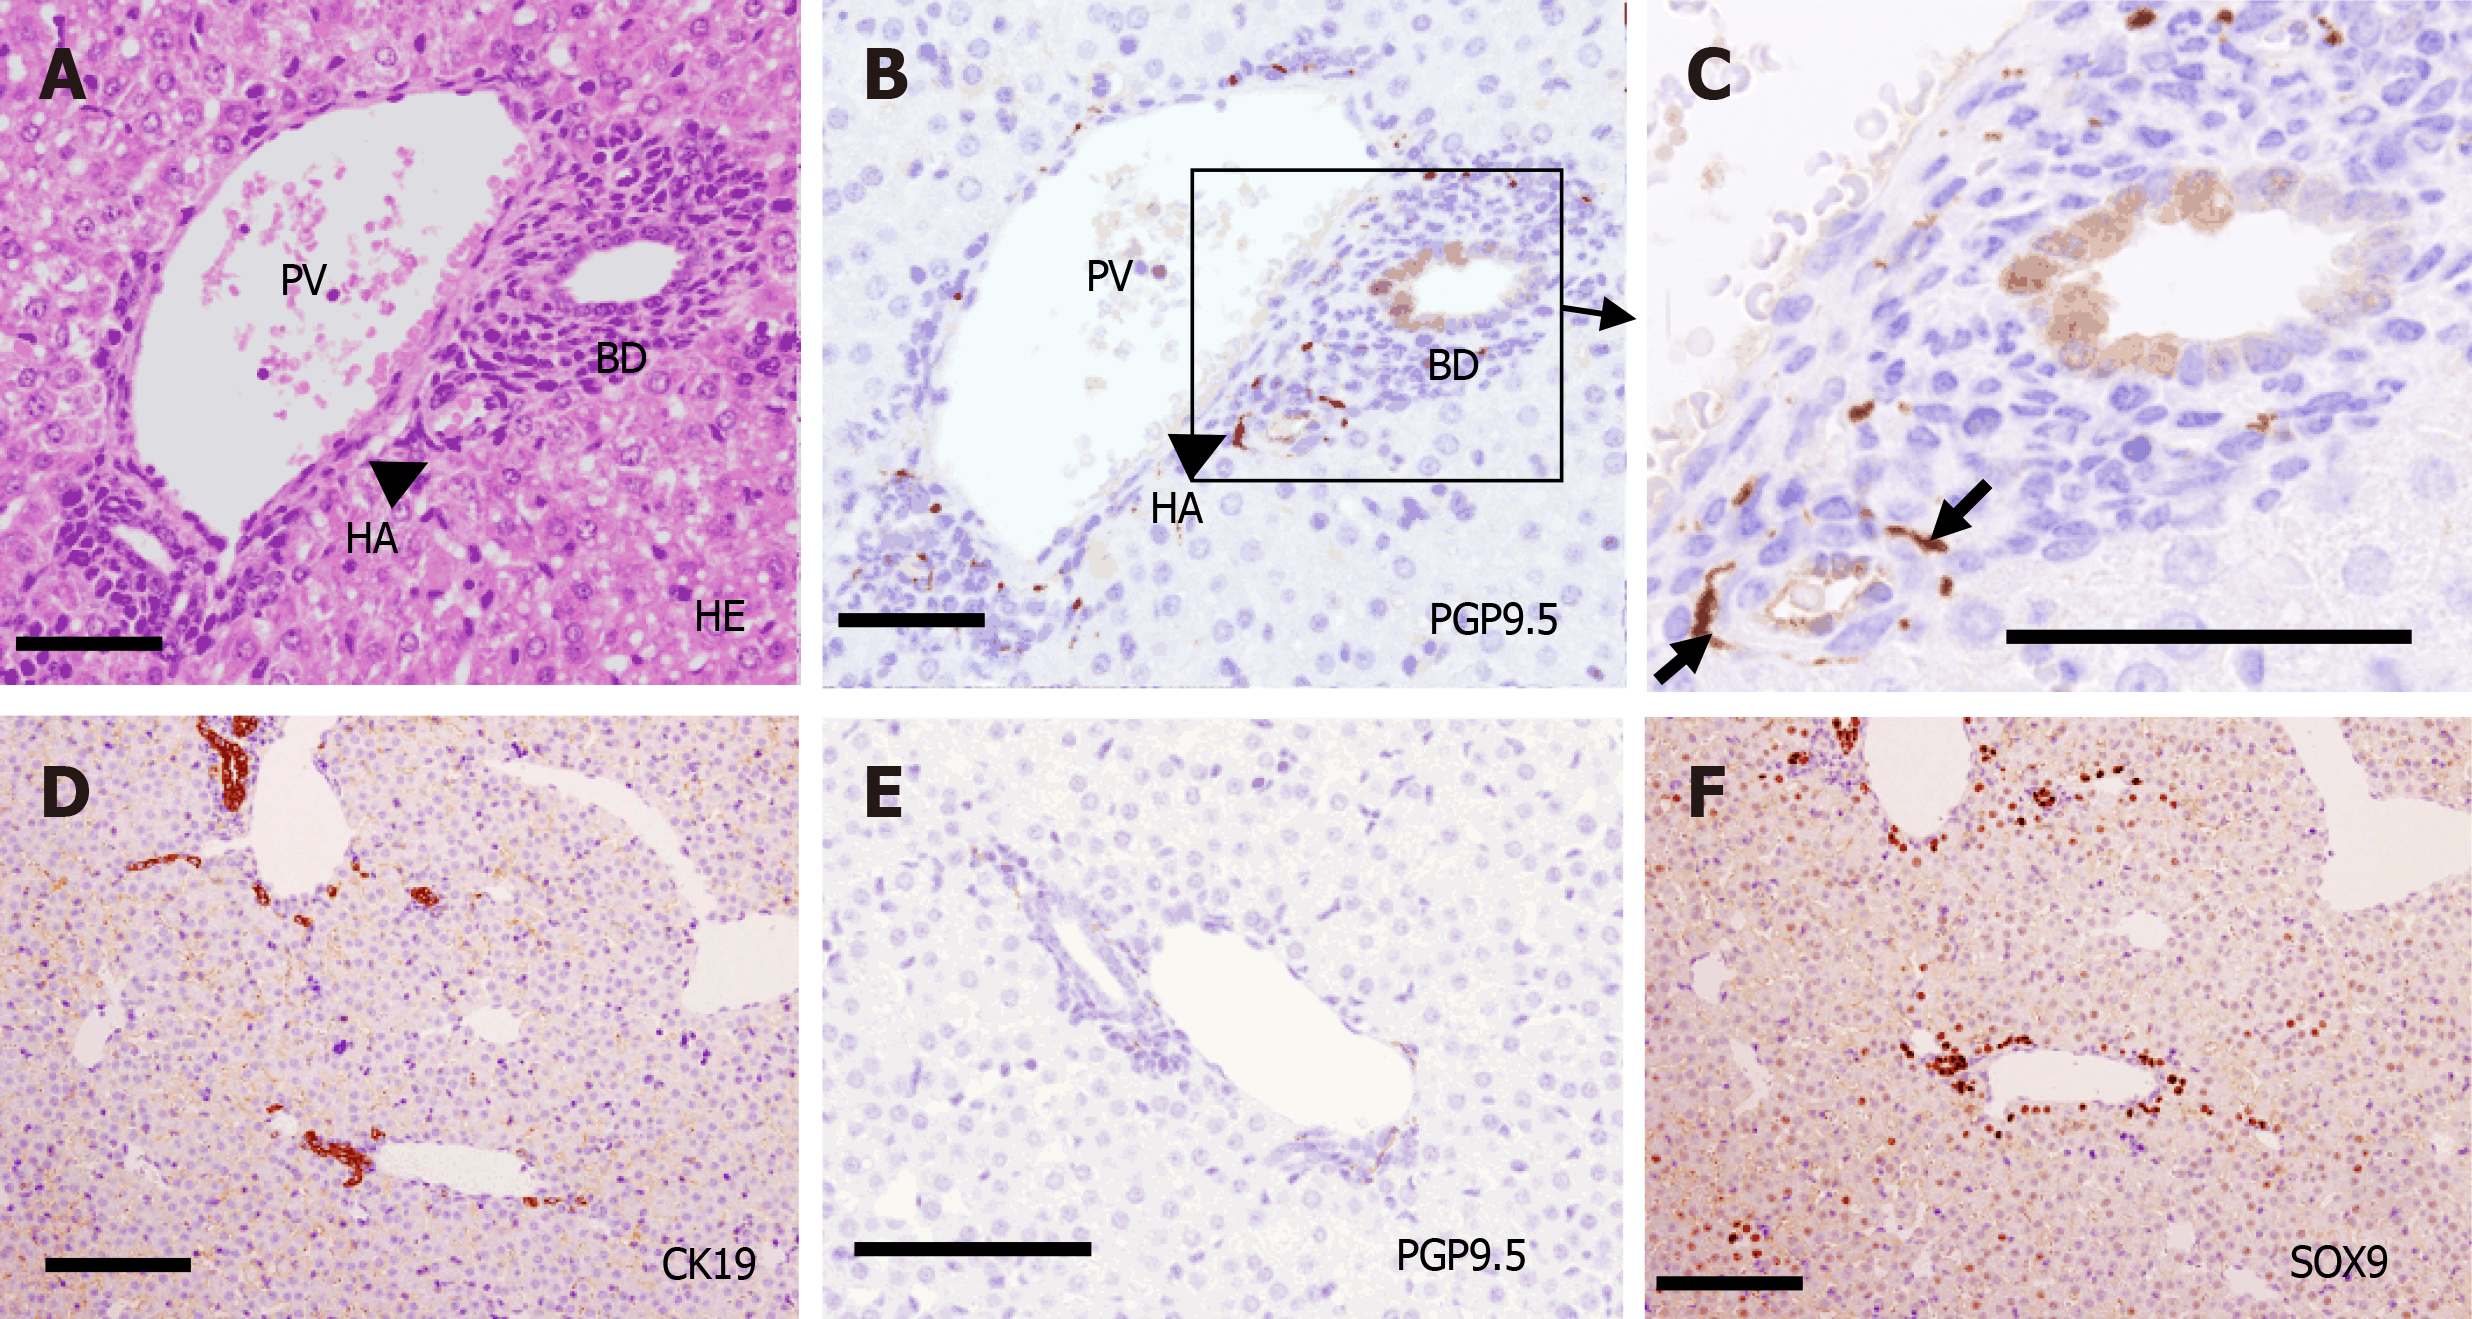
Figure 7 Immunohistochemical analysis of the portal tract at postnatal day 7.
A-C: Center of the liver. Distribution of protein gene product 9.5 (PGP9.5)-positive nerve fibers were mainly observed around the hepatic artery (C, thick arrow) and portal vein branches, with less association with bile ducts (B and C); D-F: Periphery of the liver. SRY-related high mobility group-box gene 9-positive cells constructed cytokeratin 19 (CK19)-positive bile ducts not only in the center but also in the periphery. The number of PGP9.5-positive nerve fibers increased in the portal tracts even in the periphery. Scale bar = 200 μm. PV: Portal vein; HA: Hepatic artery; BD: Bile duct; HE: Hematoxylin-eosin; CK19: Cytokeratin 19; SOX9: SRY-related high mobility group-box gene 9; PGP9.5: Protein gene product 9.5.
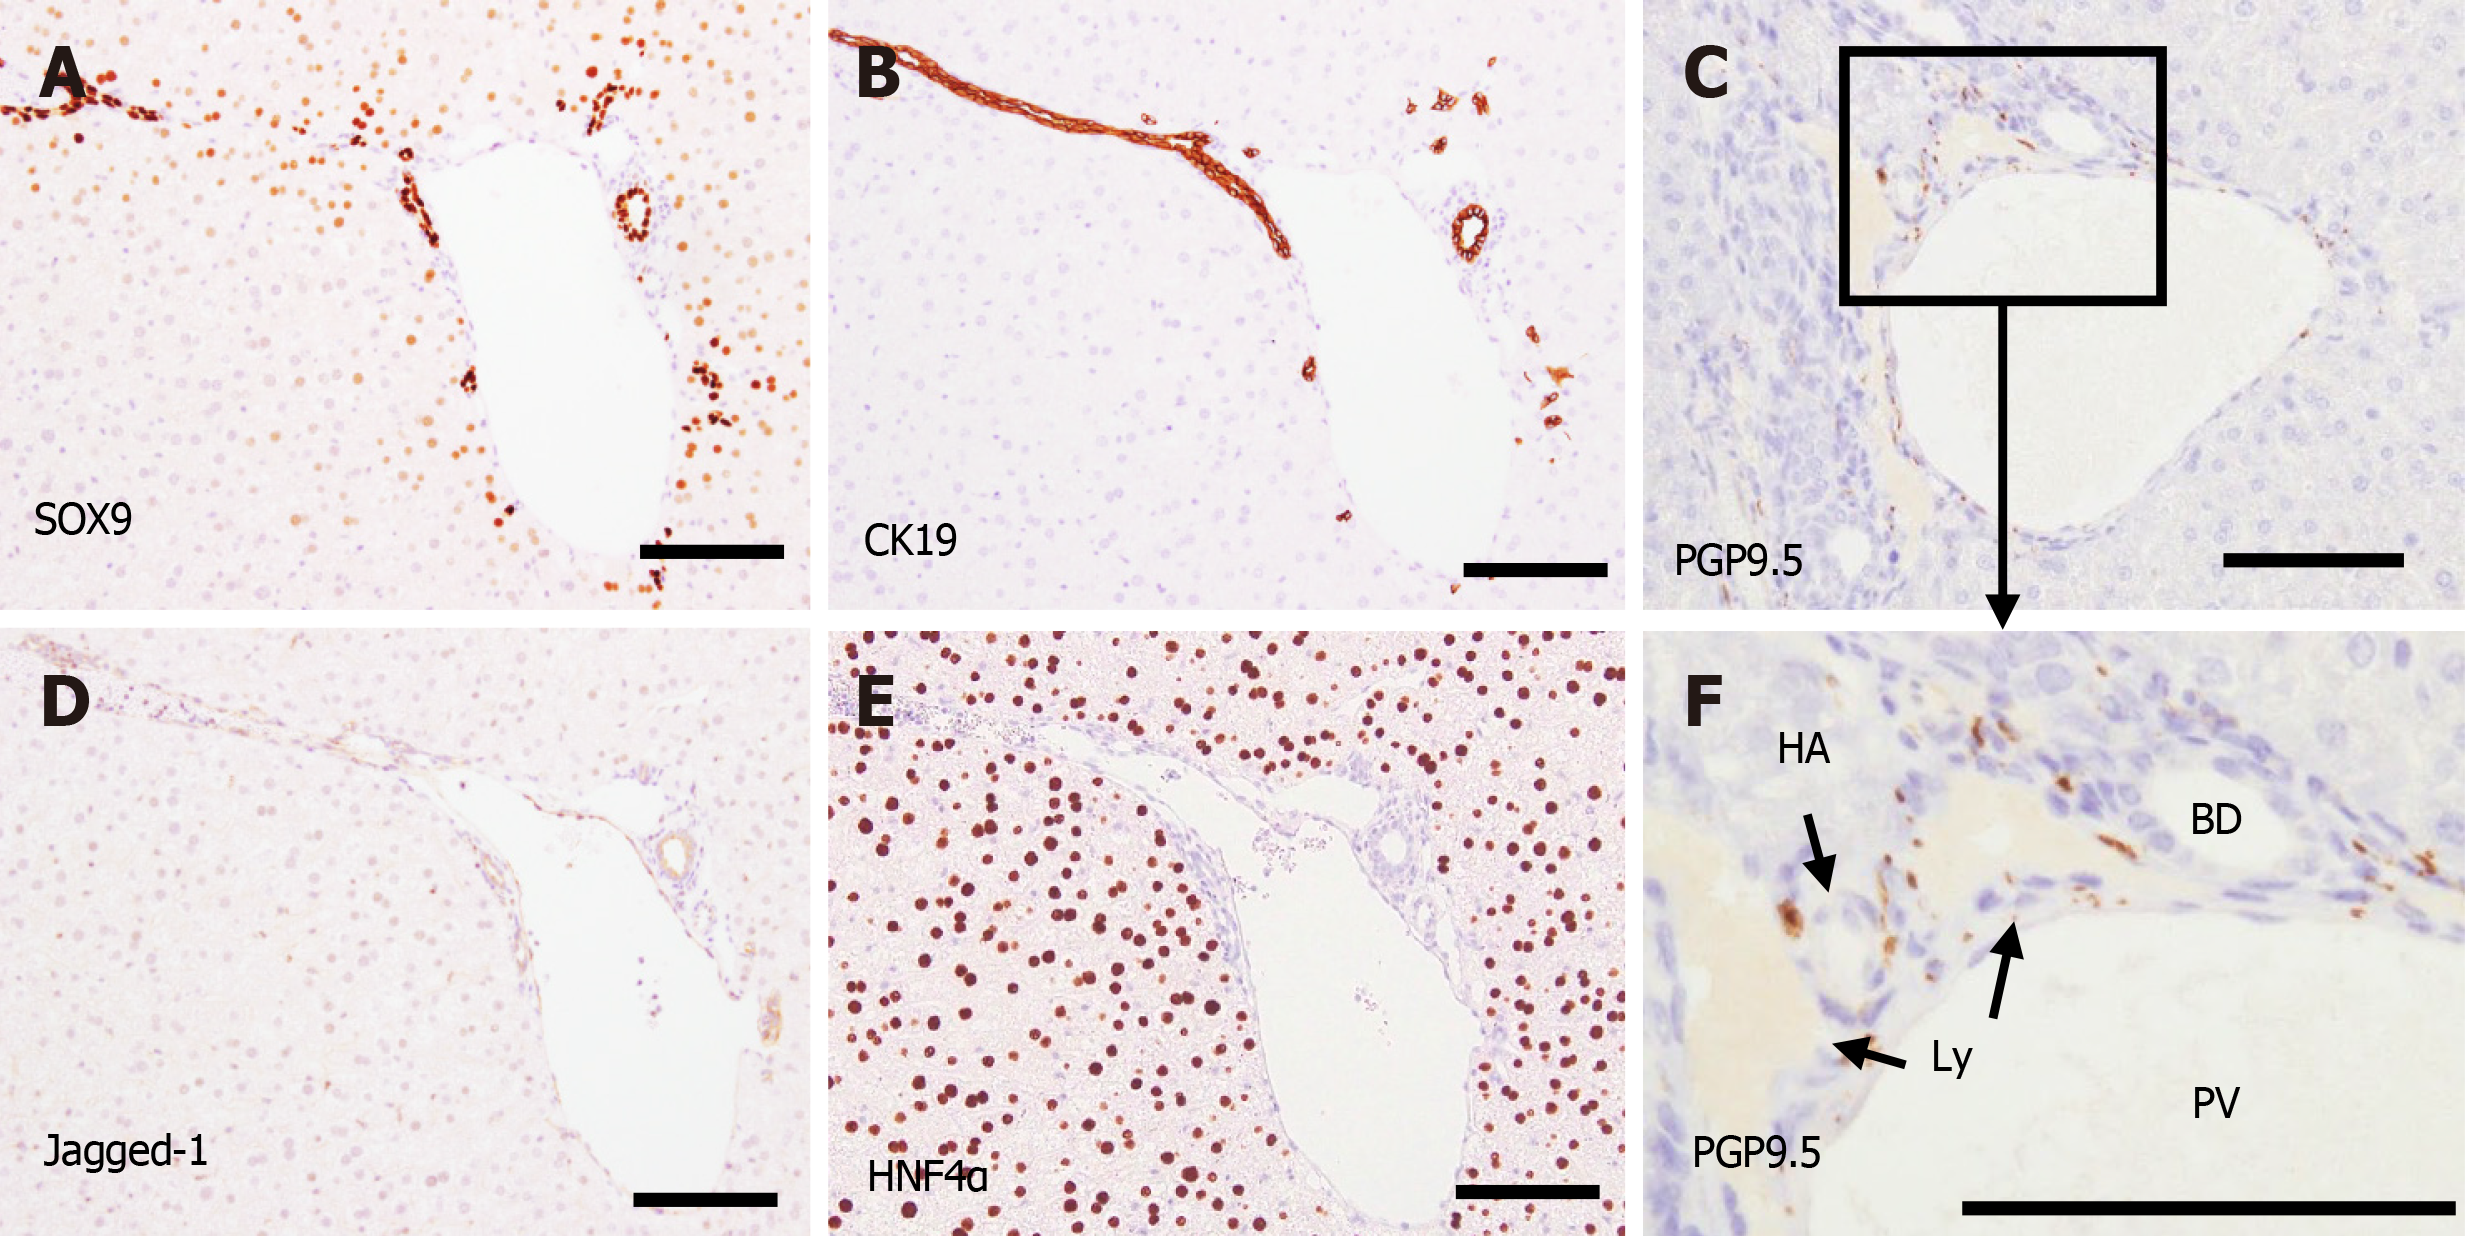
Figure 8 Immunohistochemical analysis of the portal tract in the periphery of the liver at postnatal day 28.
A: SRY-related high mobility group-box gene 9 (SOX9) was expressed in the nuclei of biliary cells; B, C and F: Many cytokeratin 19-positive biliary cells (B) and protein gene product 9.5-positive nerve fibers (C and F) were found in the portal tracts even in the periphery. No nerve fibers were found in the liver parenchyma; D: Jagged-1 expression was mainly found in the bile ducts and vessels; E: Hepatocyte nuclear factor 4α was expressed in the entire liver parenchyma. Scale bars = 200 μm. PV: Portal vein; HA: Hepatic artery; BD: Bile duct; Ly: Lymphatic vessel; CK19: Cytokeratin 19; SOX9: SRY-related high mobility group-box gene 9; PGP9.5: Protein gene product 9.5.
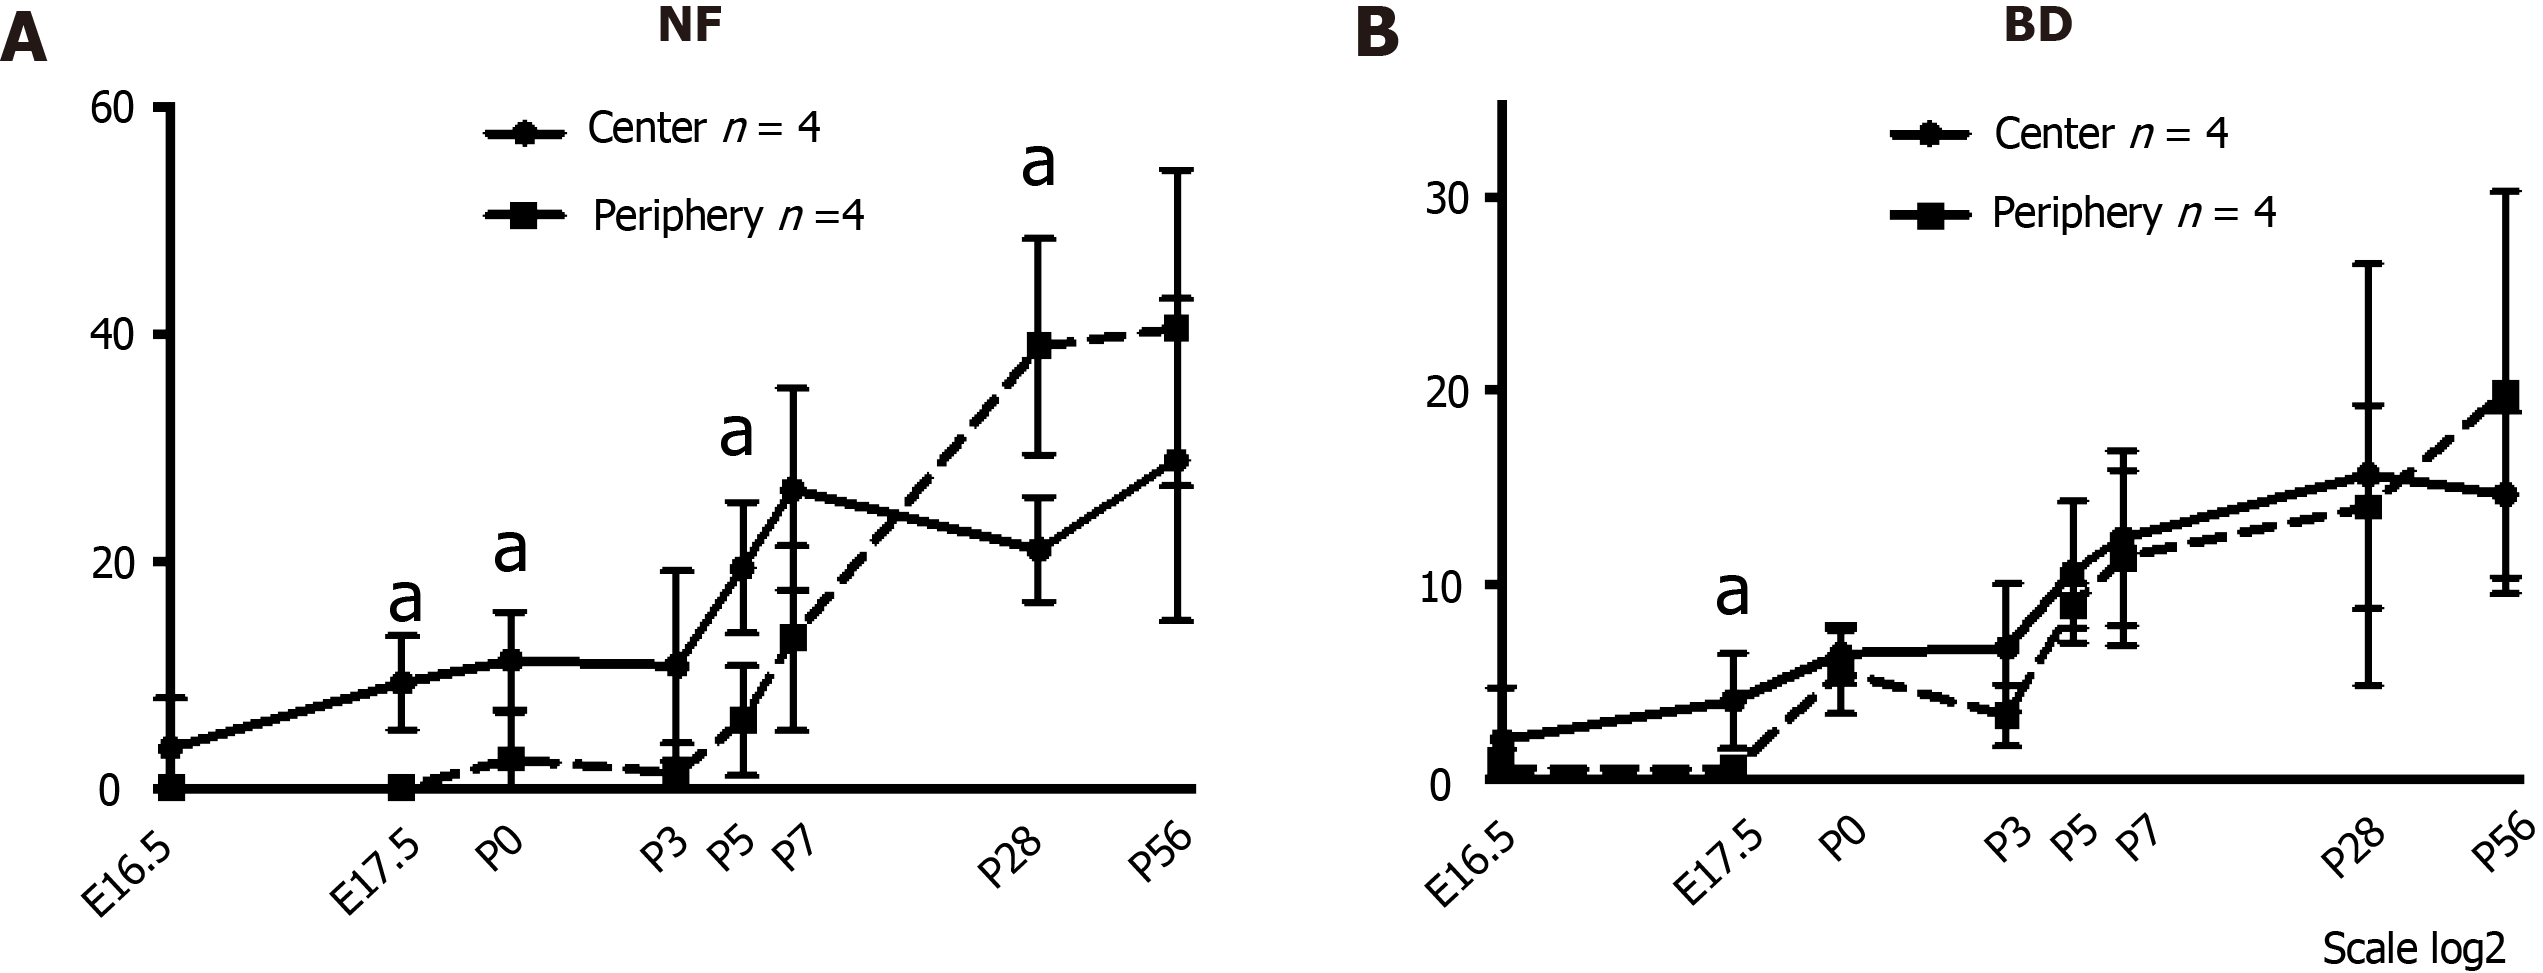
Figure 9 The number of the nerve fibers and intrahepatic bile ducts during murine liver development.
A: NF; B: BD. Nerve fibers and bile ducts were first found in the periportal area of the center at embryonic day 16.5. The numbers of nerve fibers and bile ducts were significantly larger, especially at the early phase of development, in the center than in the periphery. Their numbers gradually increased in the portal tracts until postnatal day 7 in the center and increased thereafter in the periphery. NF: Nerve fiber; BD: Bile duct; E: Embryonic day; P: Postnatal day. aP < 0.05.
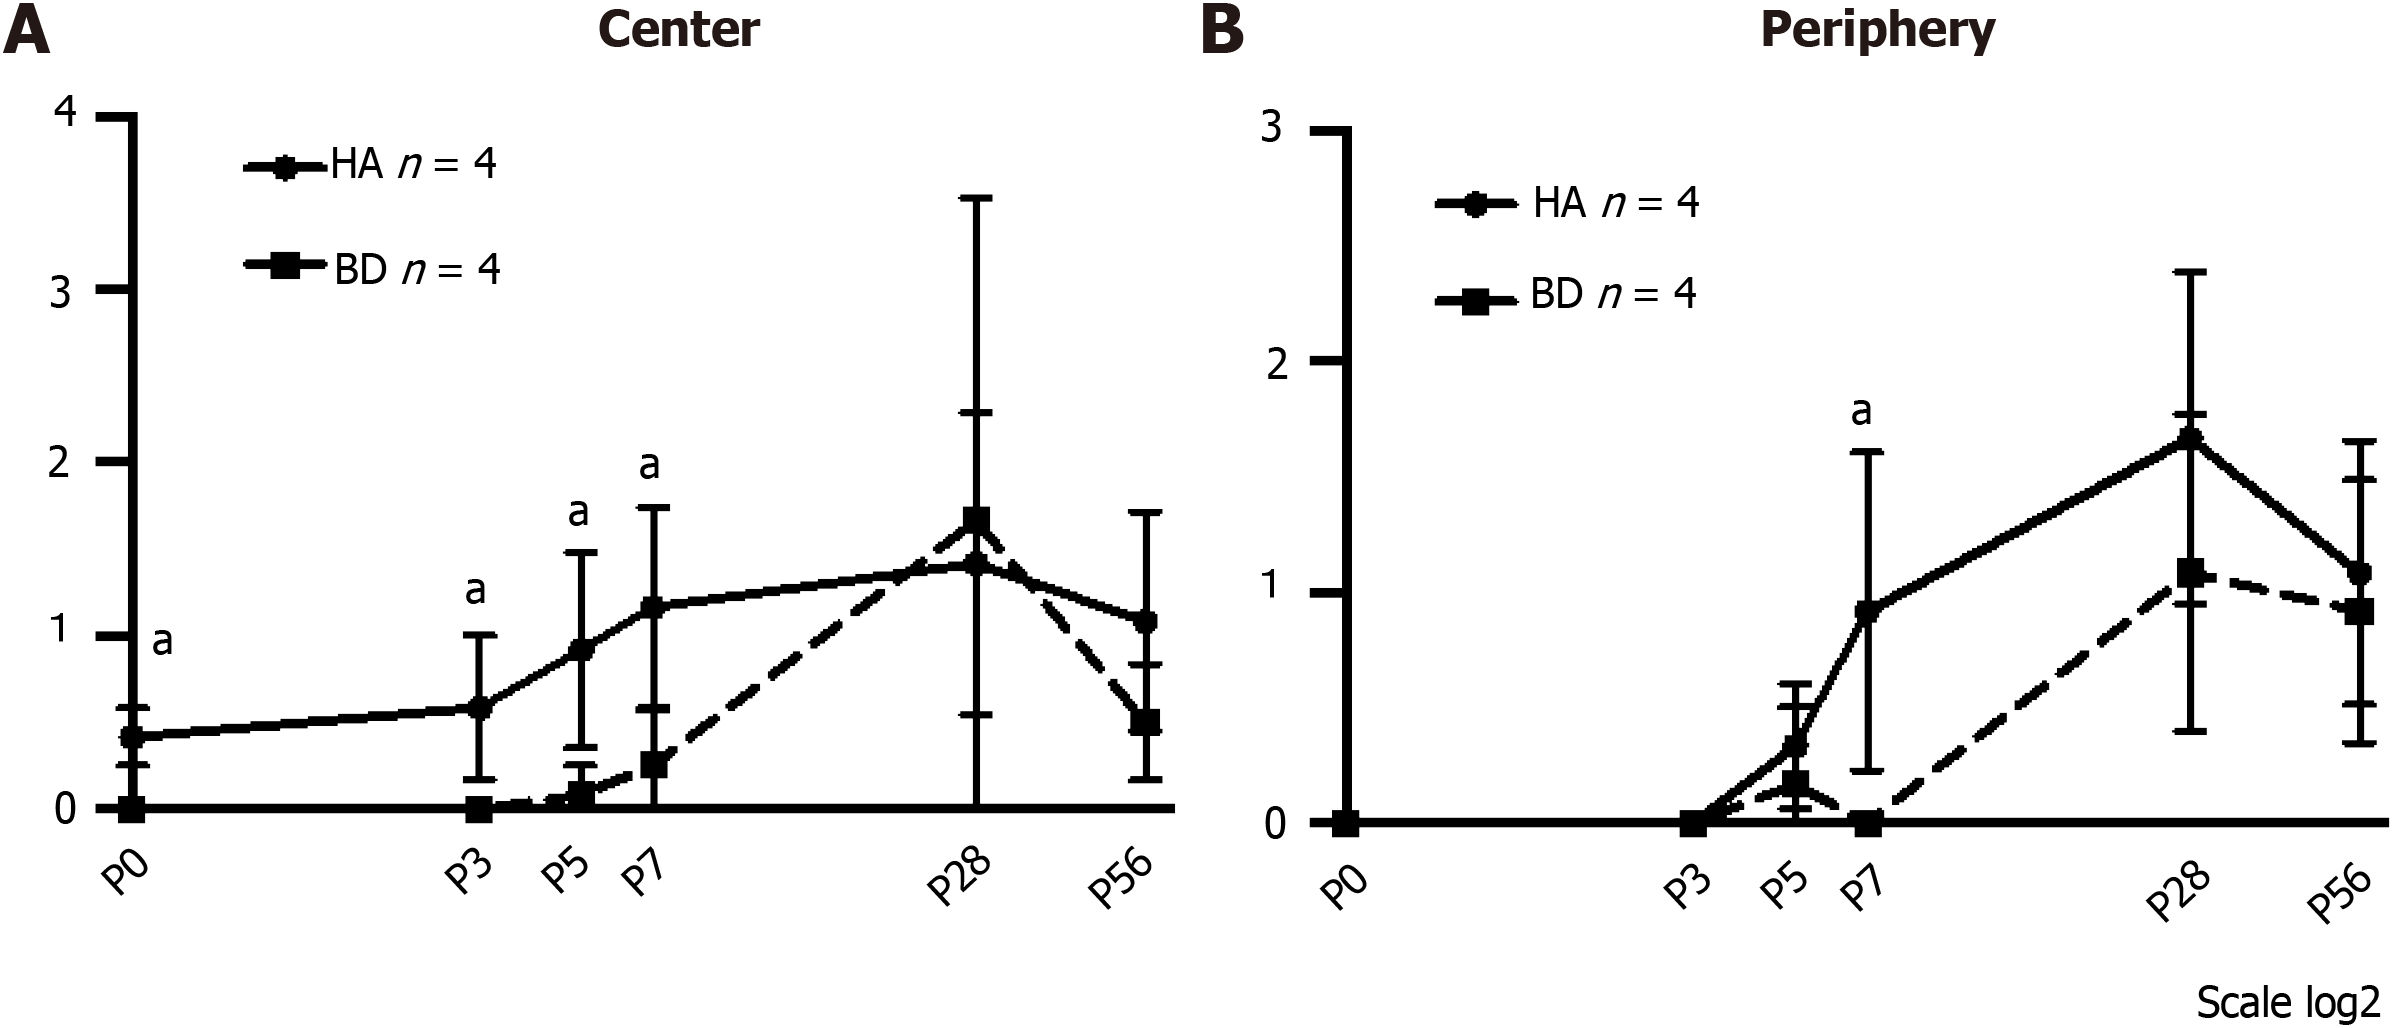
Figure 10 Number of contacts between nerve fibers and hepatic arteries or intrahepatic bile ducts.
A: Center; B: Periphery. Nerve fiber (NF) contacts were observed at an earlier phase in the hepatic artery (HA) than in the intrahepatic bile duct (IHBD). The number of NF-HA contacts was significantly larger than that of NF-IHBD contacts from P0 to P7 in the center. NF contacts emerged also in the periphery after P3. The number of NF-HA contacts was larger than that of NF-IHBD contacts in the periphery as well. NF: Nerve fiber; BD: Bile duct; HA: Hepatic artery; E: Embryonic day; P: Postnatal day. aP < 0.05.
- Citation: Koike N, Tadokoro T, Ueno Y, Okamoto S, Kobayashi T, Murata S, Taniguchi H. Development of the nervous system in mouse liver. World J Hepatol 2022; 14(2): 386-399
- URL: https://www.wjgnet.com/1948-5182/full/v14/i2/386.htm
- DOI: https://dx.doi.org/10.4254/wjh.v14.i2.386


