Copyright
©The Author(s) 2020.
World J Hepatol. Jul 27, 2020; 12(7): 389-398
Published online Jul 27, 2020. doi: 10.4254/wjh.v12.i7.389
Published online Jul 27, 2020. doi: 10.4254/wjh.v12.i7.389
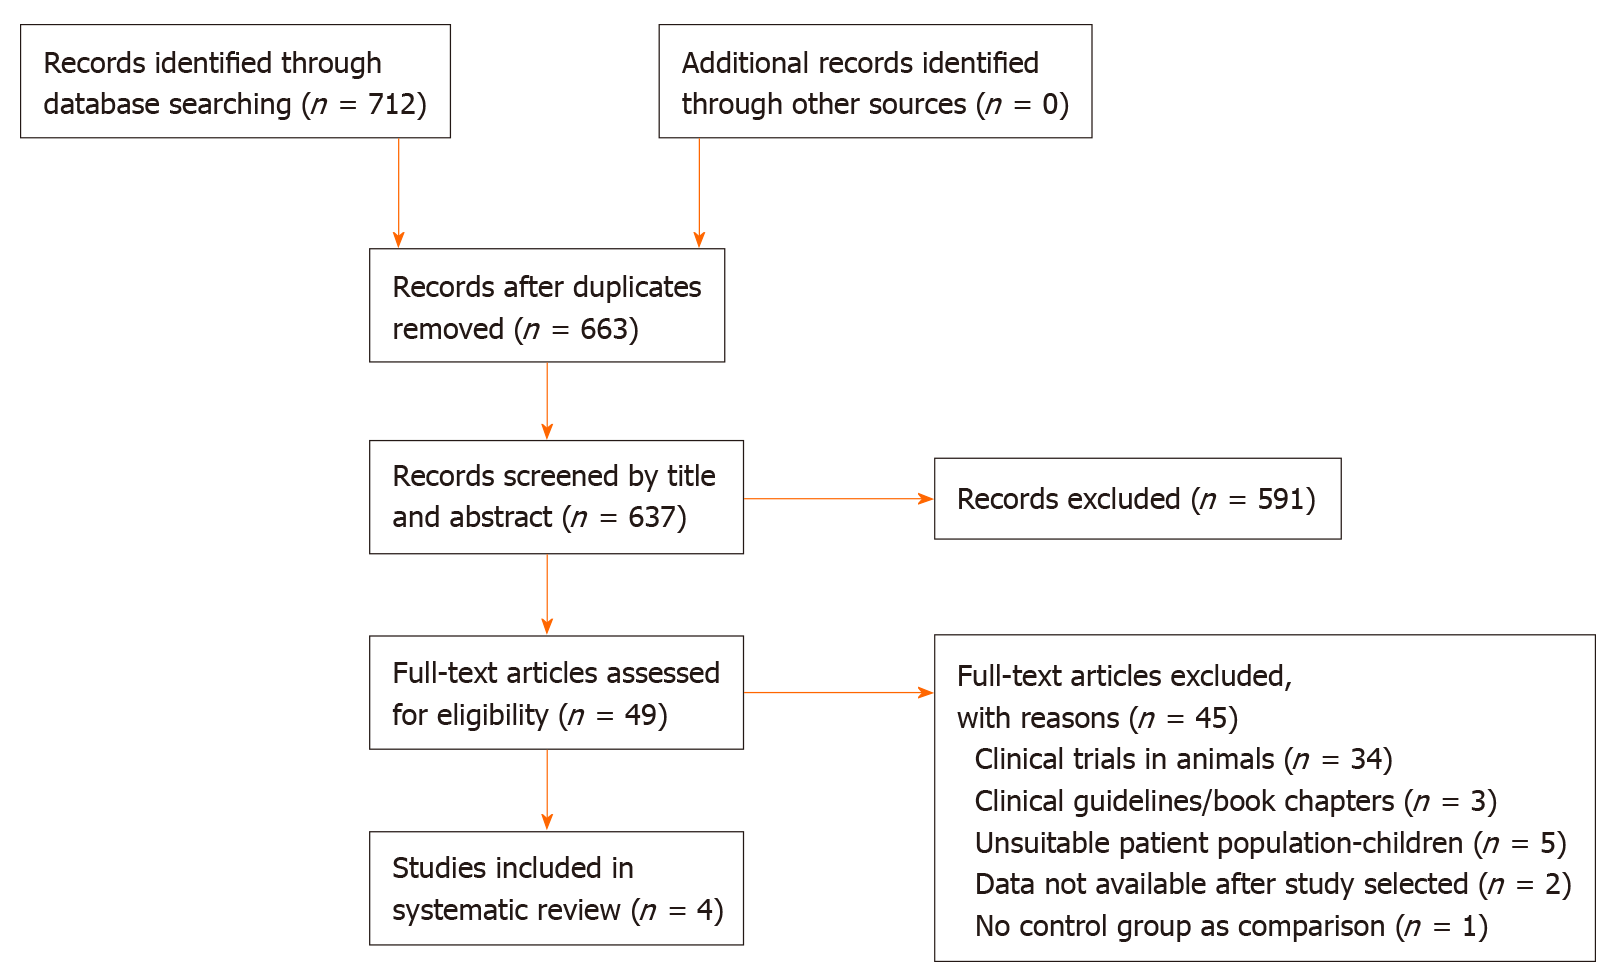
Figure 1 Flow diagram of study identification and selection.
Figure 2 Forest plot of all included randomized controlled trials using a random effects model.
Risk ratio 0.98 (95% confidence interval: 0.90-1.05); Heterogeneity: I2 = 66%; P = 0.03. CI: Confidence interval.
Figure 3 Forest plot of included randomized controlled trials reporting 6 mo mortality using a random effects model (Vilar Gomez et al[18] excluded).
Risk ratio 1.00 (95% confidence interval: 0.96-1.05), Heterogeneity: I2 = 0%; P = 0.52. CI: Confidence interval.
- Citation: Tan HK, Streeter A, Cramp ME, Dhanda AD. Effect of zinc treatment on clinical outcomes in patients with liver cirrhosis: A systematic review and meta-analysis. World J Hepatol 2020; 12(7): 389-398
- URL: https://www.wjgnet.com/1948-5182/full/v12/i7/389.htm
- DOI: https://dx.doi.org/10.4254/wjh.v12.i7.389


