Copyright
©The Author(s) 2020.
World J Hepatol. May 27, 2020; 12(5): 184-206
Published online May 27, 2020. doi: 10.4254/wjh.v12.i5.184
Published online May 27, 2020. doi: 10.4254/wjh.v12.i5.184
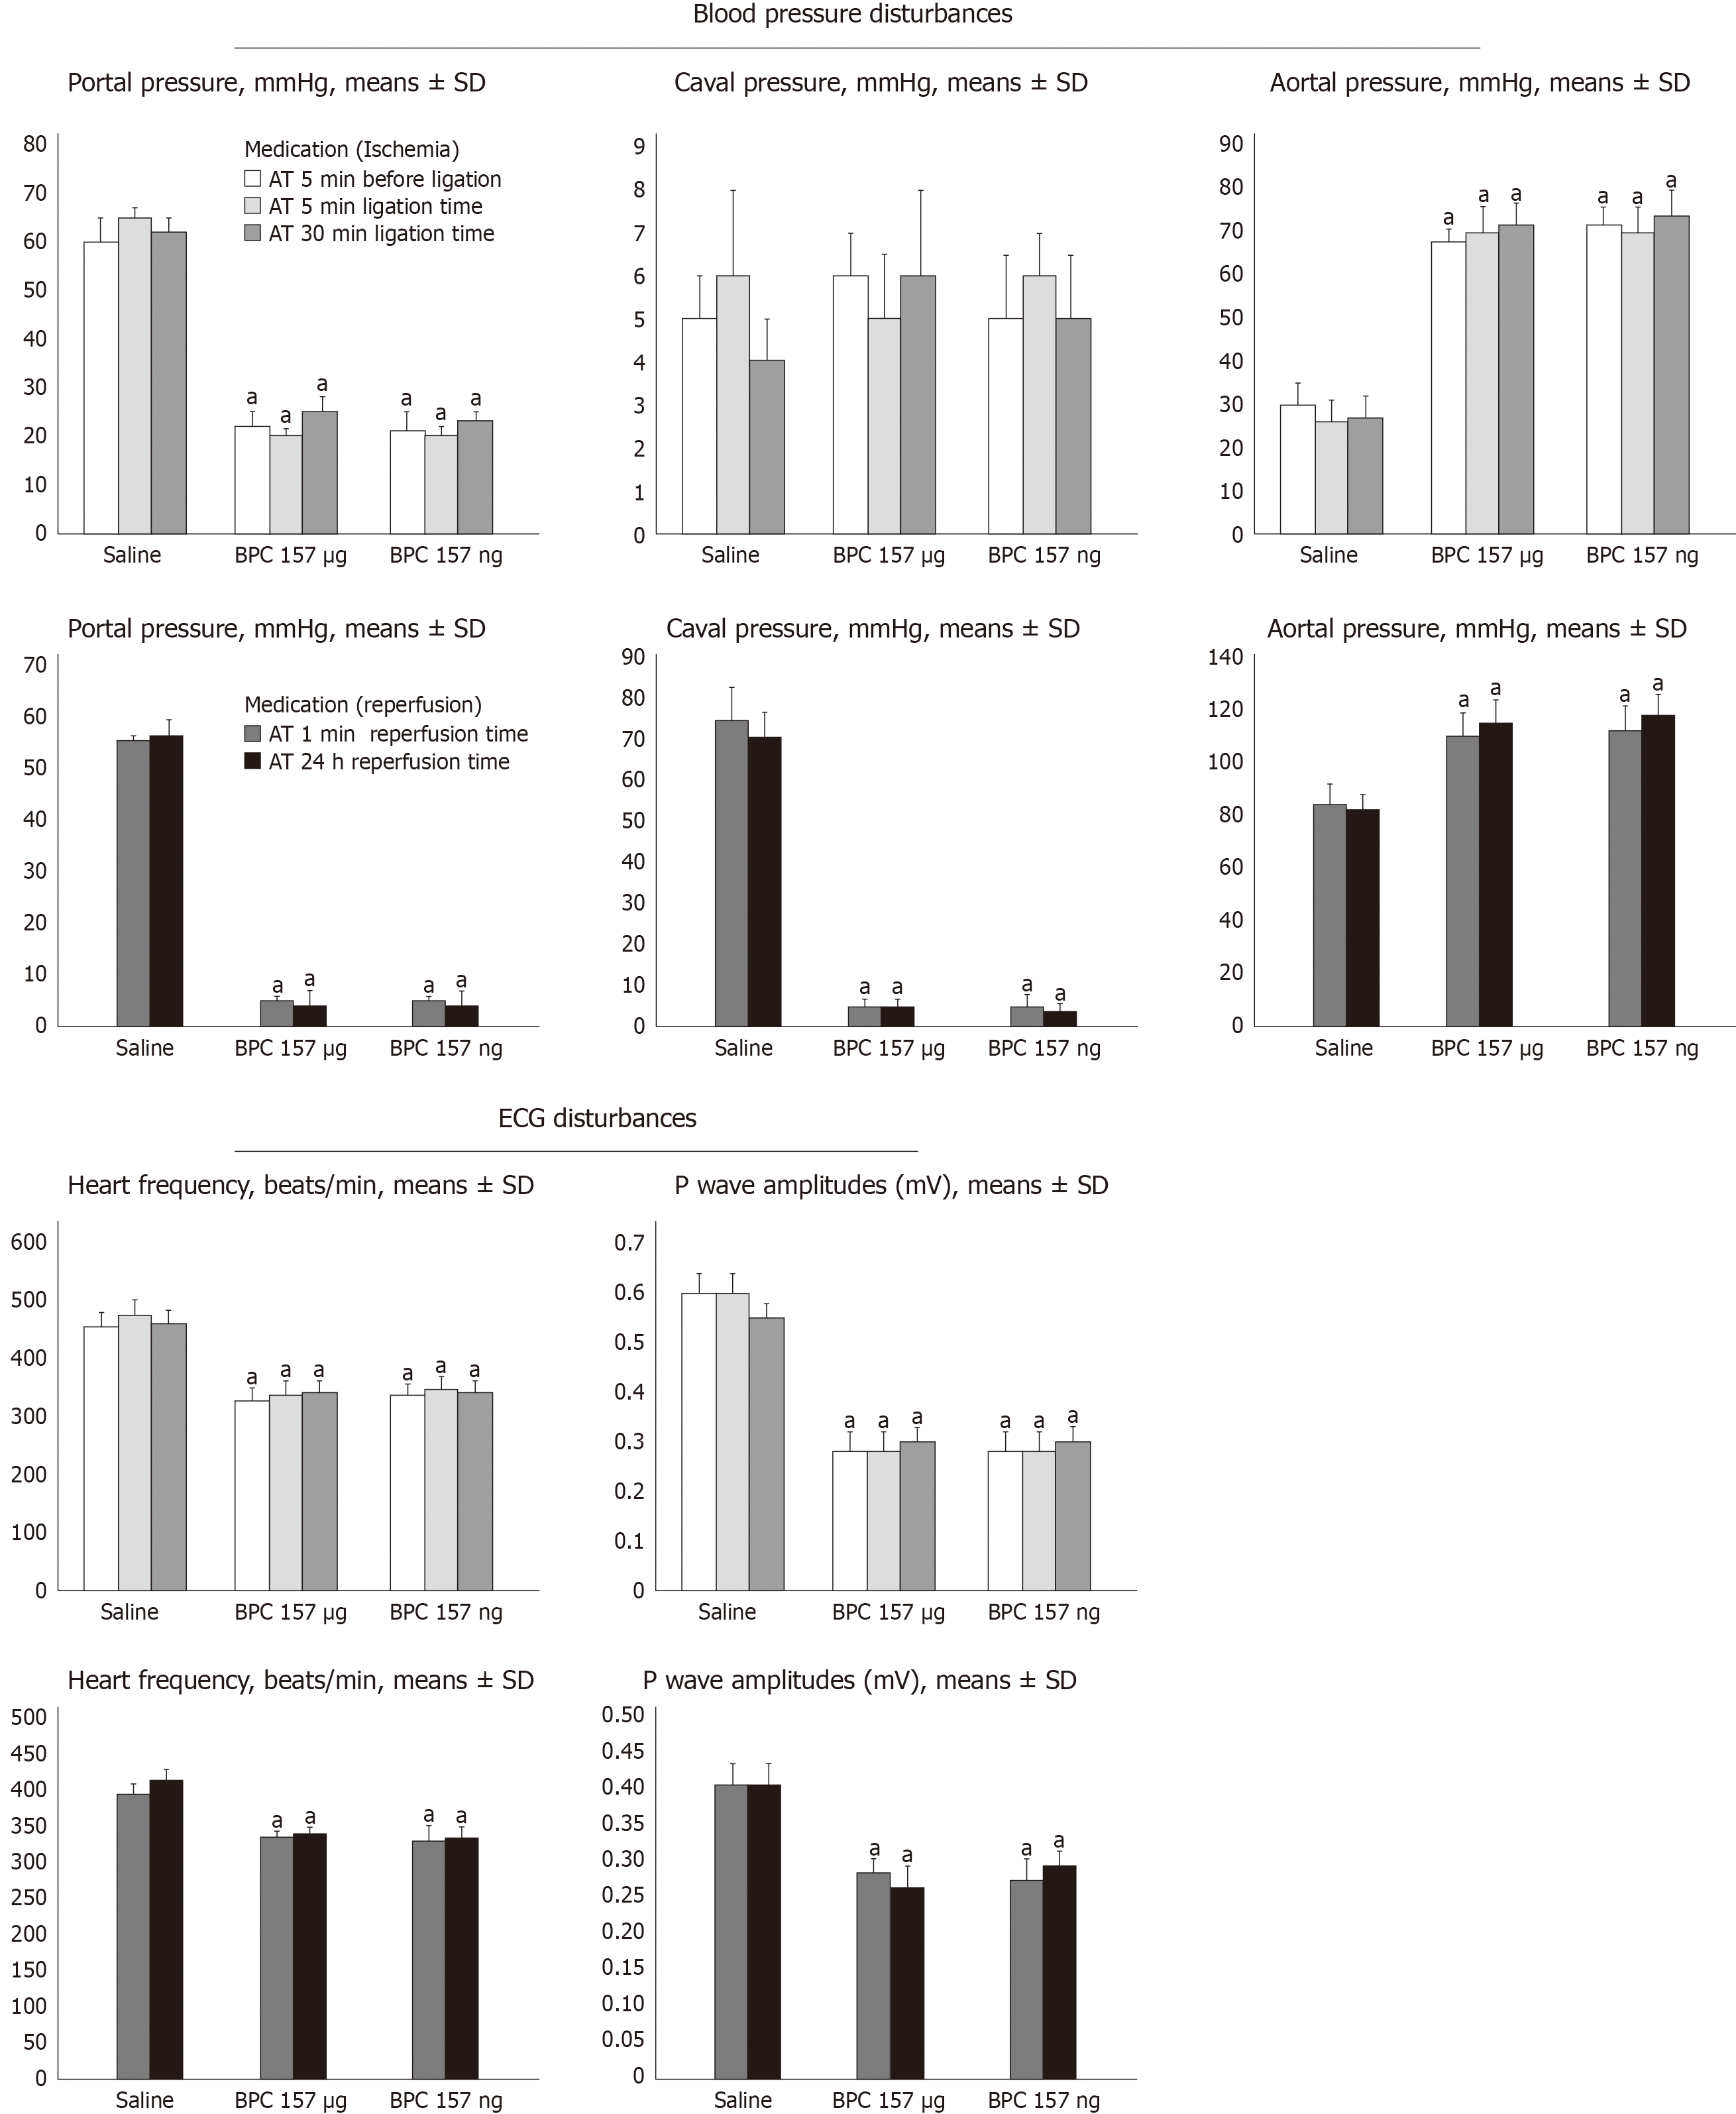
Figure 1 Counteracting effect of BPC 157 on portal, caval hypertension and aortal hypotension, sinus tachycardia, peaked P waves, in (1) ischemia and (2) reperfusion.
Portal, caval and aortal pressure (mmHg); P wave amplitudes (Mv) and heart frequency (beats/min) in rats (1) with portal triad obstruction (PTO), at the end of 30 min PTO-period, or (2) after PTO, at the end of 24 h period of reperfusion, mean ± SD. Medication [BPC 157 10 µg/kg, 10 ng/kg, or saline (1 ml/rat)] was given: (1) intraperitoneally at 5 min before PTO, or as a bath administration was given at 5 min or at 30 min PTO-time; and (2) a bath administration given at 1 min or at 24 h after reperfusion initiation. The same results were obtained at 5 min reperfusion time (data not specifically shown). aP < 0.05, at least vs control. ECG: Electrocardiogram.
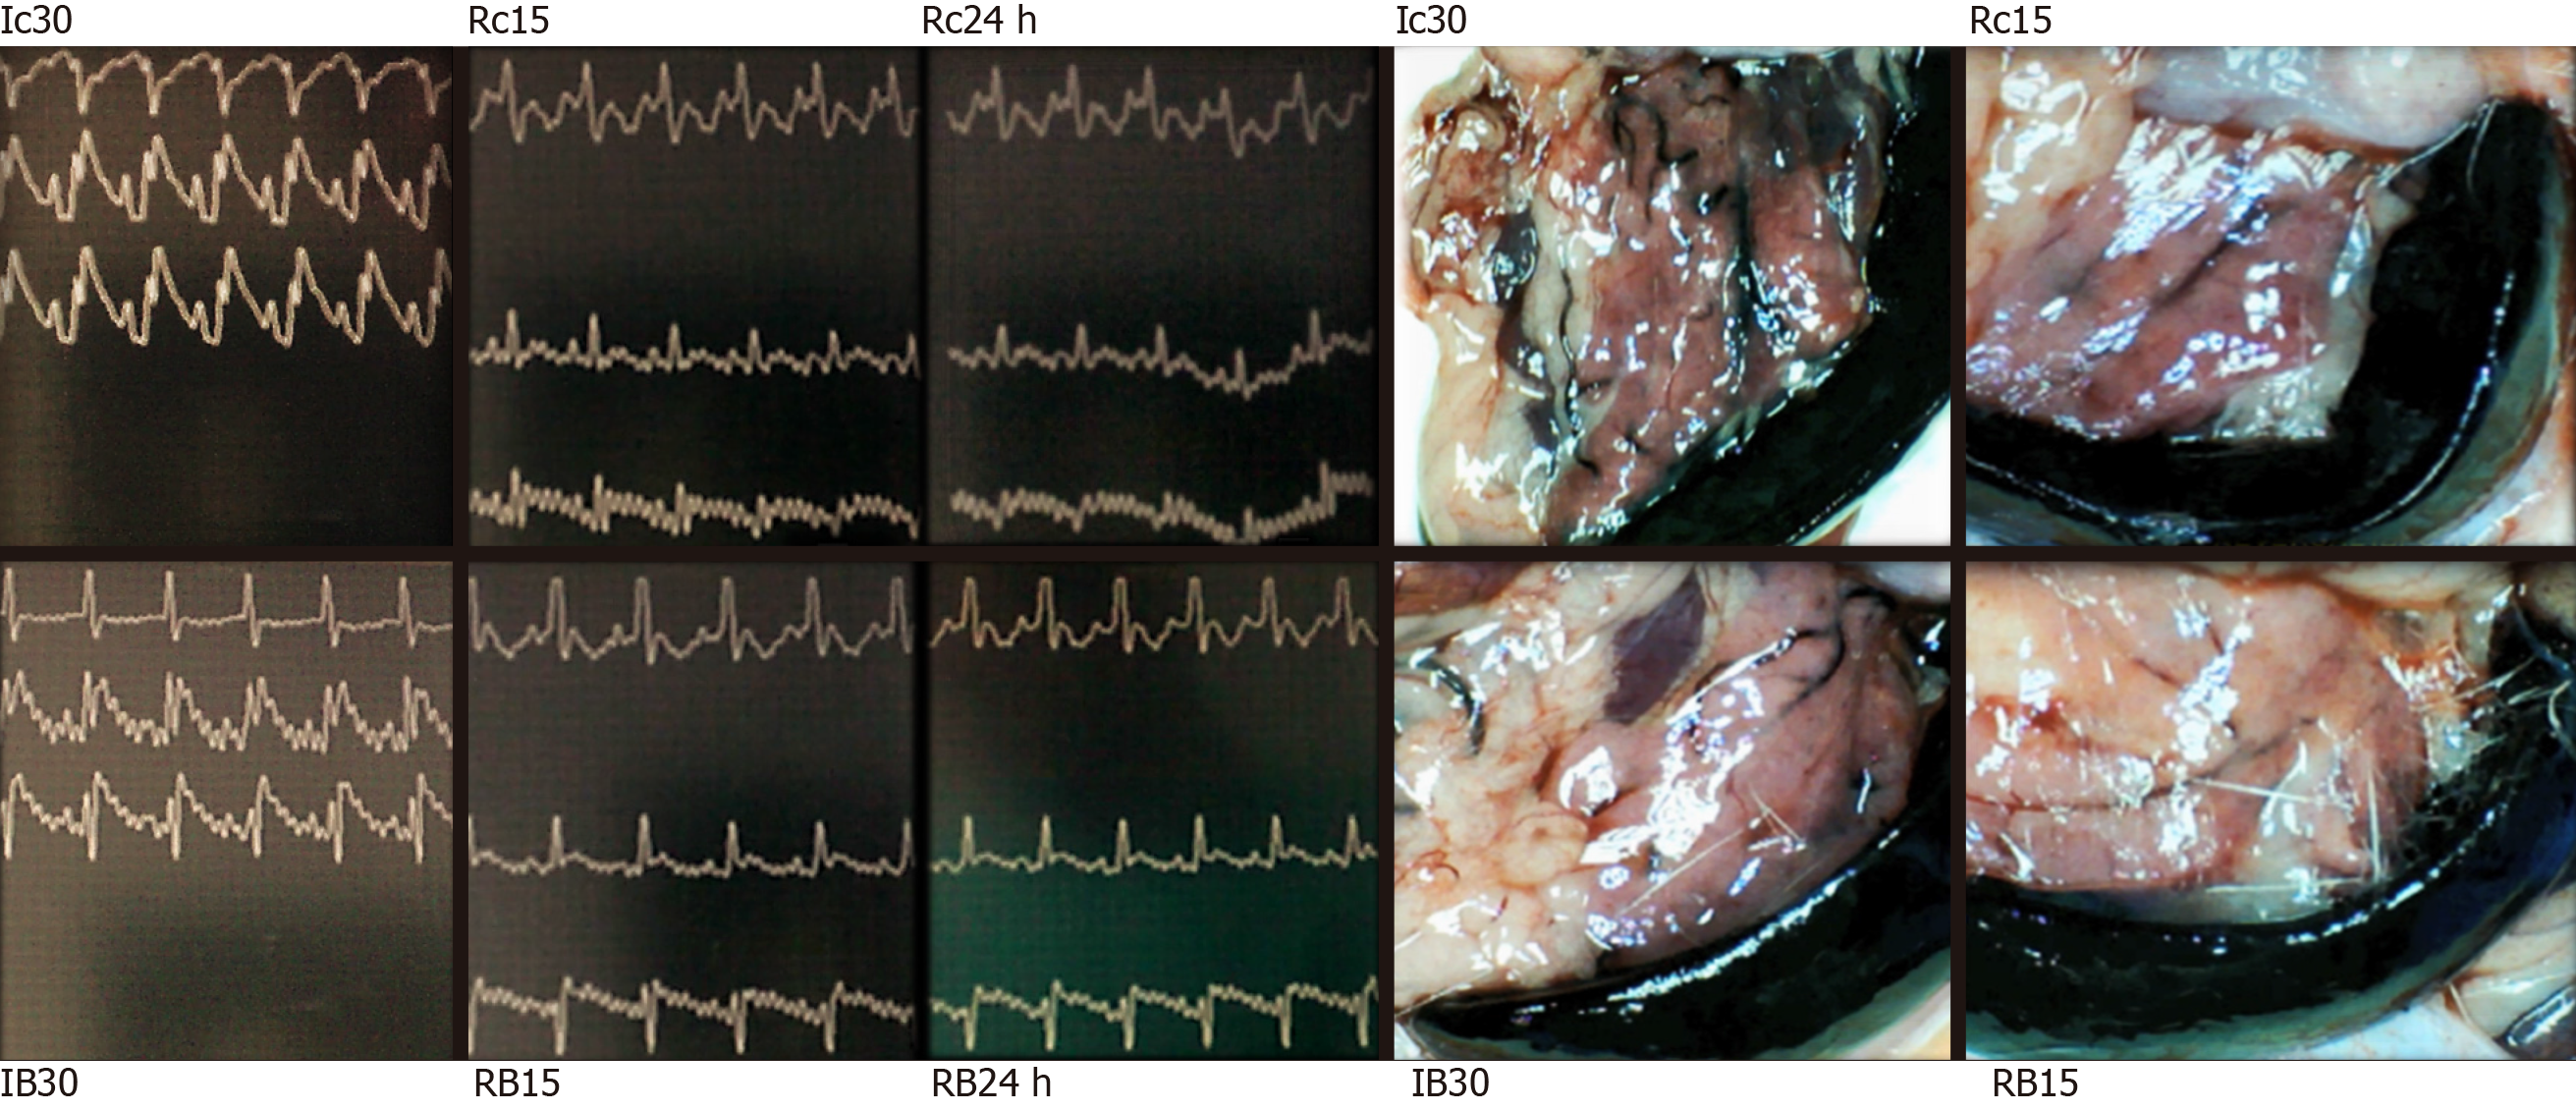
Figure 2 BPC 157 effect on electrocardiogram-disturbances (left) and lienal veins (right) presentation.
Electrocardiogram presentation [lead I (upper), lead II (middle), lead III (low)] at 30 min of portal triad obstruction (PTO)-ligation (Ic30; IB30) or in reperfusion (Rc15, RB15, Rc24 h, RB24 h) at 15 min and 24 h reperfusion-time in controls (Ic30, Rc15, Rc24 h) or BPC 157 (IB30, RB15, RB24 h)-rats. Note, while PTO control rats are regularly presenting with sinus tachycardia, peaked P waves (Ic30, Rc15, Rc24 h), RBBB pattern of QRS complexes (Ic30), BPC 157 application markedly prevented or reversed all of these disturbances, having sinus rhythm in normal range of heart frequency. Presentation of lienal veins, congestion and tortuosity in control rats at 30 min PTO-ligation time (Ic30, scored 3/4/4 Min/Med/Max) and at 15 min reperfusion time (Rc15, scored 2/2/2). Marked attenuation occurs in BPC 157 rats at 30 min PTO-ligation time [IB30, scored 2/2/2 (µg), 2/2/2 (ng), aP < 0.05, at least vs control], or in rats used to have PTO, at 15 min reperfusion time [RB15, scored 1/1/1 (µg), 1/1/1 (ng), aP < 0.05, at least vs control] as well as at 24 h reperfusion time.
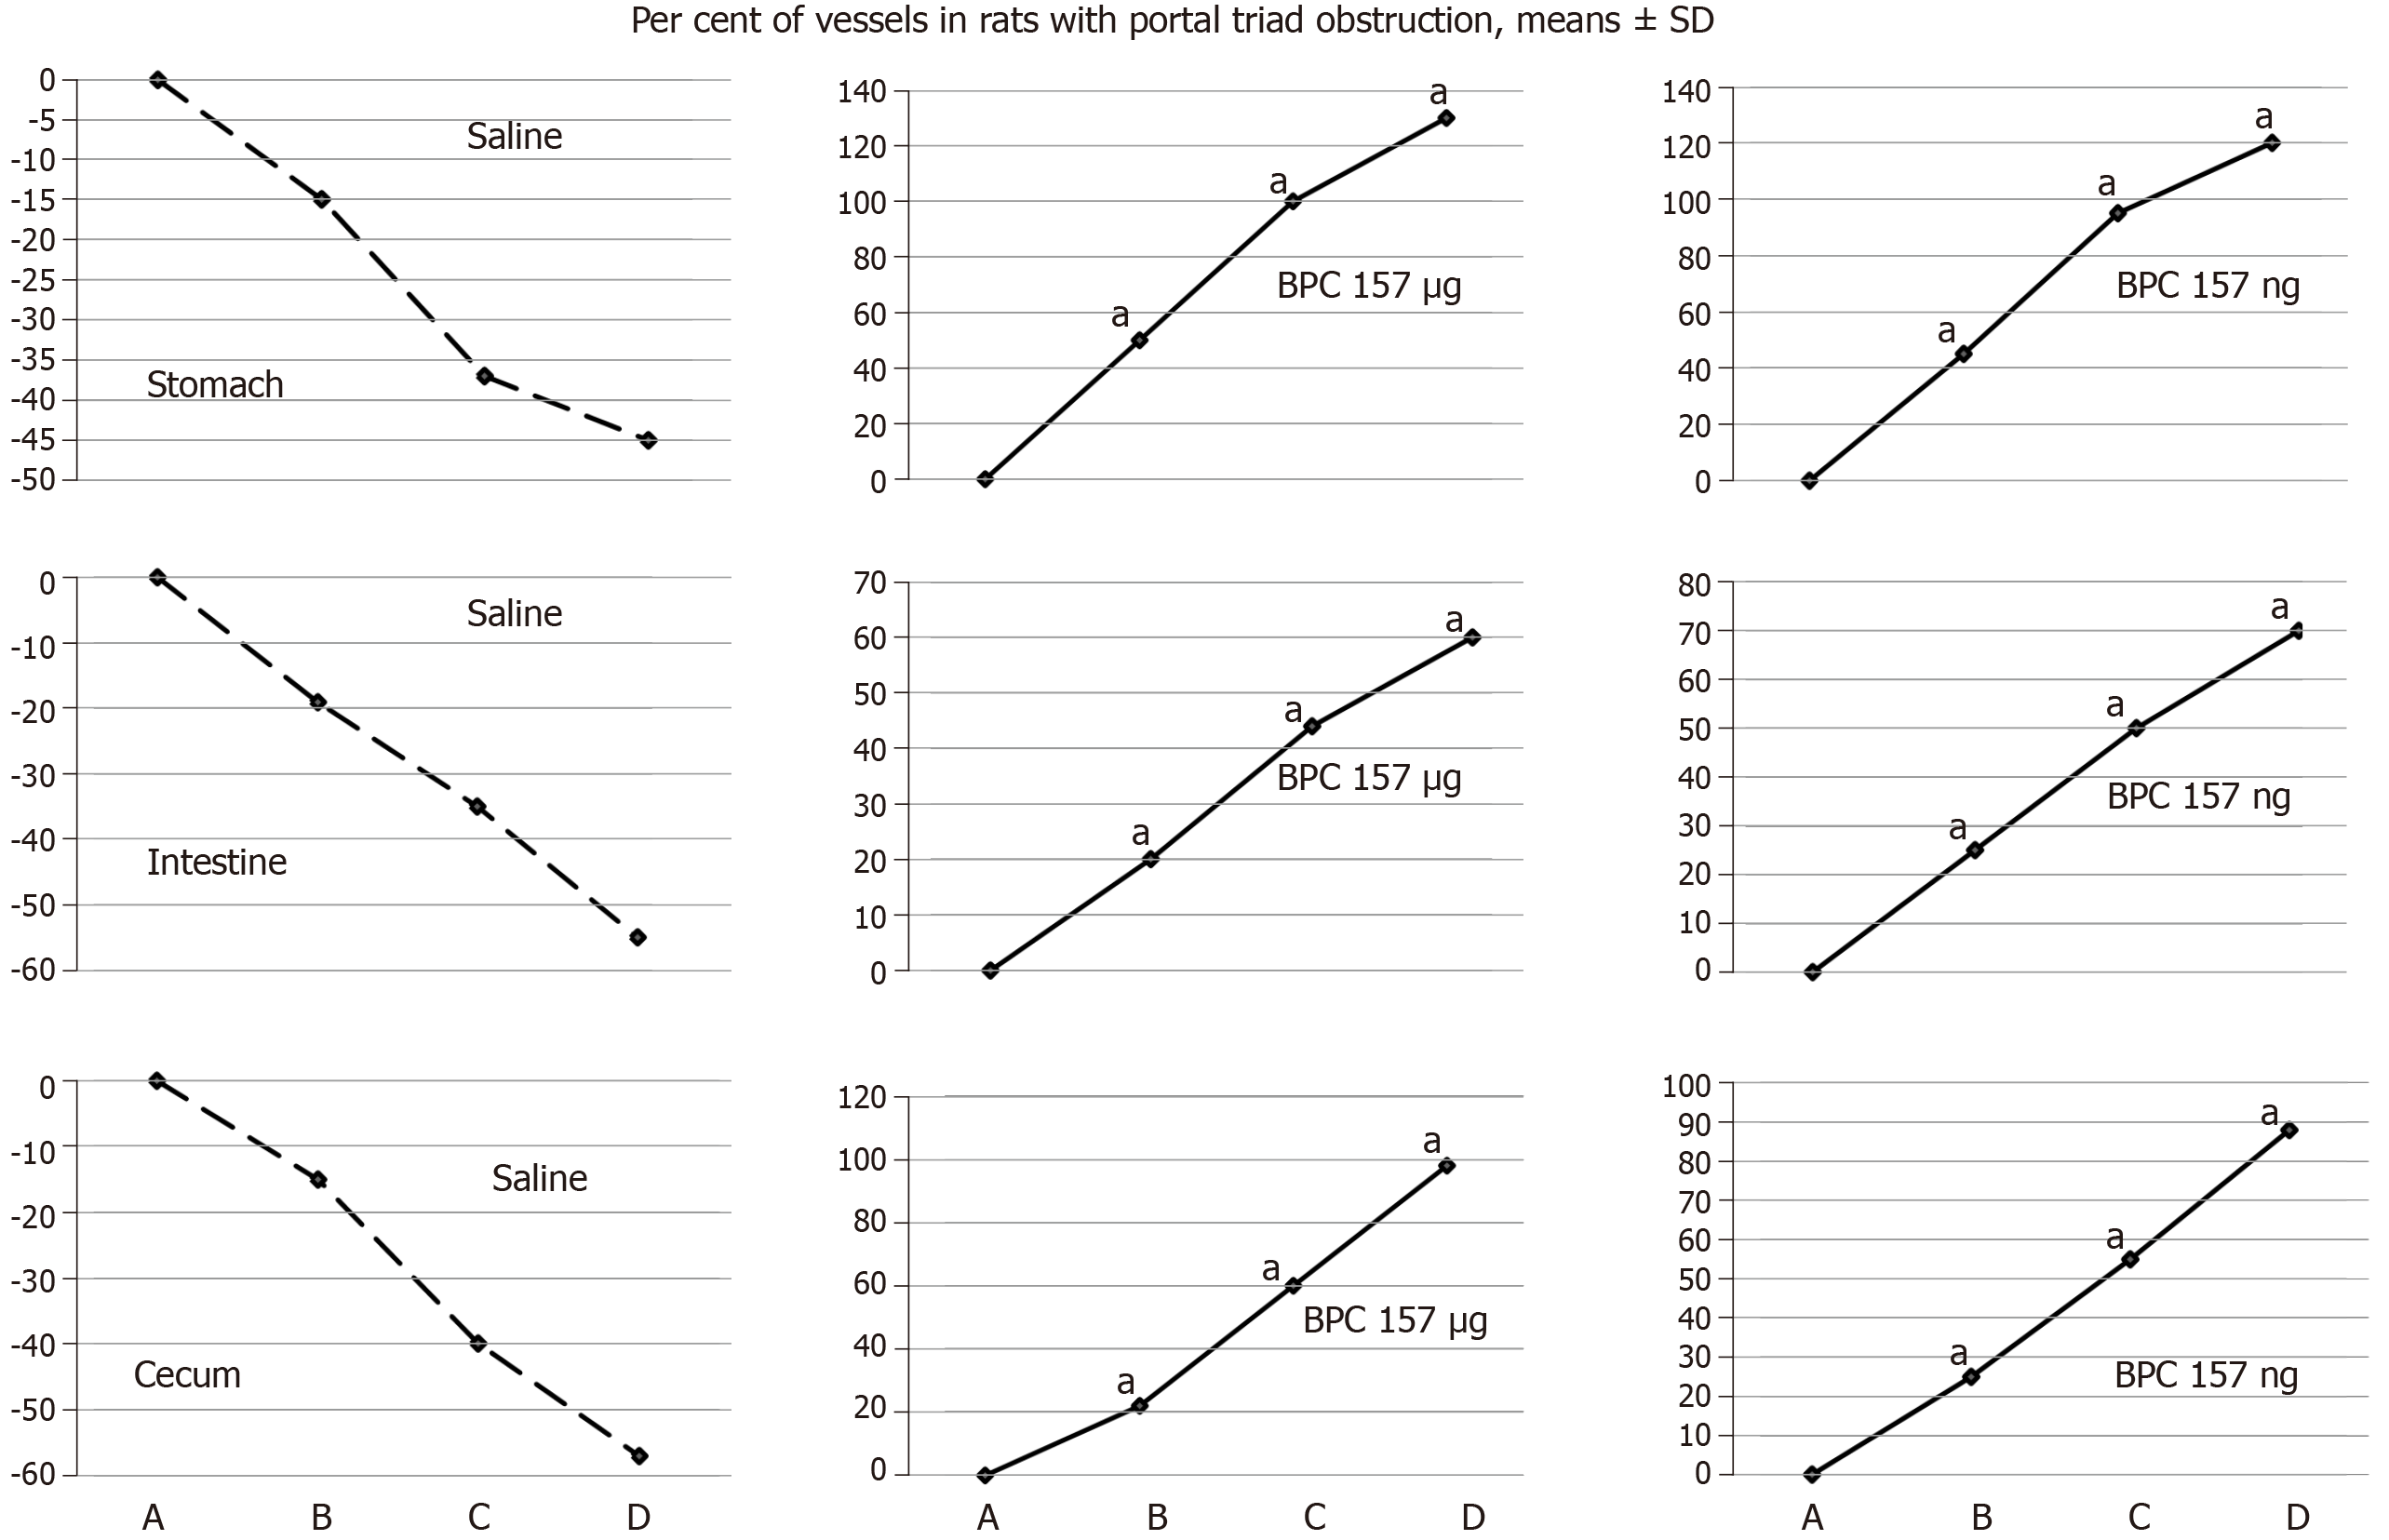
Figure 3 BPC 157 improves the vessels presentation during ischemia.
Vessels presentation (filled/appearance or cleared out/disappearance) assessed at the stomach, and between the arcade vessels on the ventral side at 1 cm long segment of duodenum, jejunum, ascending colon, and between 10 vessels from proximal to distal cecum throughout the following experiment [with regard to the point immediately before therapy (as 100%) (A)] at selected time points before (A); and (i) after therapy (B, C, D), in rats with portal triad obstruction (PTO) at 5 (B), 15 (C) and 30 (D) min PTO-ligation time; mean ± SD. The gross appearance of the tissue was recorded using a USB microscope camera. At 1 min post-injury (PTO-ligation time), medication BPC 157, 10 μg/kg (BPC 157 μg), 10 ng/kg (BPC 157 ng), saline (Saline) 5 mL/kg (1 mL/rat) as a bath. For clarity, the SD is not shown on the graph; the SD was never higher than 10% of the mean. Presentation at the dorsal side corresponds with that on the ventral side. aP < 0.05 vs saline.
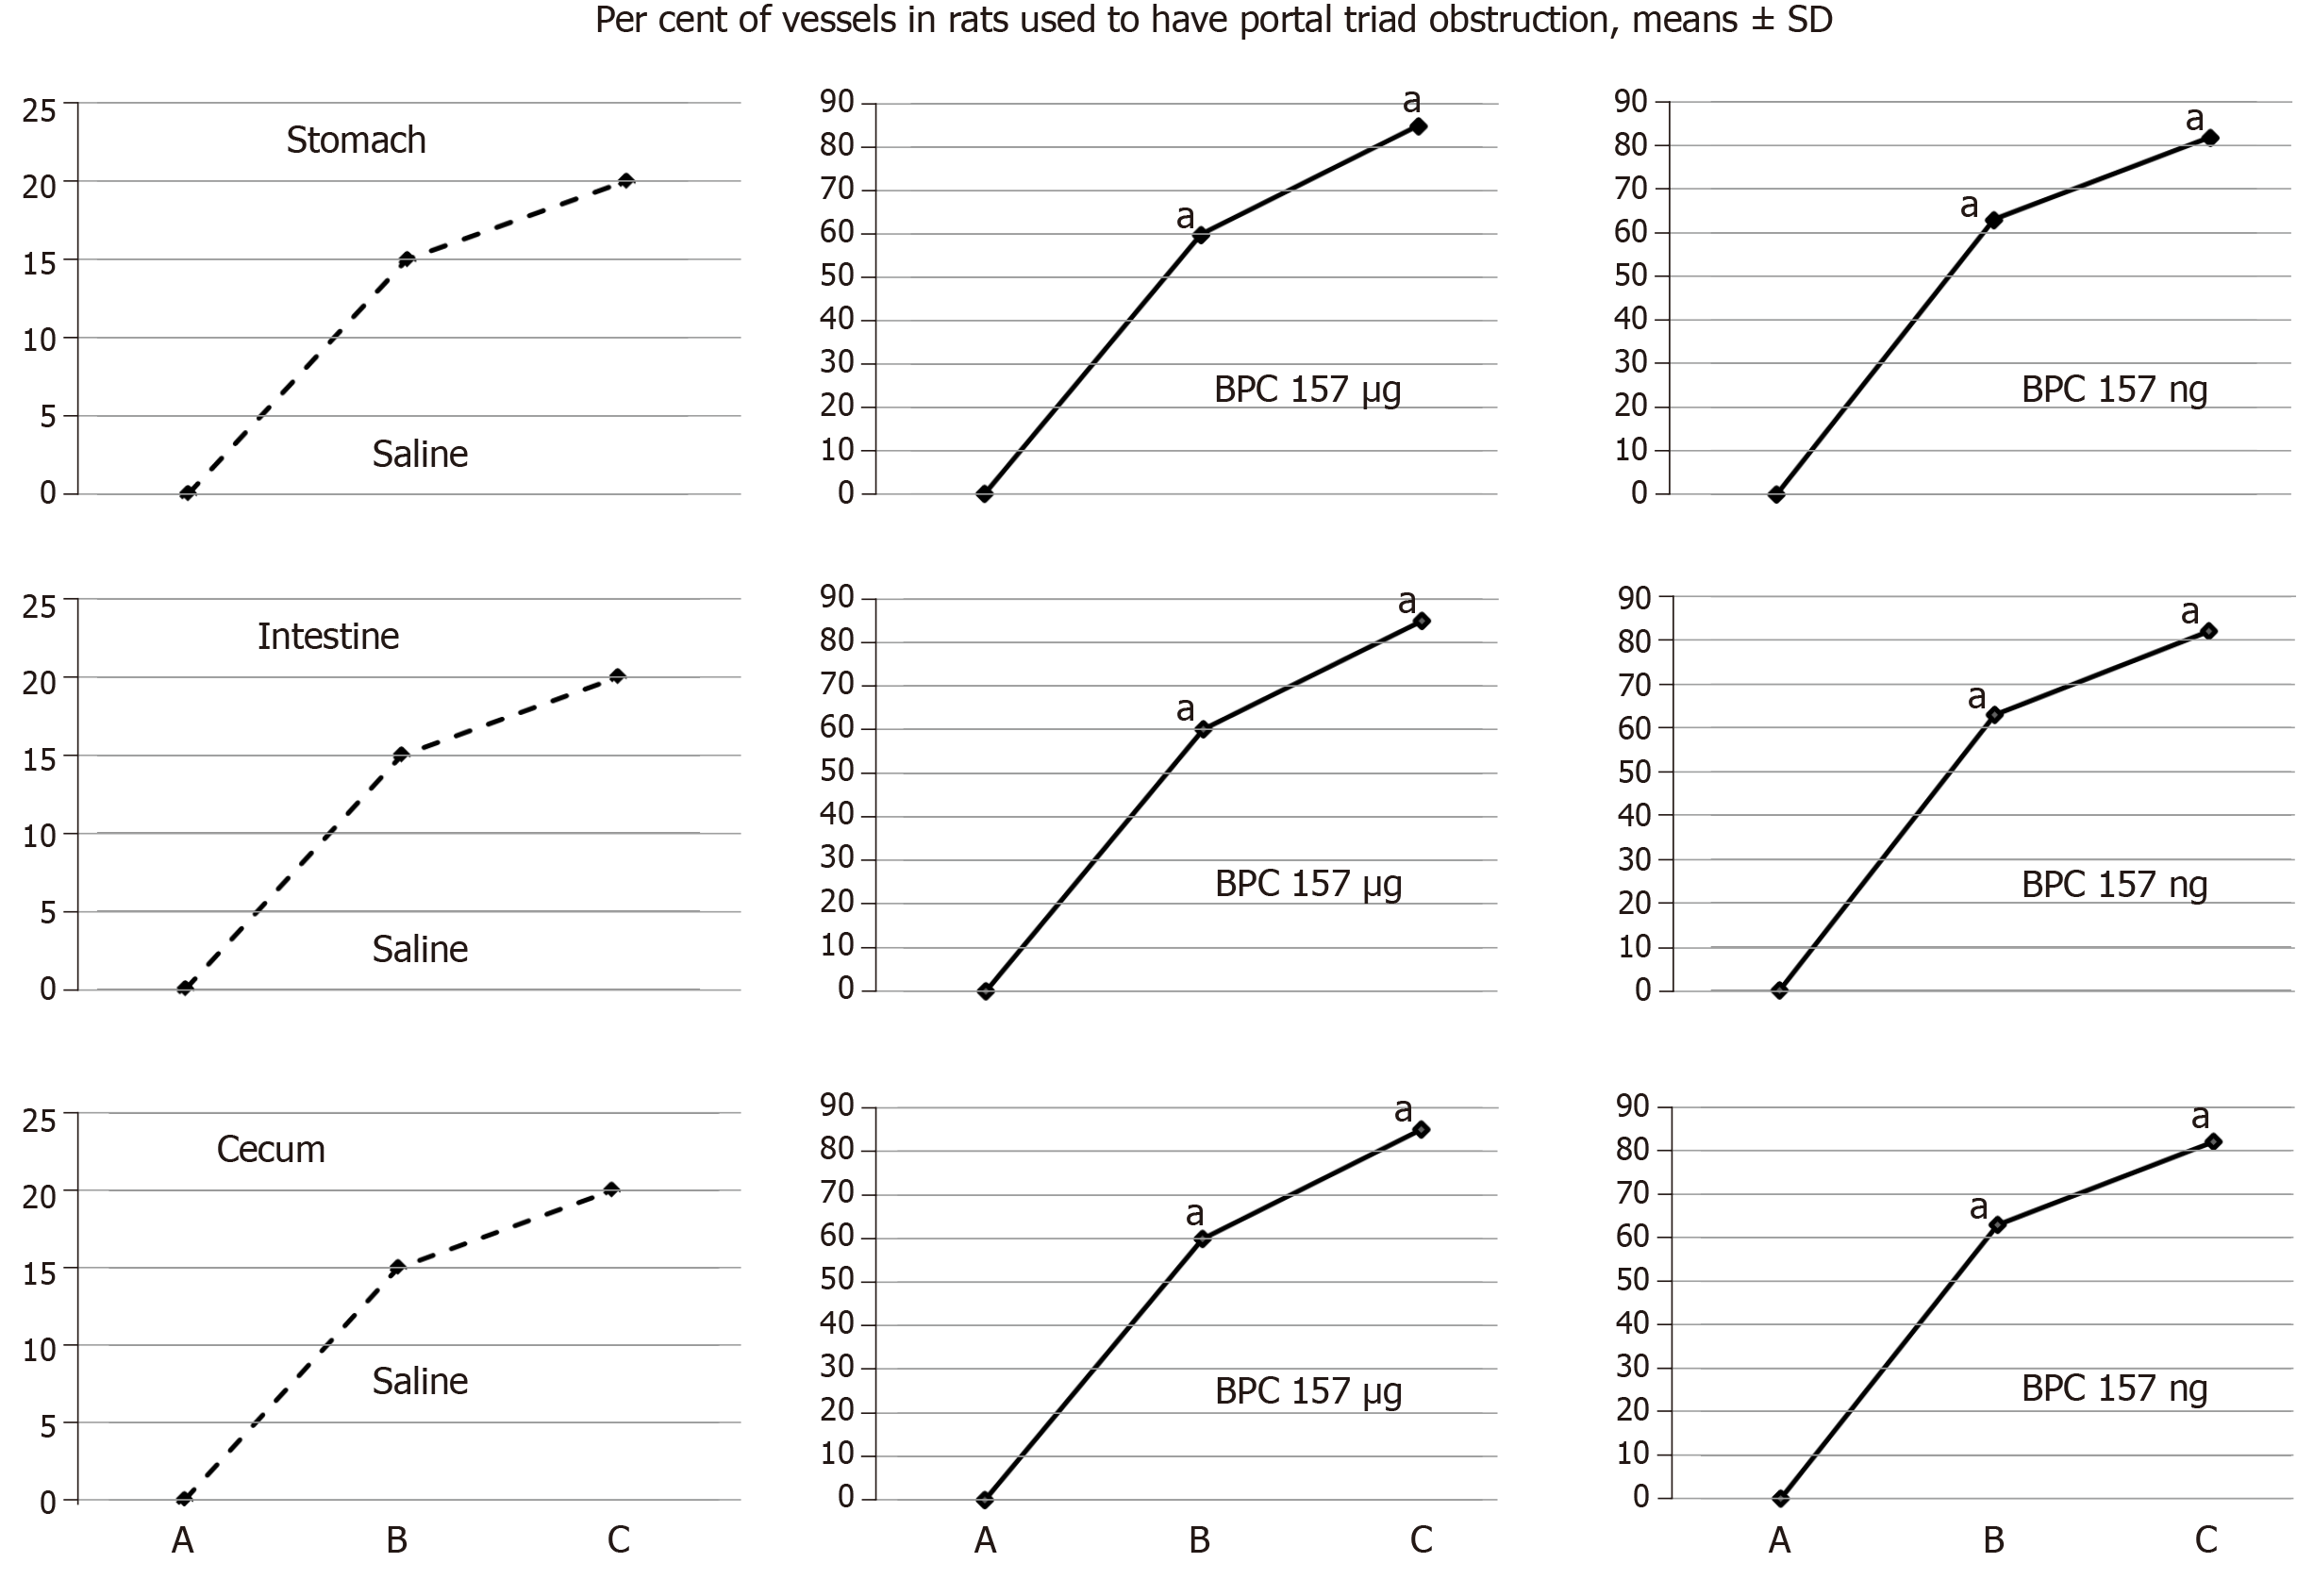
Figure 4 BPC 157 improves the vessels presentation during reperfusion.
Vessels presentation (filled/appearance or cleared out/disappearance) assessed at the stomach, and between the arcade vessels on the ventral side at 1 cm long segment of duodenum, jejunum, ascending colon, and between 10 vessels from proximal to distal cecum throughout the following experiment [with regard to the point immediately before therapy (as 100%) (A)] at selected time points before (A); and after therapy (B, C), in rats used to have portal triad obstruction (PTO) at 15 min (B) and 24 h (C) post-PTO-ligation time; mean ± SD. The gross appearance of the tissue was recorded using a USB microscope camera. At at 1 min reperfusion-time (post-PTO-ligation time), medication BPC 157, 10 μg/kg (BPC 157 μg), 10 ng/kg (BPC 157 ng), saline (Saline) 5 mL/kg (1 mL/rat) as a bath. For clarity, the SD is not shown on the graph; the SD was never higher than 10% of the mean. Presentation at the dorsal side corresponds with that on the ventral side. aP < 0.05 vs saline.
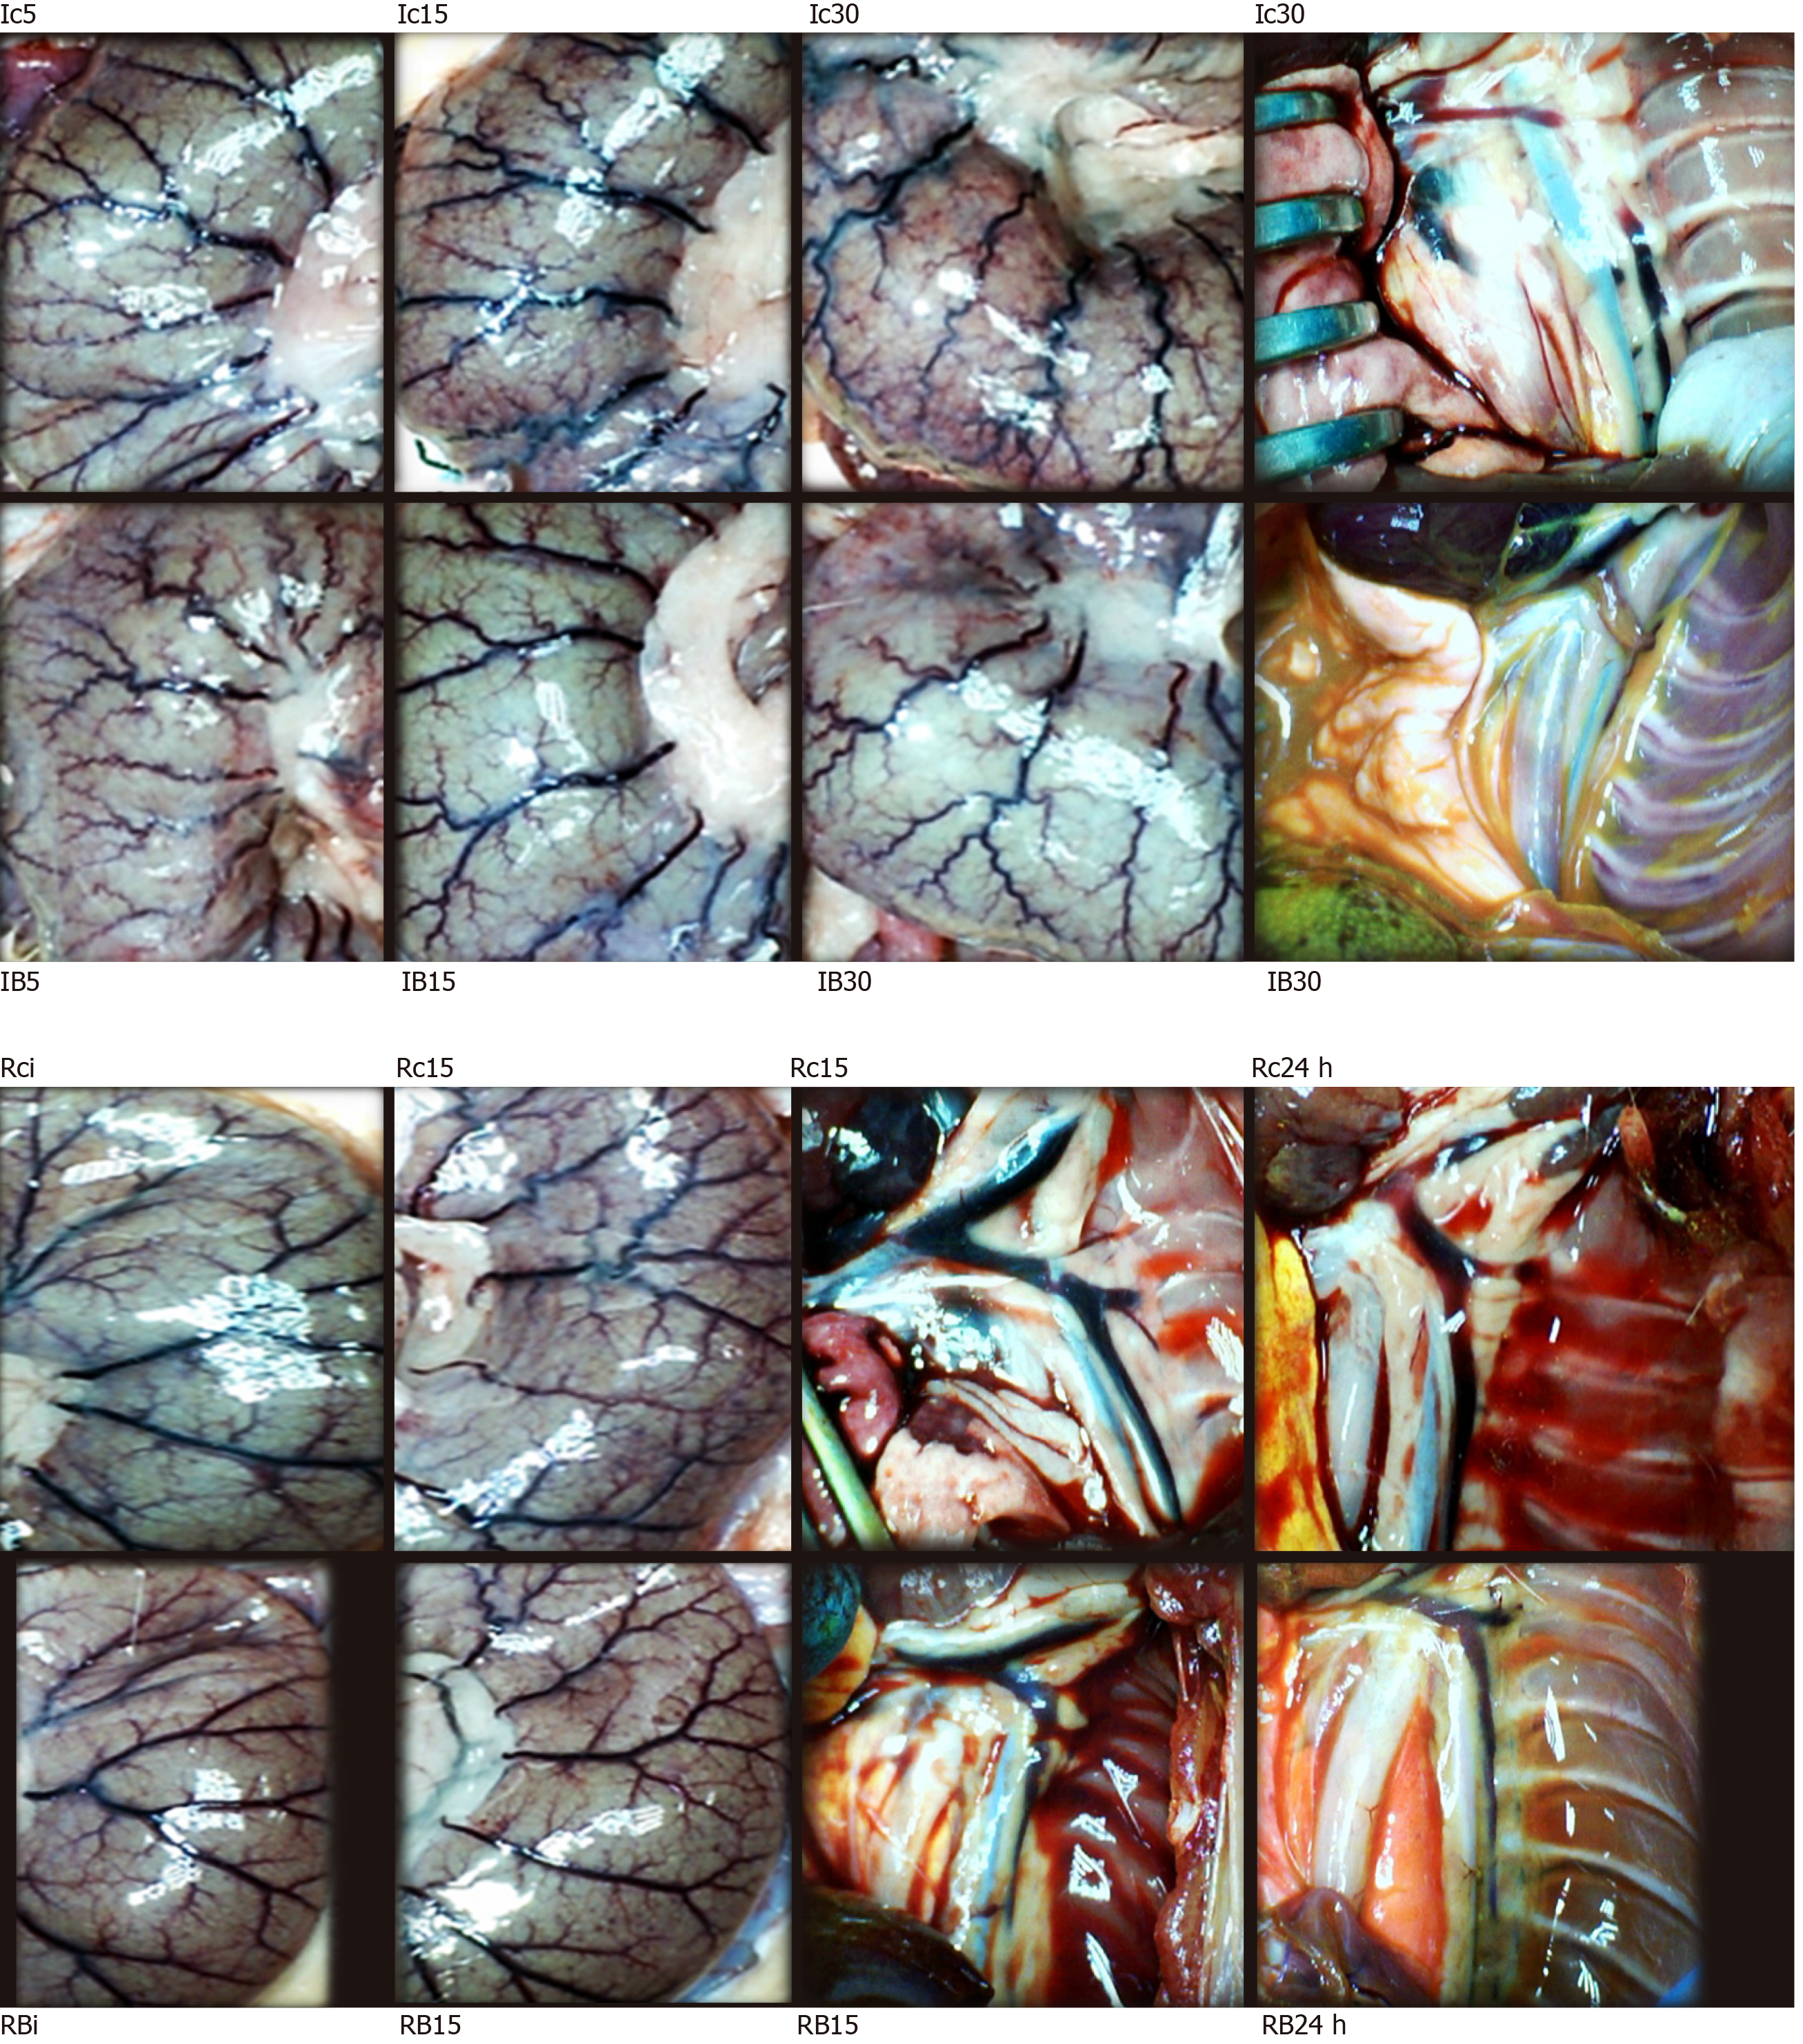
Figure 5 BPC 157 effect on cecal vessels (left, Ic5, Ic15, Ic30, Rci, Rc15, IB5, IB15, IB30, RBi, RB15) and azygos veins [right, Ic30, Rc15, Rc24 h, IB30, RB15, RB24 h (white letters)] presentation.
Presentation of cecal vessels. Controls with veins congestion and tortuosity at 5 min (Ic5), 15 min (Ic15) and 30 min (Ic30) portal triad obstruction (PTO)-ligation time, and in reperfusion, immediately (Rci) and at 15 min reperfusion time (Rc15); markedly attenuated veins congestion and tortuosity, increased small vessel branching, “honeycomb” smaller vessel network, in BPC 157 rats 5 min (IB5), 15 min (IB15) and 30 min (IB30) PTO-ligation time, and in reperfusion, immediately (RBi) and at 15 min reperfusion-time (RB15) (Figures 3 and 4). Presentation of azygos veins (yellow ink contrast in inferior caval vein) controls with congestion and tortuosity at 30 min PTO-ligation time (Ic30, scored 2/2/2 Min/Med/Max likely reflecting right heart failure), at 15 min (Rc15, scored 3/3/3) and 24 h (Rc24 h, scored 3/3/3) in reperfusion time, likely reflecting persisting right heart failure. Marked attenuation occurs in BPC 157 rats at 30 min PTO-ligation time [IB30, scored 1/1/1 (µg), 1/1/1 (ng), aP < 0.05, at least vs control] and in reperfusion, at 15 min (RB15, scored 1/1/1 (µg), 1/1/1 (ng), aP < 0.05, at least vs control) and at 24 h [RB 24 h, scored 1/1/1 (µg), 1/1/1 (ng), aP < 0.05, at least vs control] reperfusion-time.
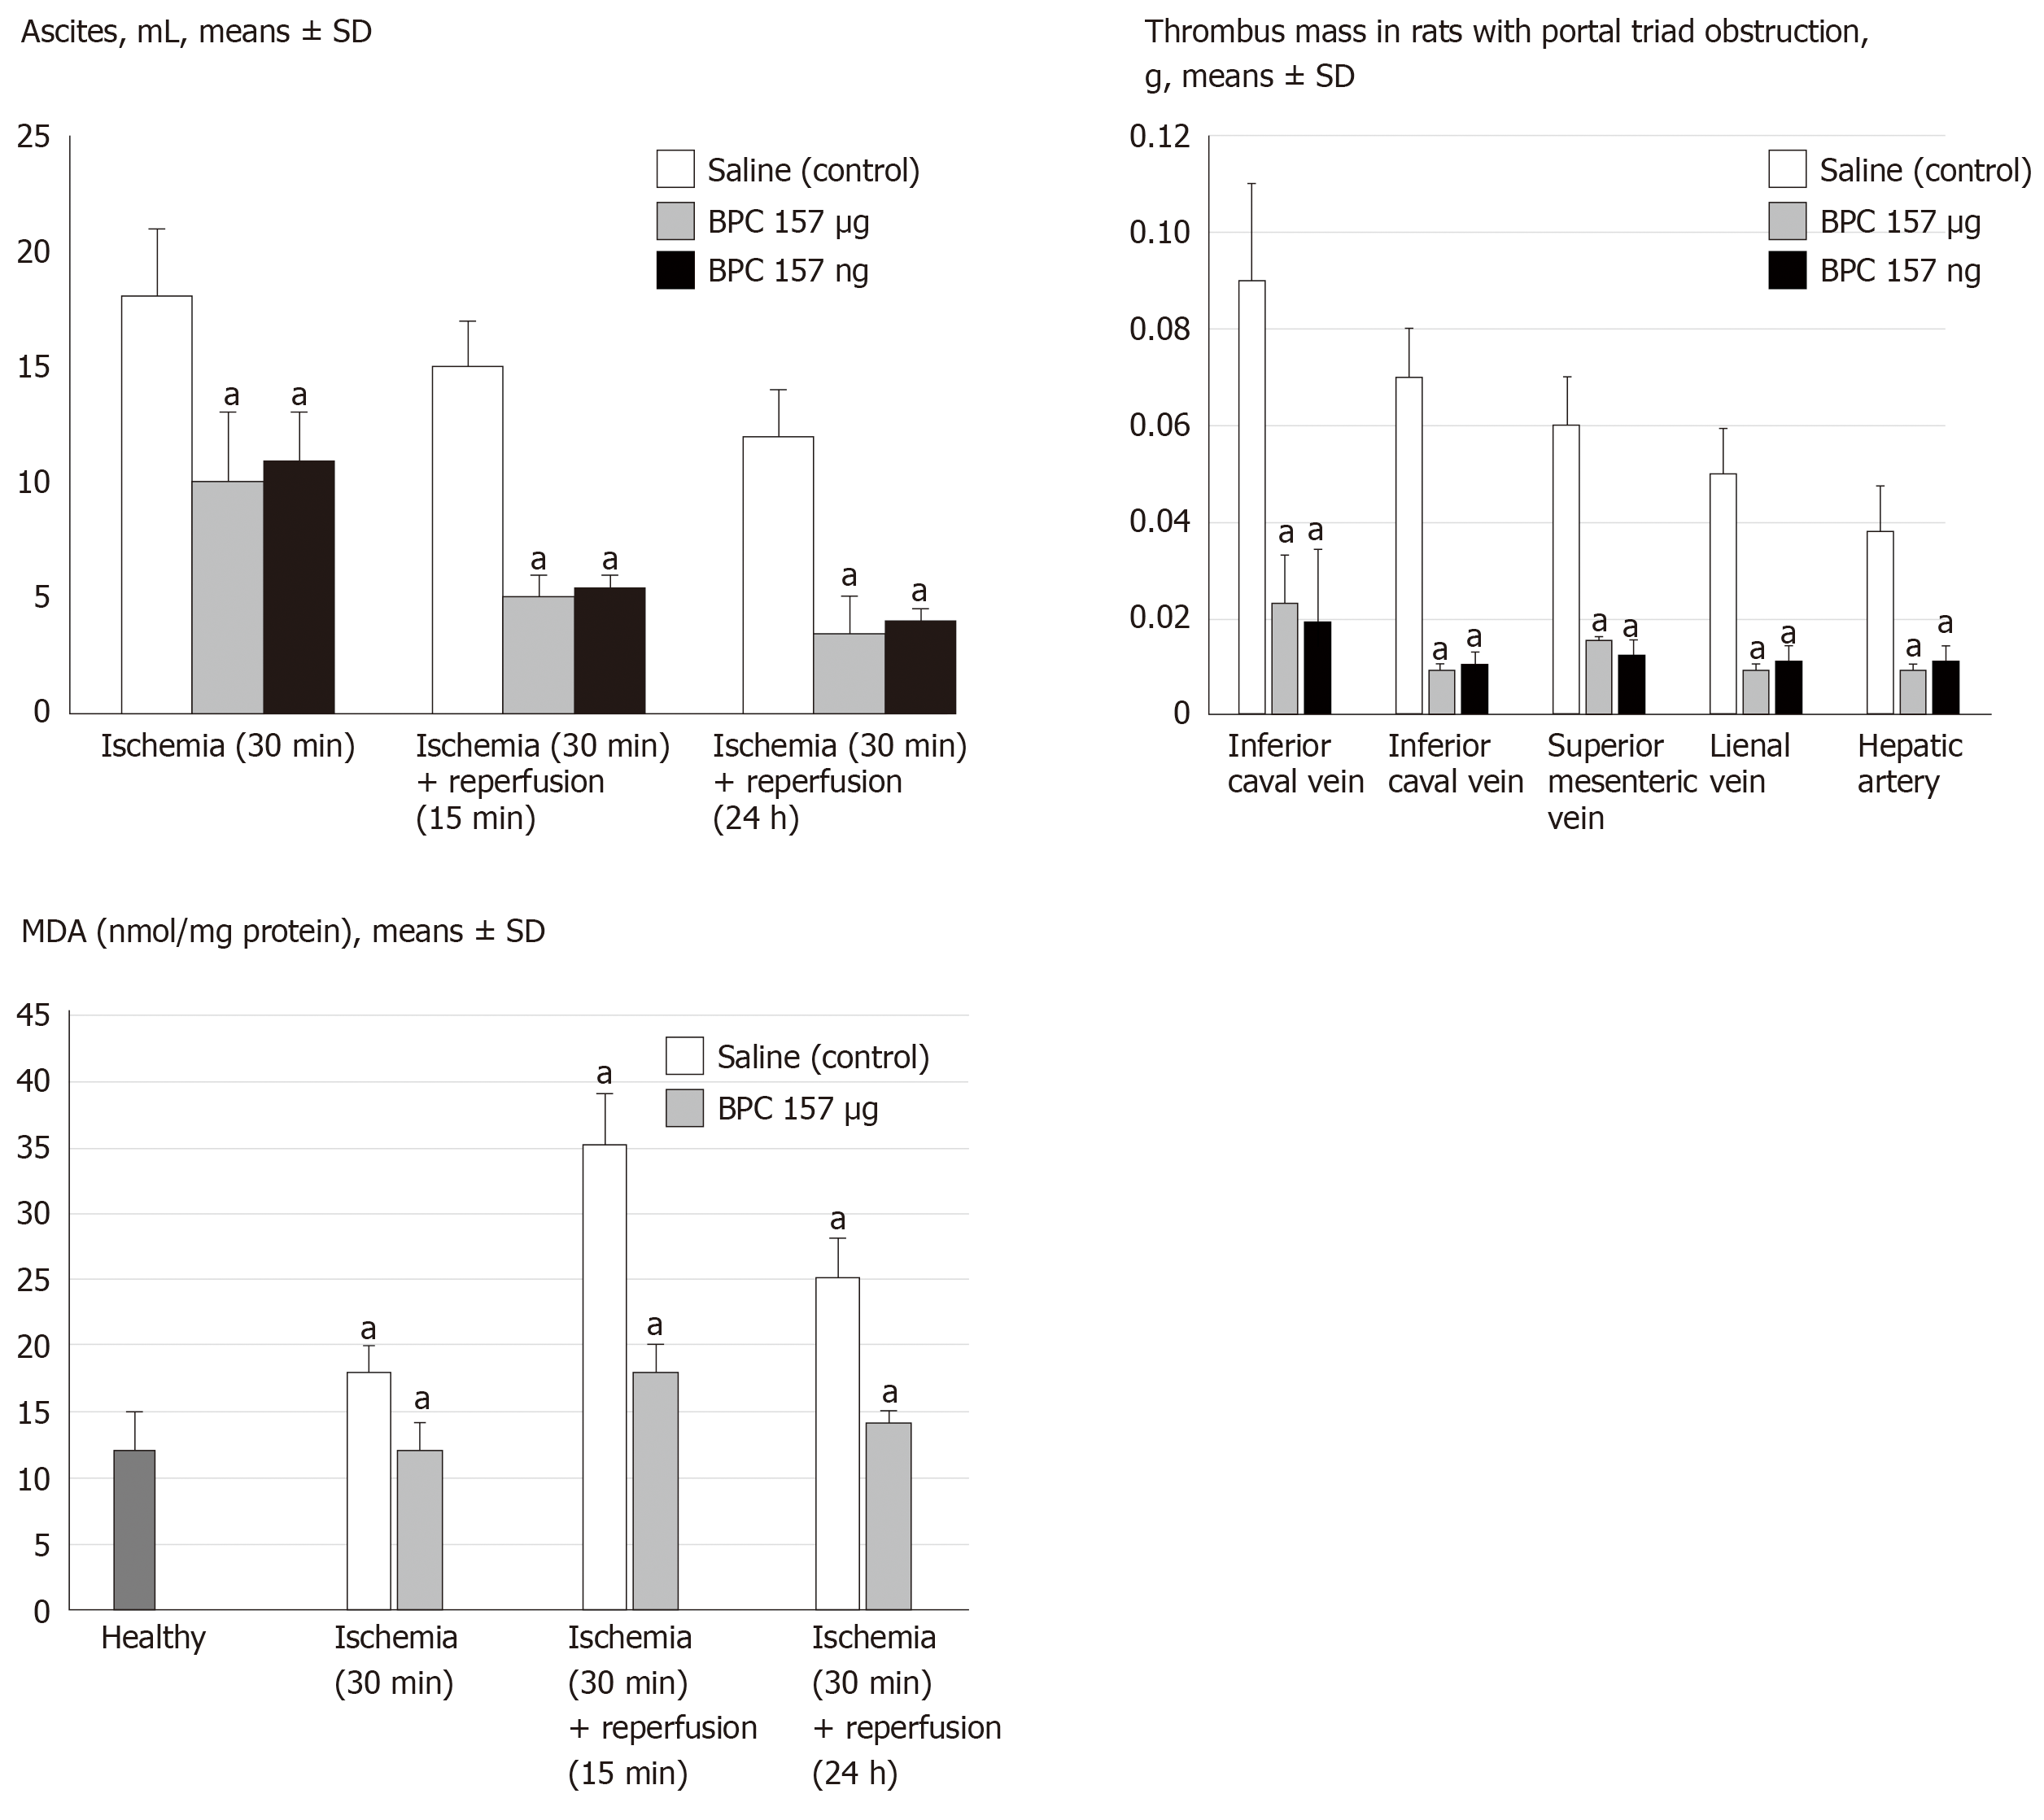
Figure 6 BPC 157 counteracts ascites (mL) (upper), increased MDA-level (nmol/mg protein) in liver (low), in ischemia and reperfusion, and thrombus presentation (thrombus mass, g) in veins [inferior caval vein, portal vein, superior mesenteric vein, lienal vein] and artery (hepatic artery) (middle) during portal triad obstruction.
Assessment at 30 min portal triad obstruction (PTO)-ligation time, and in reperfusion, at 15 min and 24 h reperfusion time, mean ± SD. At 1 min post-injury (PTO-ligation time) (ischemia), or at 1 min reperfusion-time (post-PTO-ligation time) (reperfusion), medication (BPC 157, 10 μg/kg, 10 ng/kg, saline 5 mL/kg (1 mL/rat)) as a bath. aP < 0.05 vs saline. aP < 0.05, at least vs healthy liver.
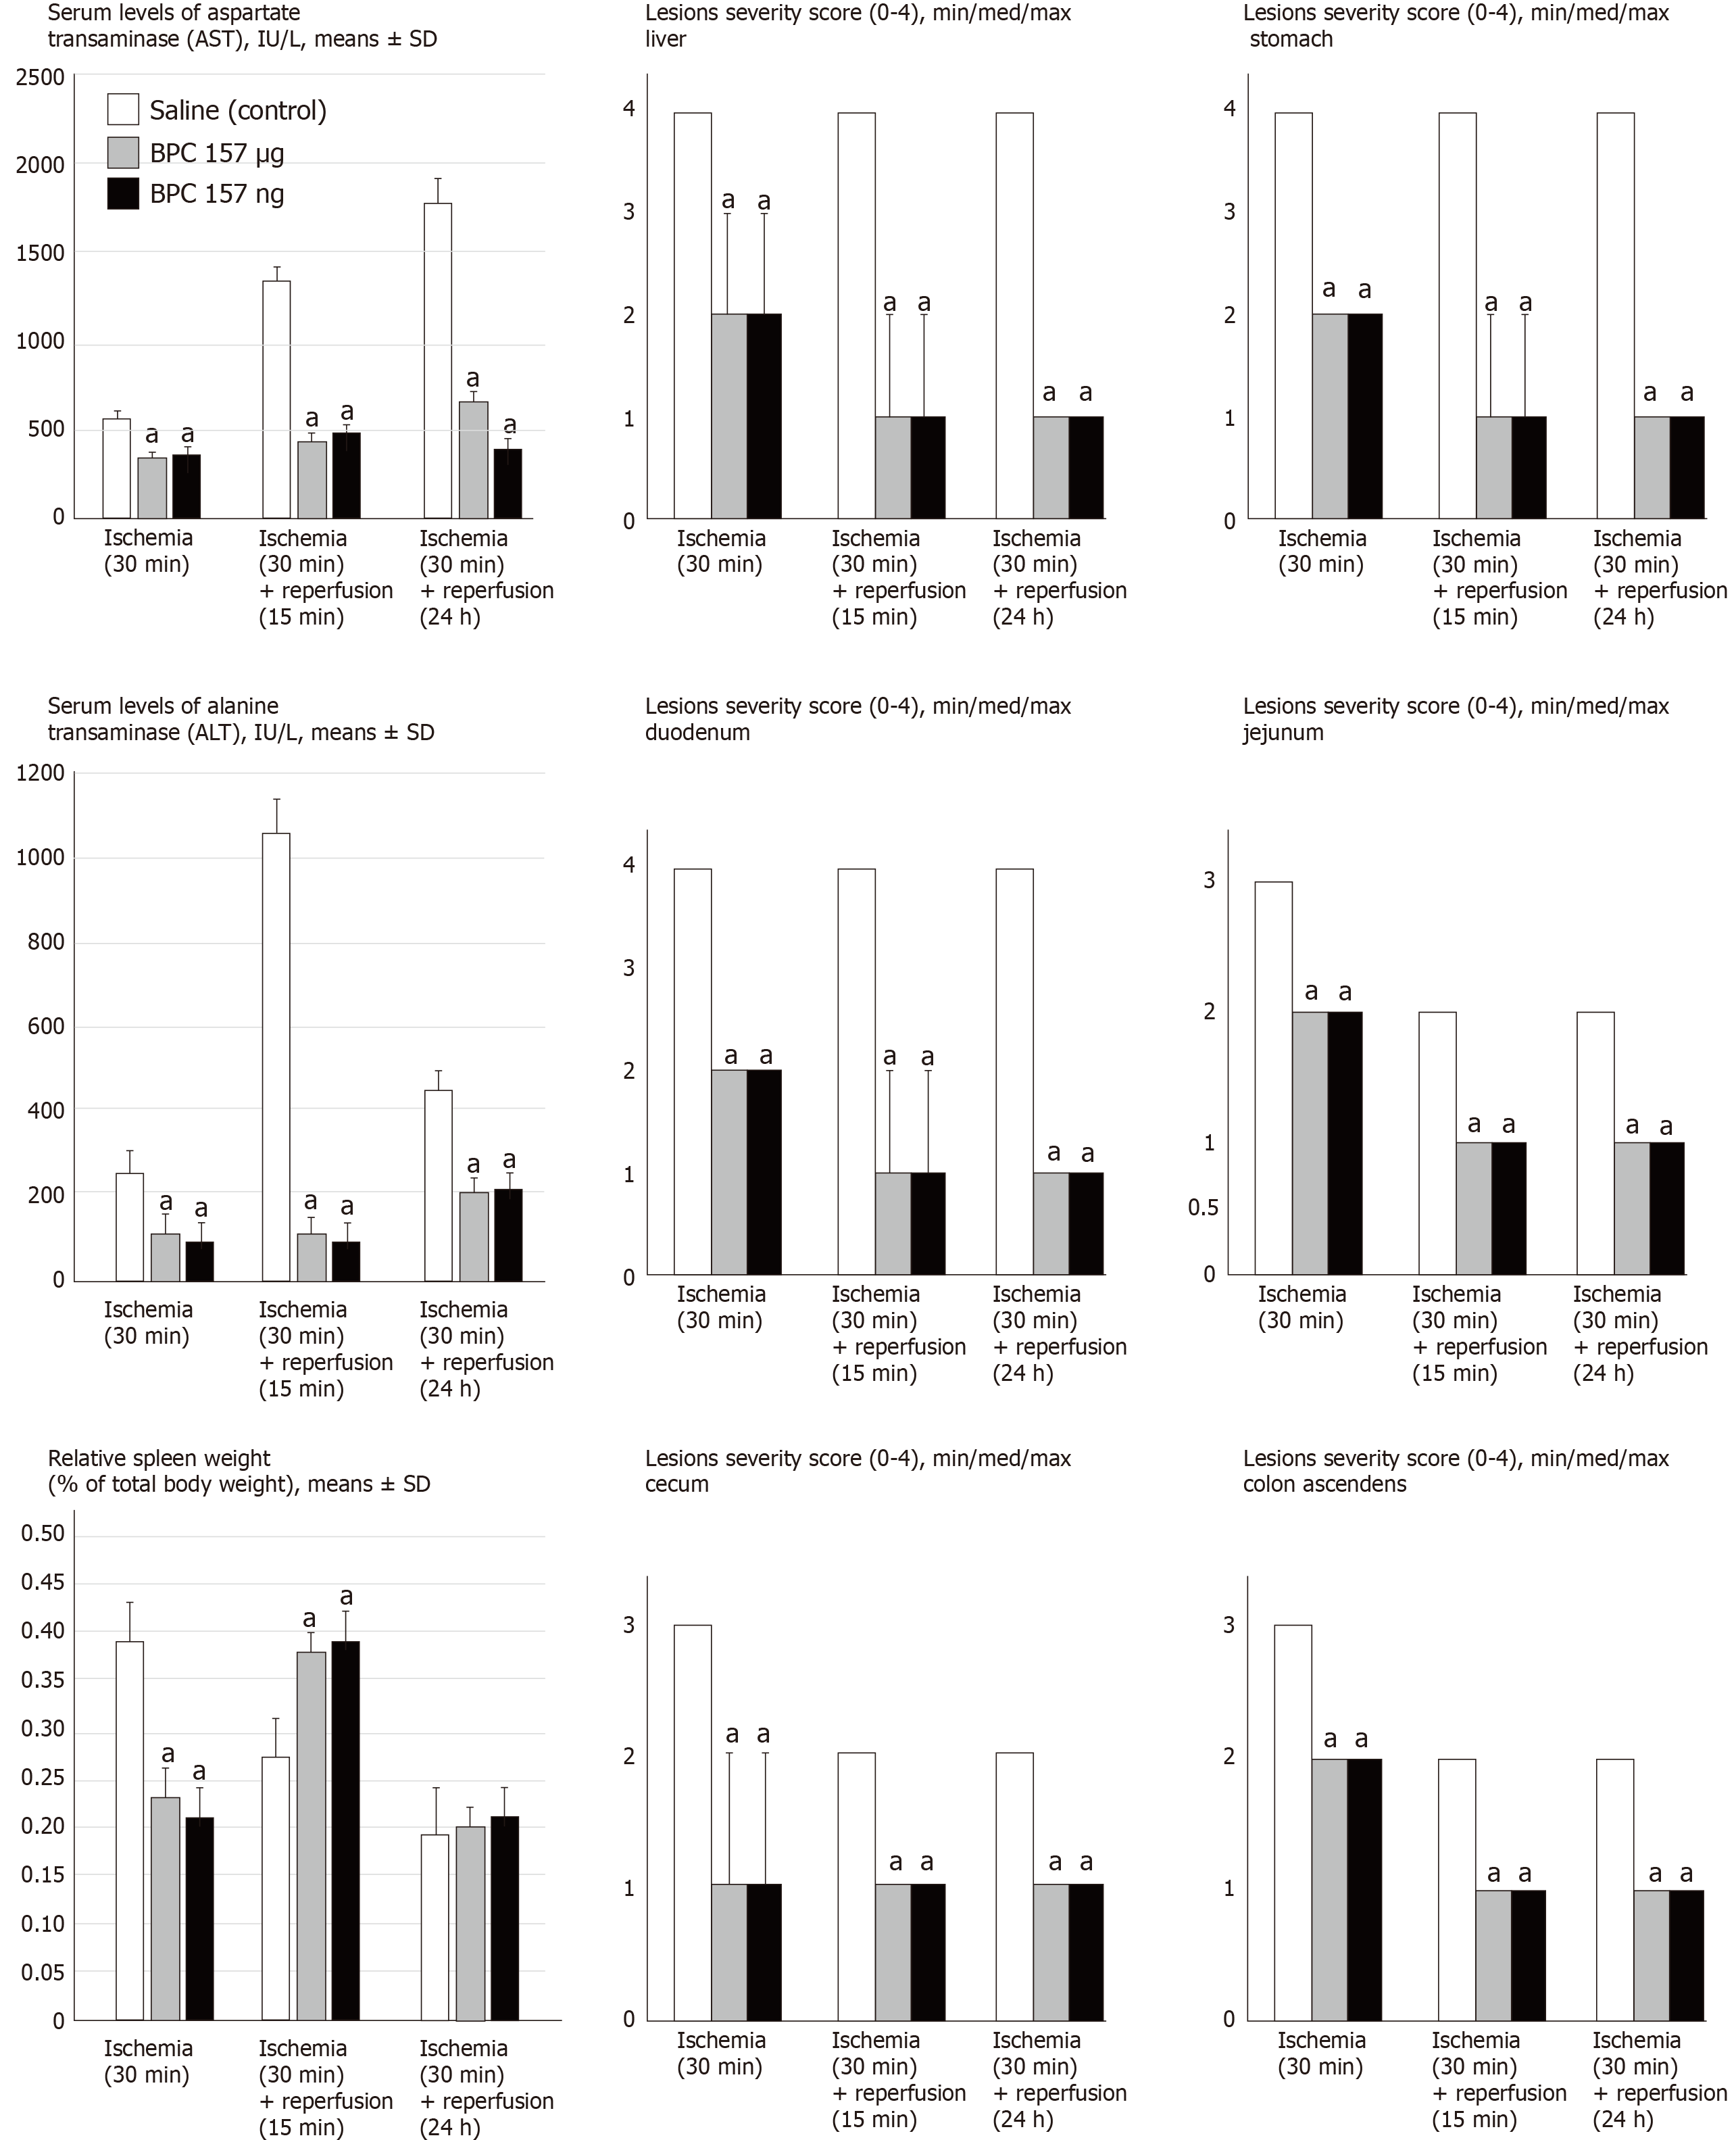
Figure 7 BPC 157 counteracts increased serum enzymes values (IU/L, mean ± SD), gross lesions severity (liver, stomach, duodenum, jejunum, cecum, ascending colon) scored 0-4, Min/Med/max, splenomegaly (relative spleen weight as % of total body weight, mean ± SD) in ischemia, (splenomegaly appears in early reperfusion).
Assessment at 30 min portal triad obstruction (PTO)-ligation time, and in reperfusion, at 15 min and 24 h reperfusion time. At 1 min post-injury (PTO-ligation time) (ischemia), or at 1 min reperfusion-time (post-PTO-ligation time) (reperfusion), medication (BPC 157, 10 μg/kg, 10 ng/kg, saline 5 mL/kg (1 mL/rat)) as a bath. aP < 0.05 vs saline.
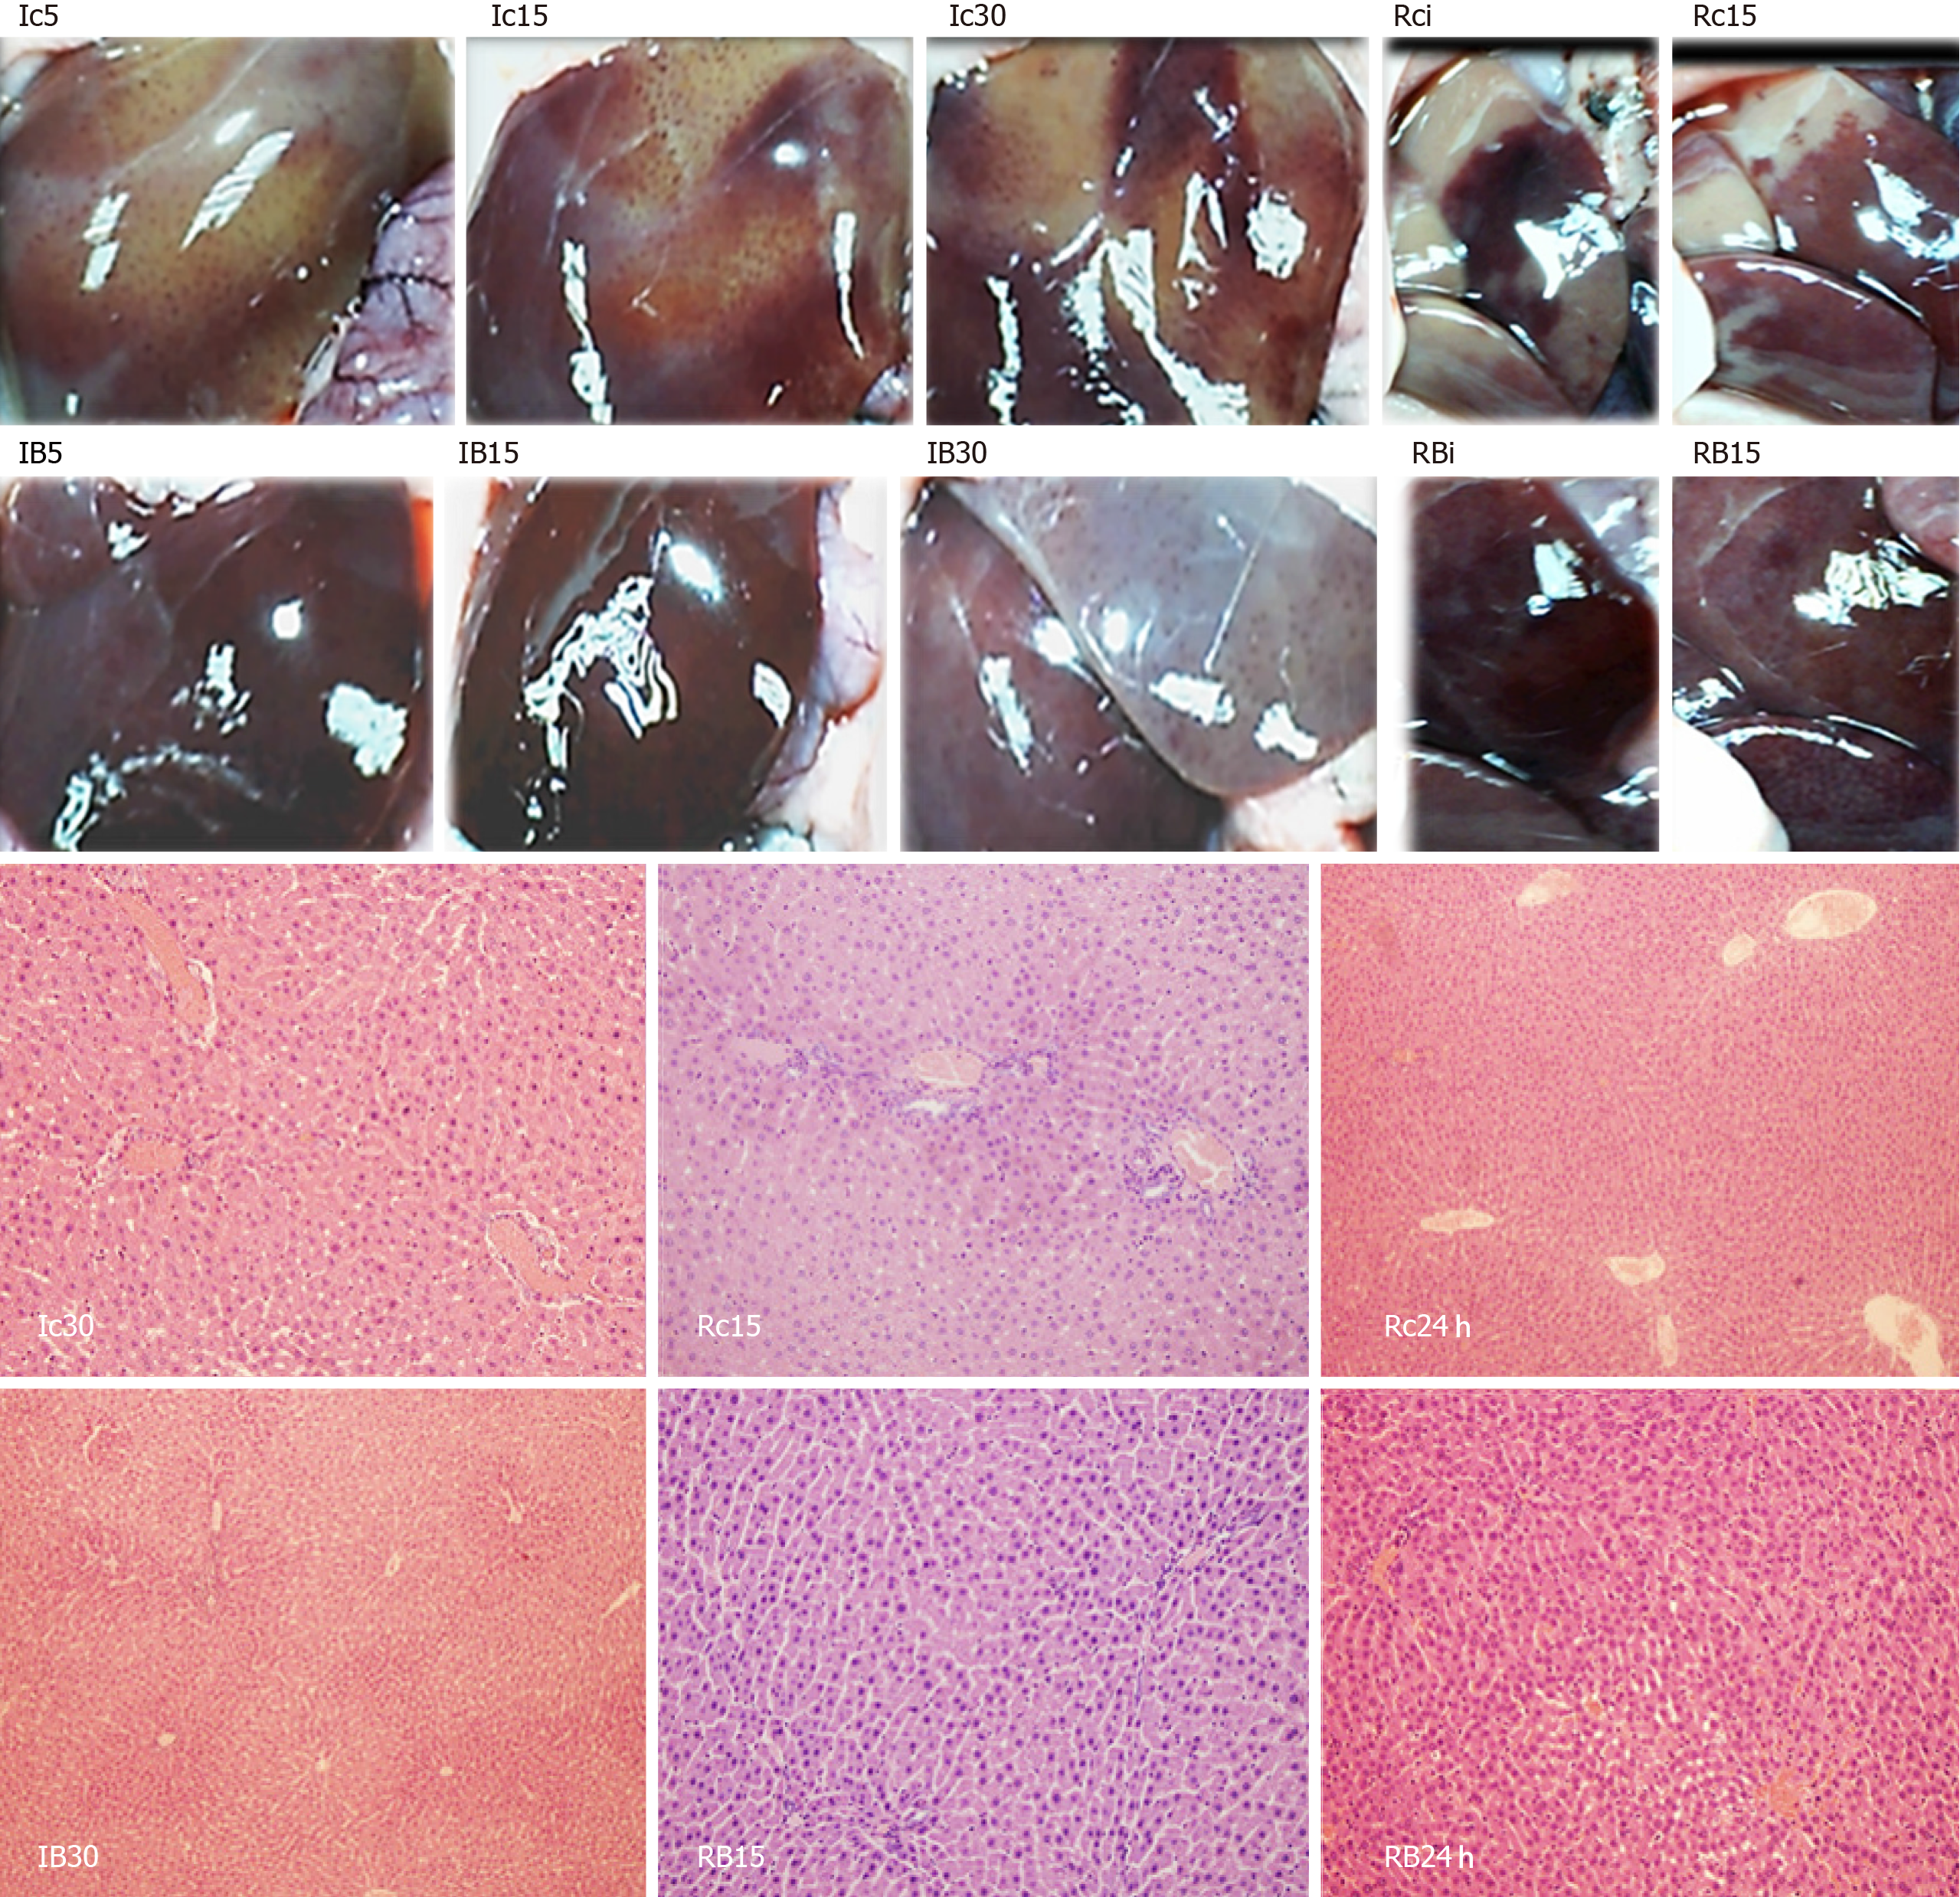
Figure 8 BPC 157 effect on liver gross presentation (left, Ic5, Ic15, Ic30, Rci, Rc15, IB5, IB15, IB30, RBi, RB15) and liver microscopy [right, Ic30, Rc15, Rc24 h, IB30, RB15, RB24 h (white letters)] presentation.
Liver gross presentation. Yellowish liver presentation in control rats at 5 min (Ic5), 15 min (Ic15) and 30 min (Ic30) portal triad obstruction (PTO)-ligation time and in reperfusion with pale areas, immediately after medication (Rci) and at 15 min reperfusion time (Rc15); BPC 157 application markedly attenuated these changes, during PTO (IB5, IB15, IB30) as well as in reperfusion time (RBi, RB15) (see Figure 7). Liver microscopy (HE staining, × 10). Controls. Substantial congestion of central vein as well as branches of terminal portal venules present at the end of 30 min PTO ischemia period (Ic30). With reperfusion, as seen at 15 min of reperfusion (Rc15) as well as at 24 h of reperfusion, substantial congestion of central vein as well as branches of terminal portal venules remained (Rc24 h). BPC 157. Substantial congestion of central vein as well as branches of terminal portal venules counteracted at the end of 30 min PTO ischemia period (IB30). With reperfusion, as seen at 15 min of reperfusion (RB15) as well as at 24 h of reperfusion (RB24 h), the reversal of substantial congestion of central vein as well as branches of terminal portal venules.
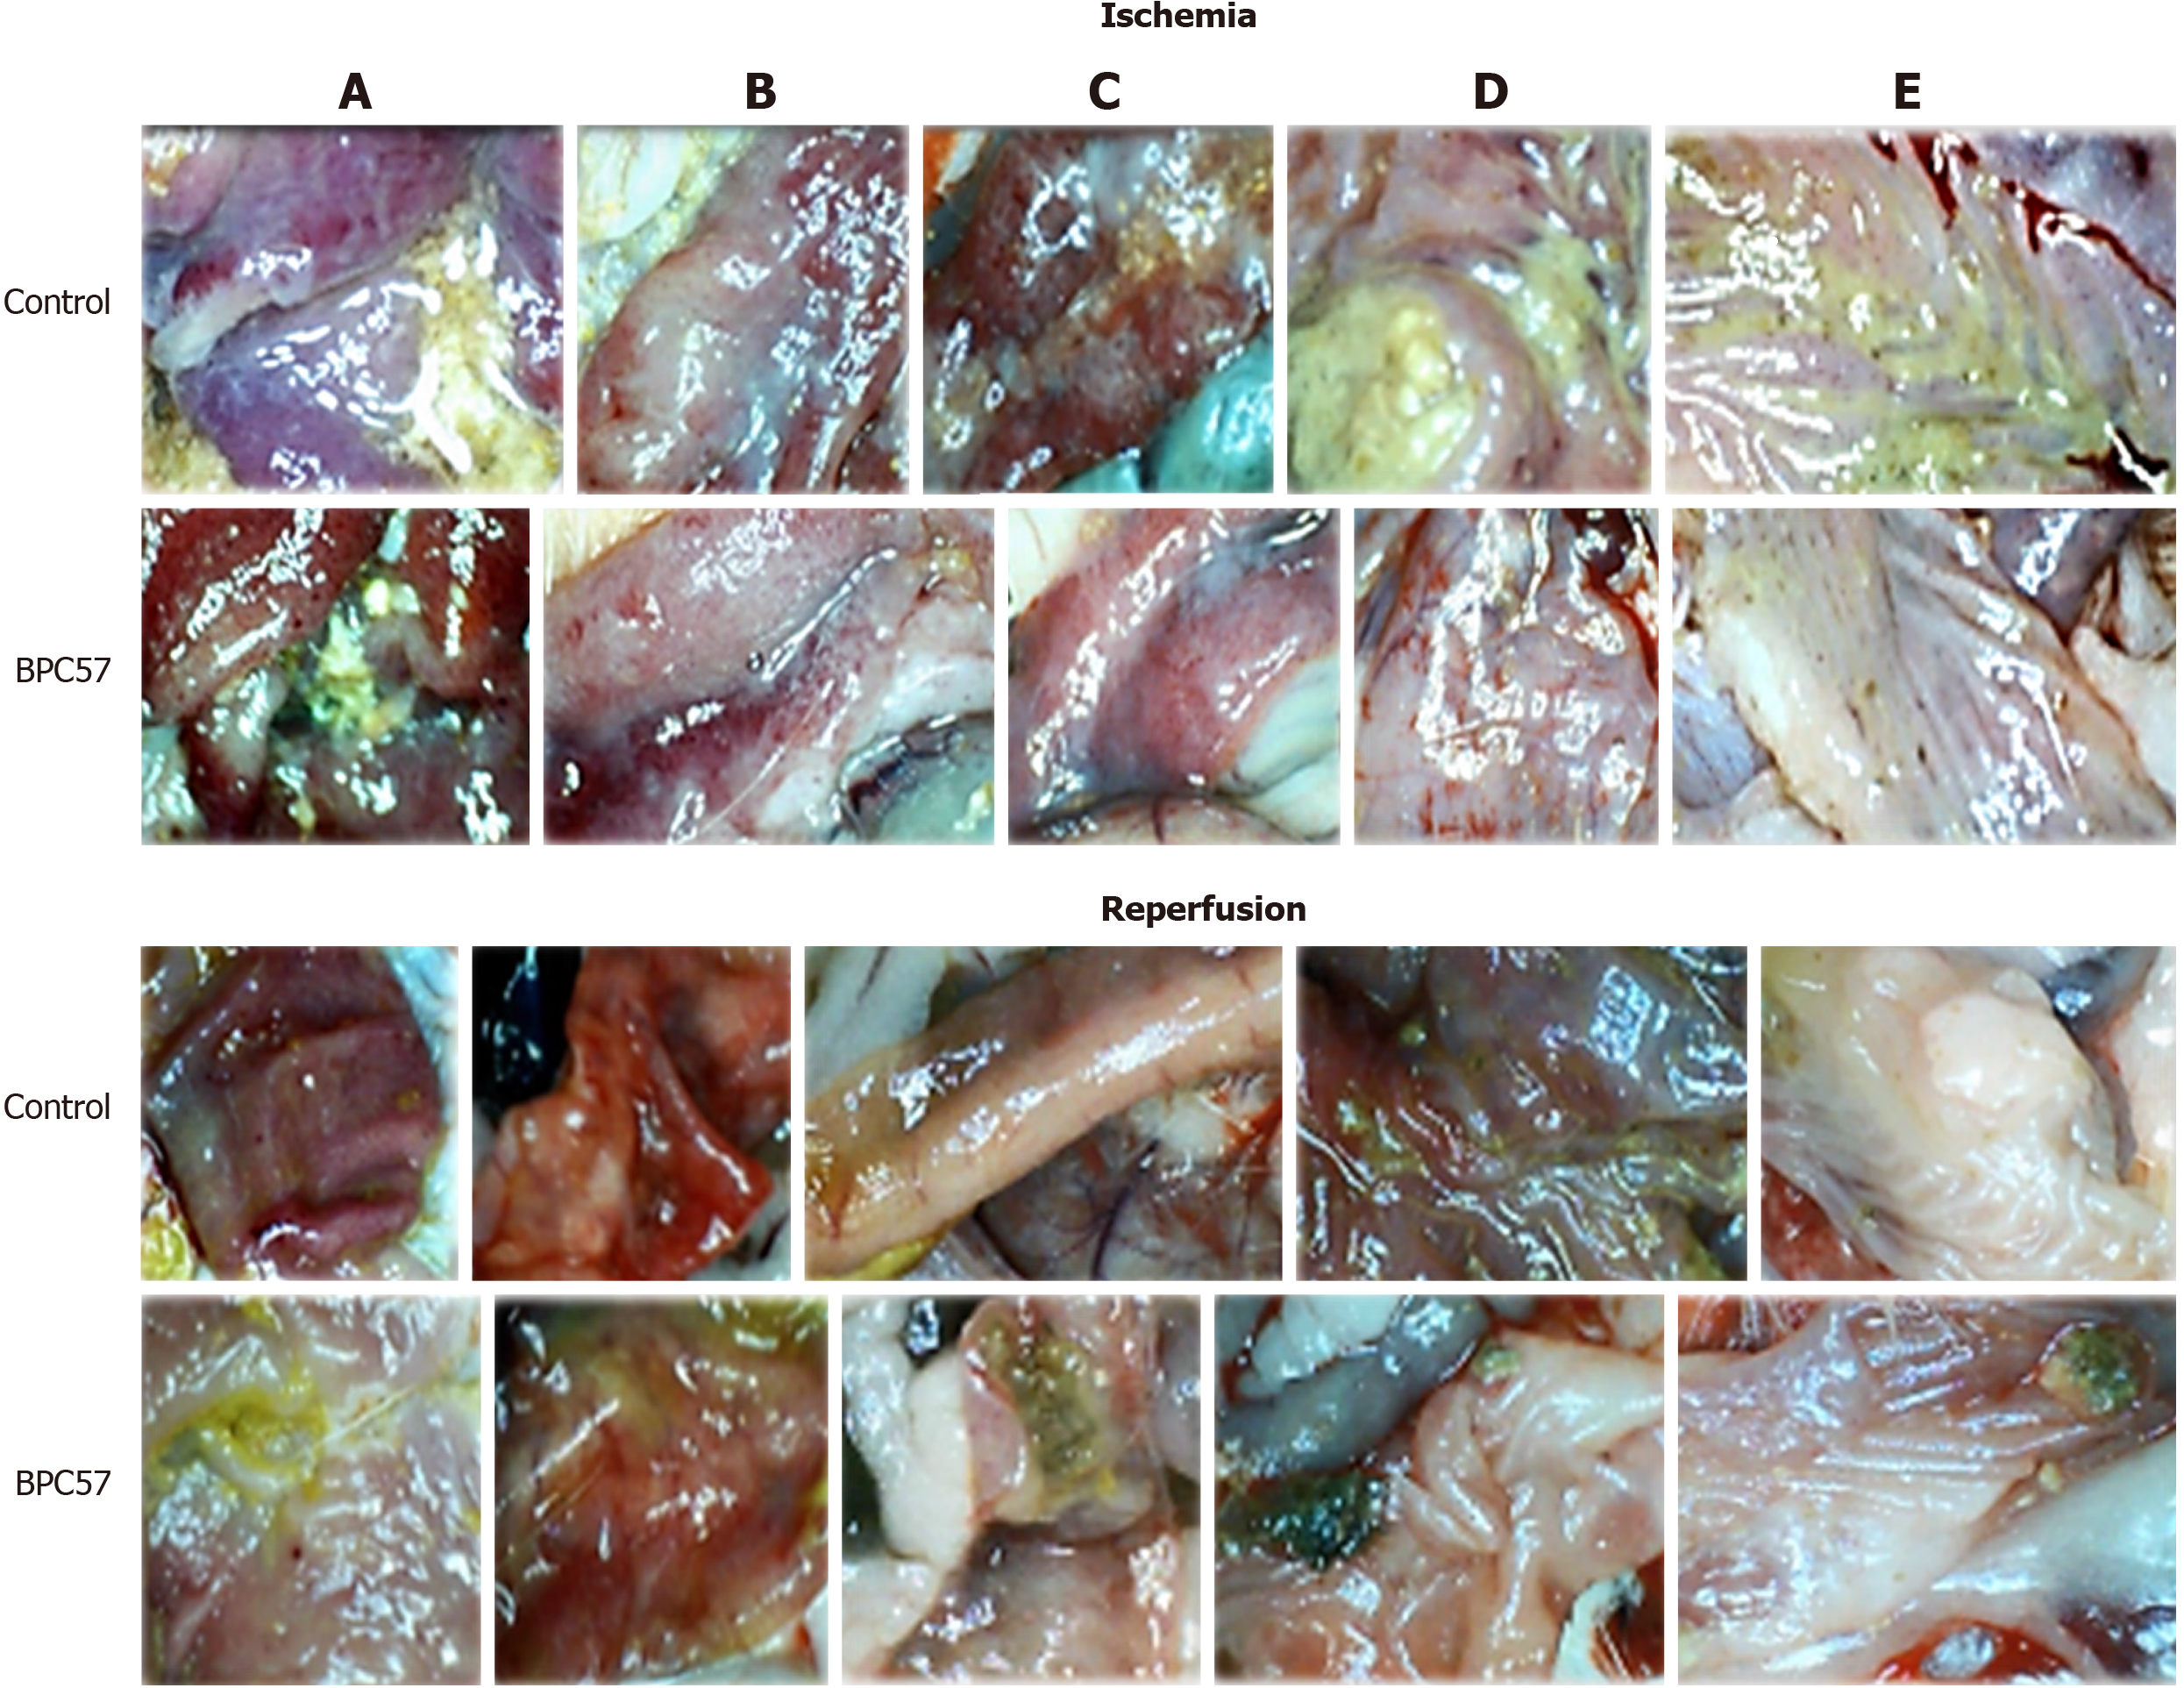
Figure 9 BPC 157 effect on gastrointestinal lesions gross presentation in ischemia (upper) and in reperfusion (lower).
A: Stomach; B: Duodenum; C: Jejunum; D: Cecum; E: Ascending colon. Lesions presentation in controls, at 30 min portal triad obstruction (PTO)-ligation-time in rats with PTO, and at 24 h reperfusion-time. Lesions attenuation in BPC 157 rats, at 30 min PTO-ligation-time in rats with PTO, and at 24 h reperfusion-time (Figure 7).
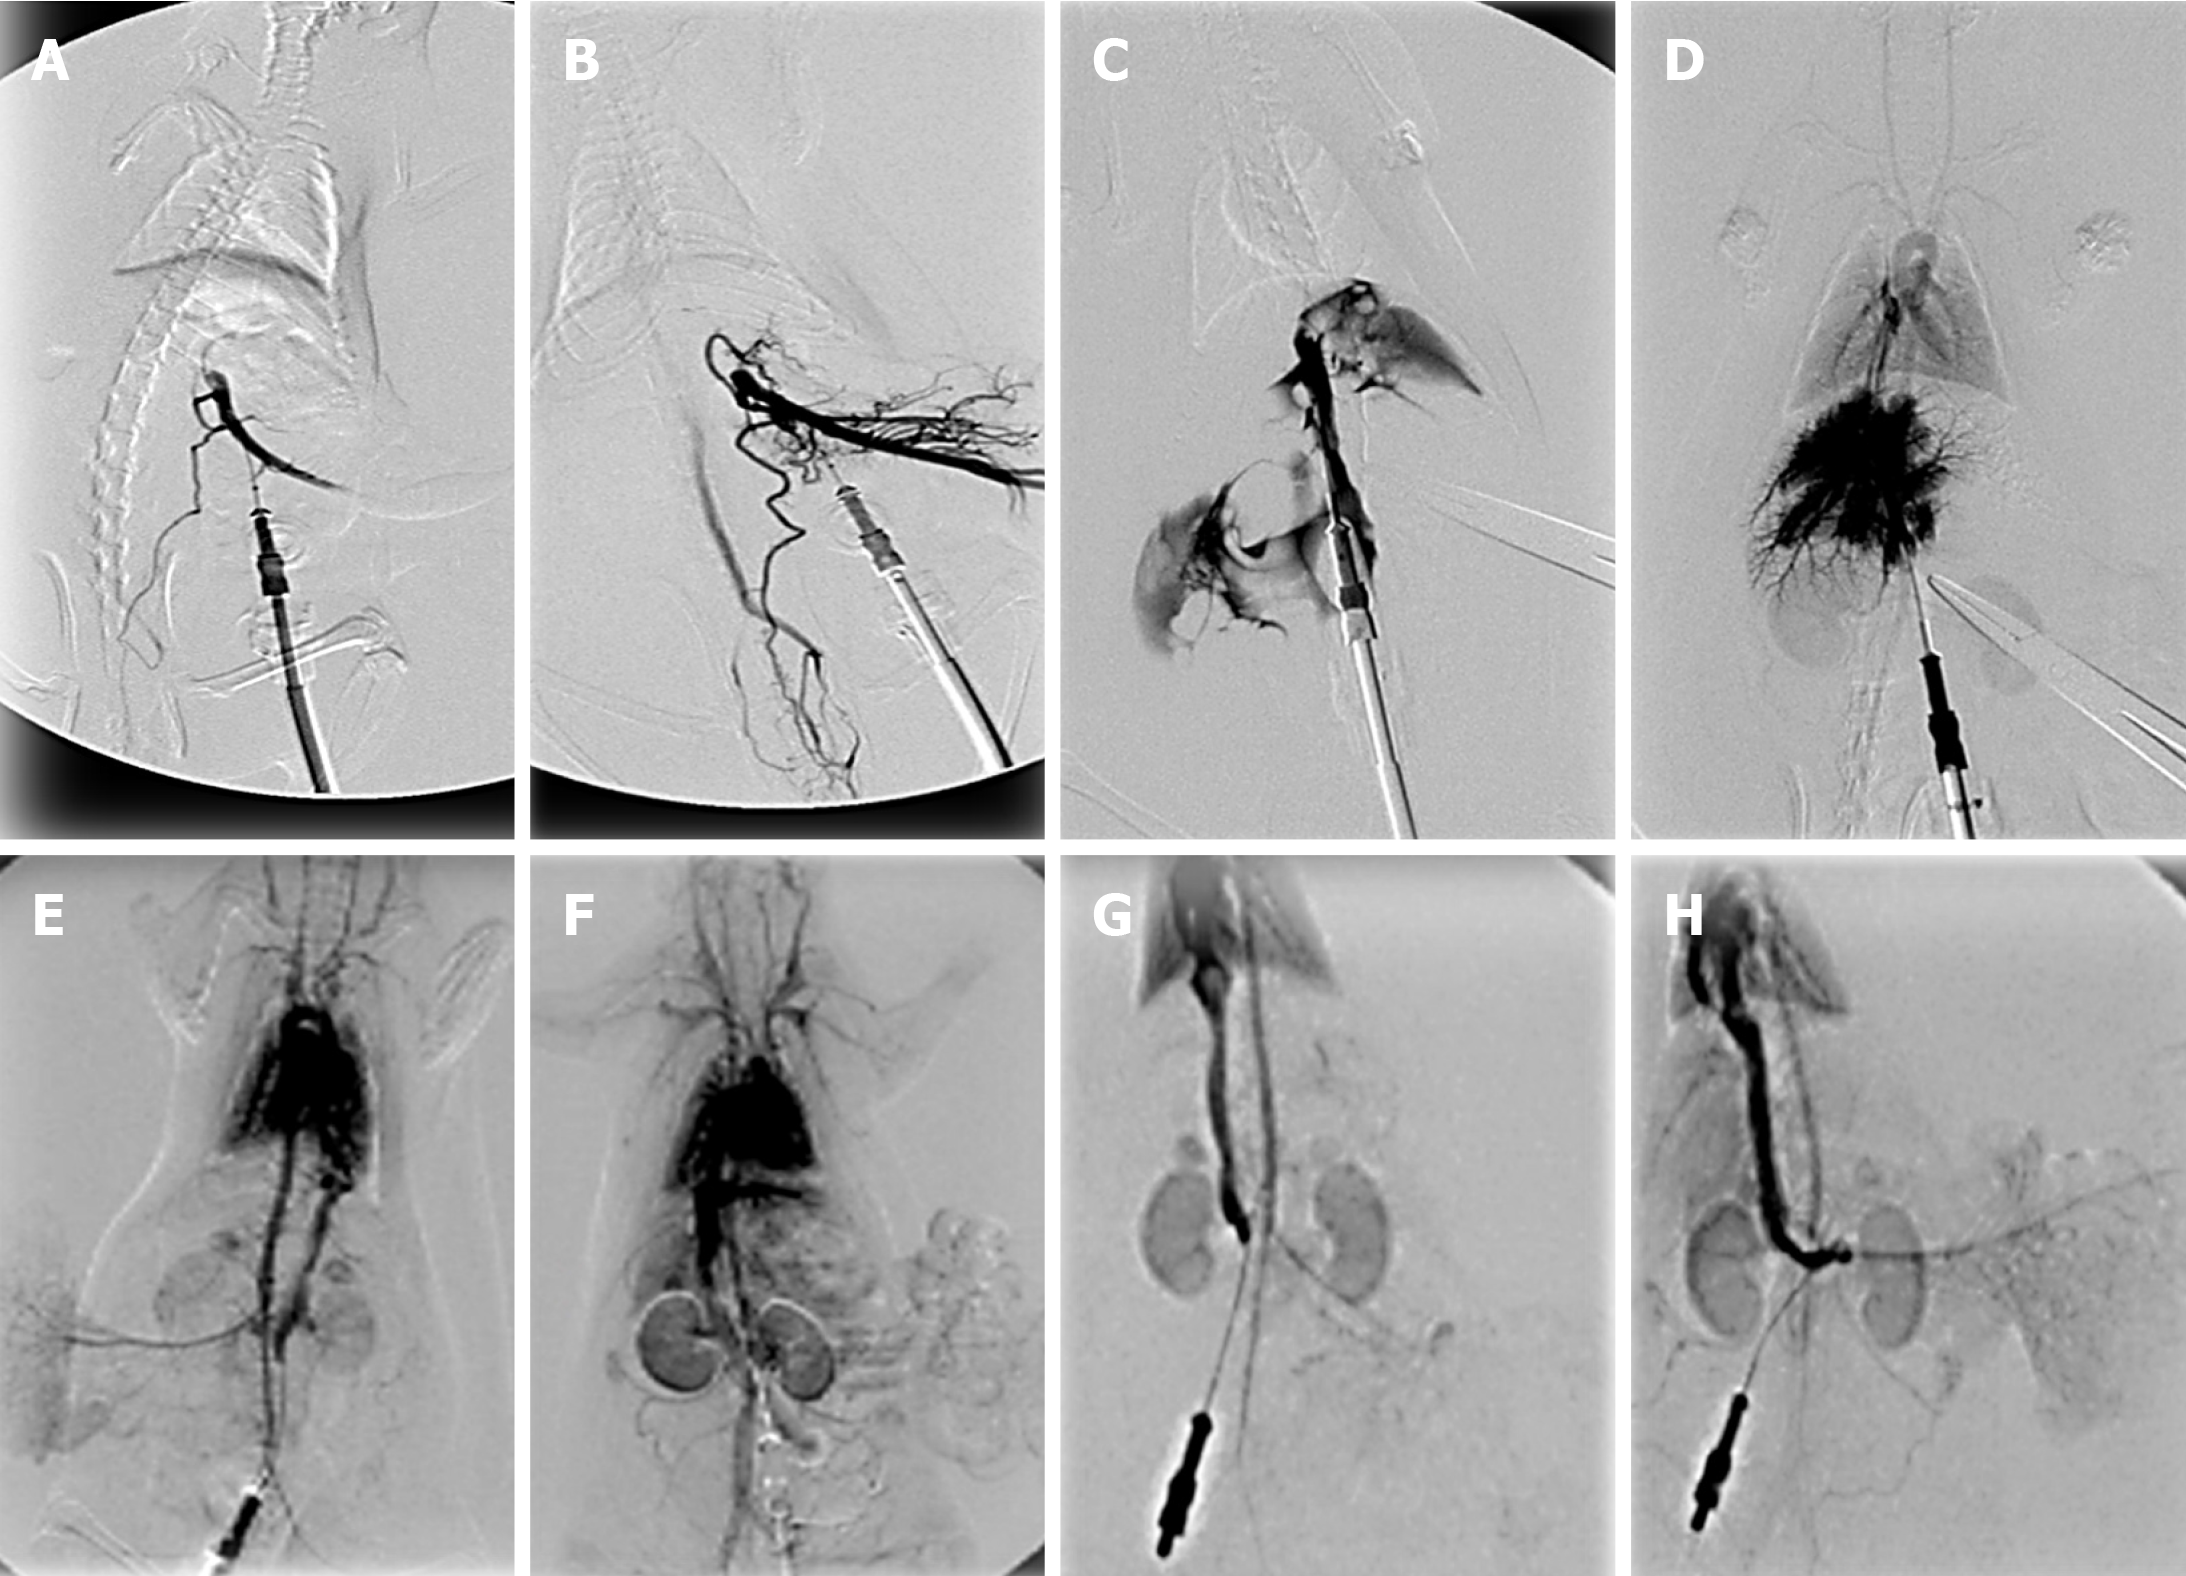
Figure 10 BPC 157 and venography assessment.
Portal vein venography below obstruction. A, B: The portal vein-superior mesenteric vein-inferior superior mesenteric vein-rectal veins-left iliac vein-inferior caval vein shunt presentation in rats with a portal triad obstruction (PTO)-ligation, controls (A), BPC 157 (B); C, D: Portal vein venography up to obstruction before its entry into the liver. Presentation of filling of the hepatic venous vascular bed, hepatic vein, inferior caval vein and the right atrium of the heart in rats with a PTO-ligation, controls (C) (note, as administration of contrast continued, the portal vein ruptured), BPC 157 (D); E, F: Inferior caval vein venography at the level of bifurcation. Blood flow through the hepatic veins into the liver, and the liver presentation in rats with a PTO-ligation, controls (E), BPC 157 (F); G, H: Reperfusion with inferior caval vein venography at the level of bifurcation. Presentation at the time when liver is presented in BPC 157 rats (H), and still not presented in controls (G). Venography 15 min of ligation-time, or at 15 min of reperfusion-time a fluoroscopy unit (Shimadzu type C-Vision Plus, Tokyo, Japan), Warmed non-ionic contrast medium (Iohexol; Omnipaque 350, GE Healthcare, Chicago, United States), a total injection volume of 1 mL (0.1 mL/s) in portal vein (A-D), or 2 mL (0.3 mL/s) in inferior caval vein (E-H).
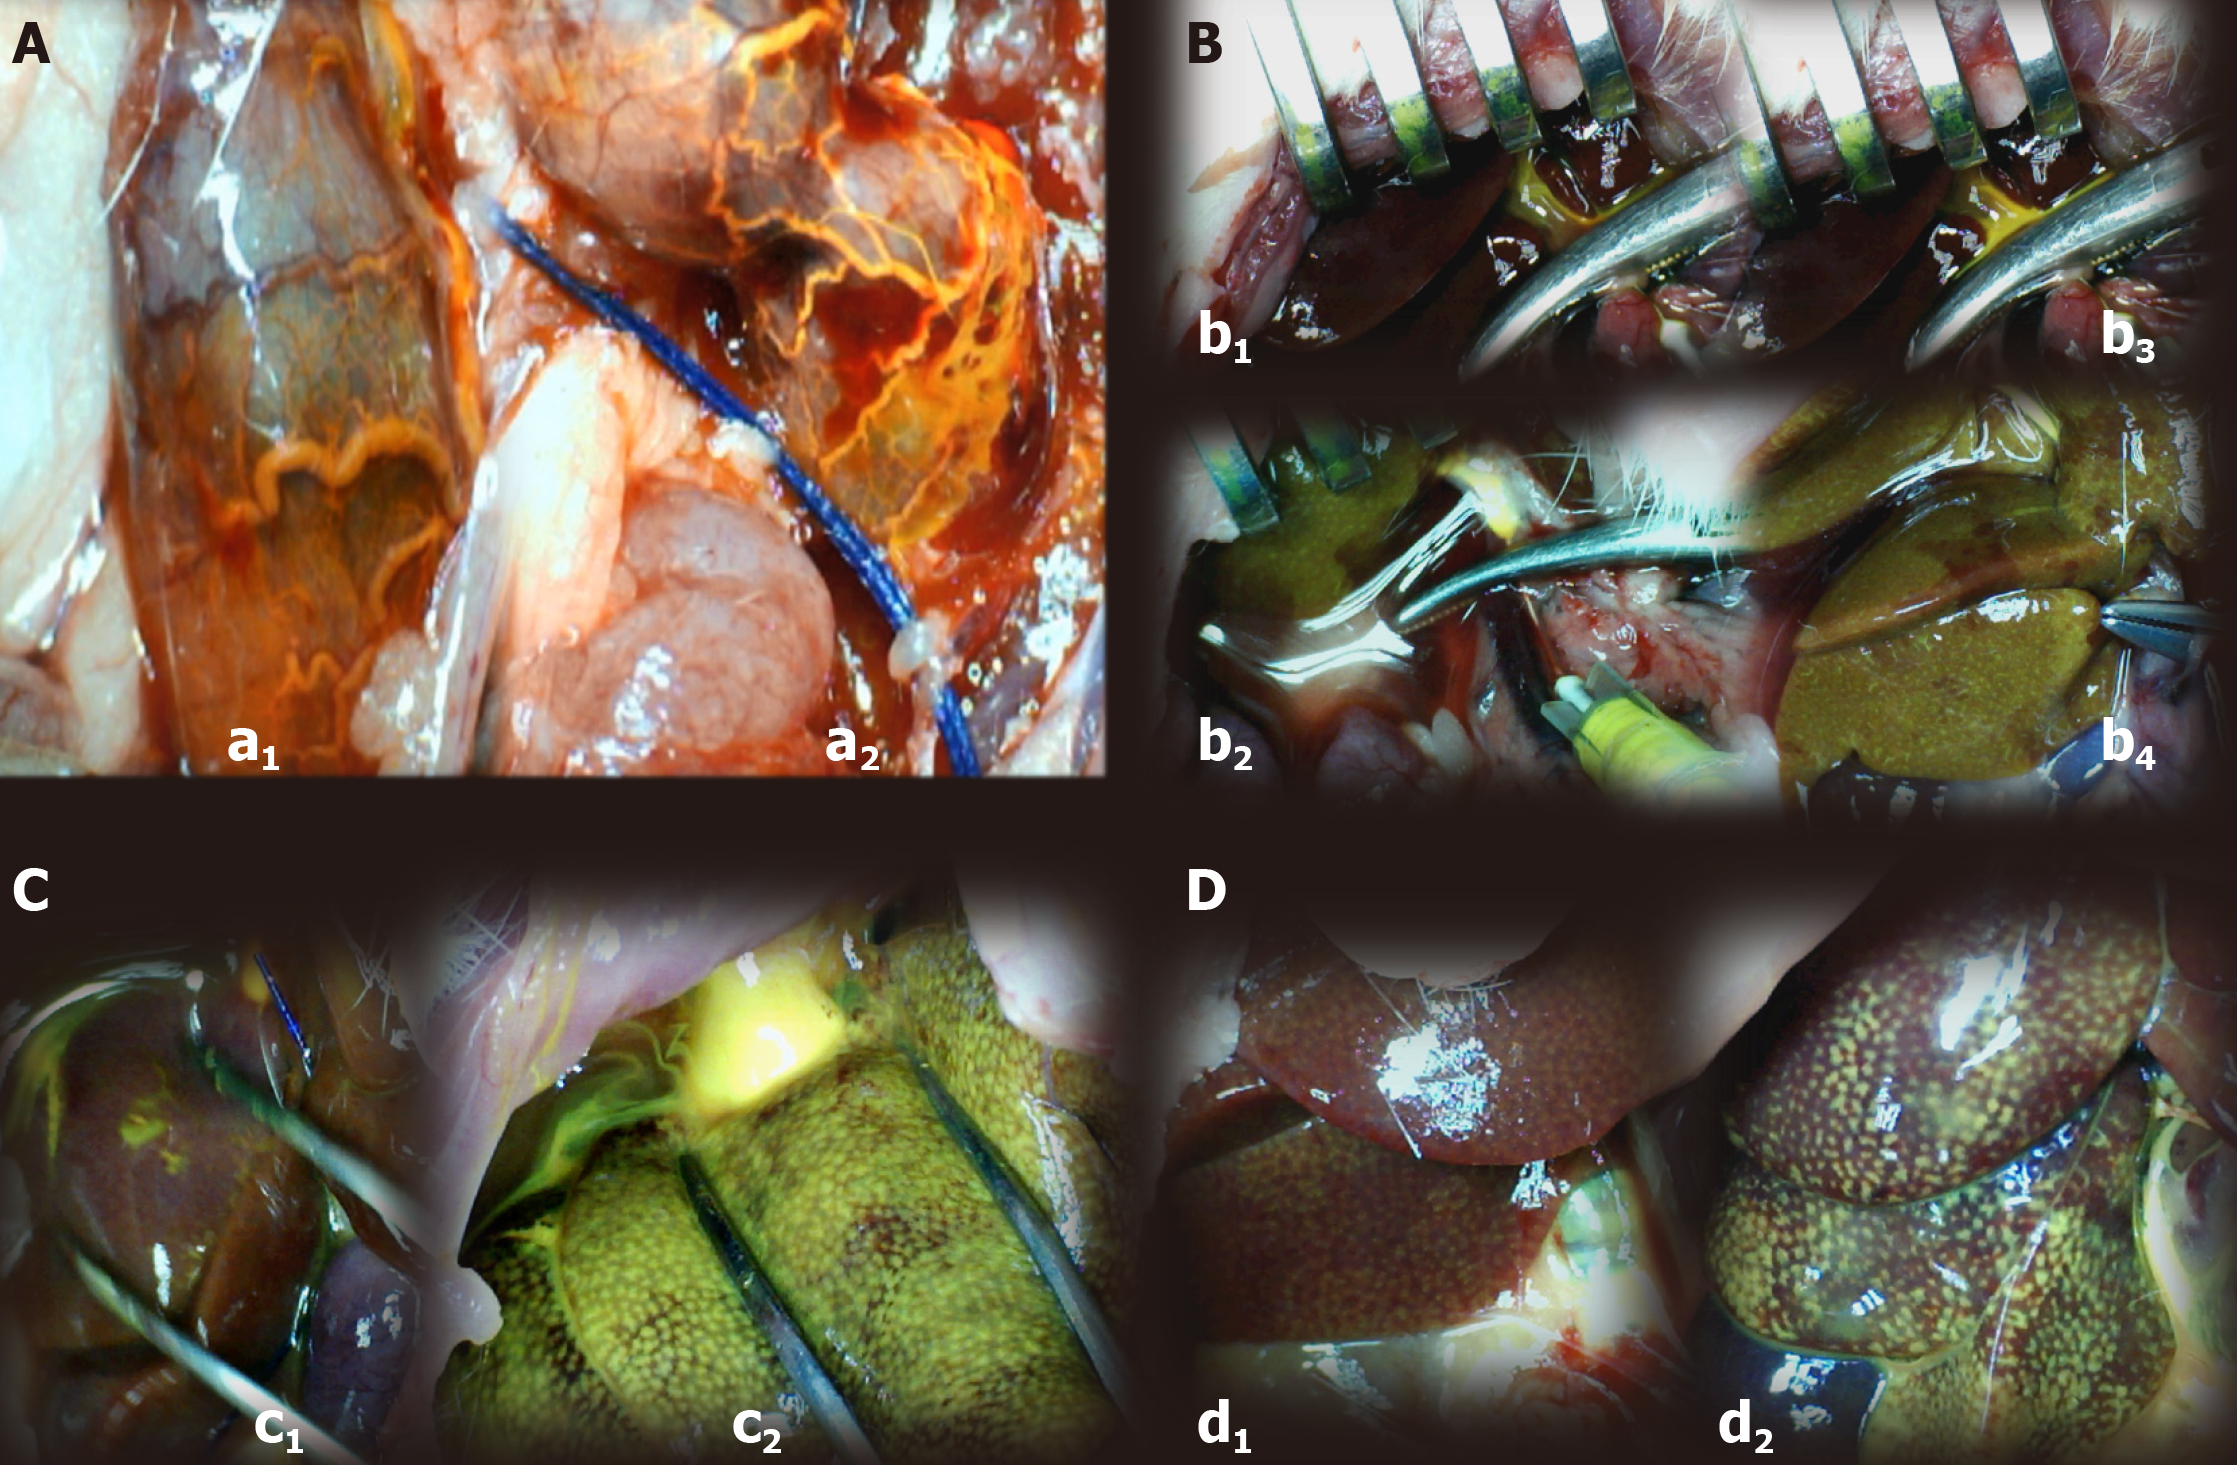
Figure 11 BPC 157 and yellow (orange) contrasts assessment.
Application in portal vein below obstruction. A: The portal vein-superior mesenteric vein-inferior superior mesenteric vein-rectal veins-left iliac vein-inferior caval vein shunt presentation in rats with a portal triad obstruction (PTO)-ligation, with rectal inferior mesenteric vein with the tortuous presentation controls (a1: scored 3/4/4 Min/Med/Max)) or rectal inferior mesenteric vein with increased branching , BPC 157 [a2: scored 1/1/2 (µg), 1/1/2 (ng) Min/Med/Max, aP < 0.05, at least vs control)]; B: Application in portal vein up to obstruction before its entry into the liver. Presentation of yellow contrast filling of the liver in rats with a PTO-ligation, controls [no yellow contrast in the liver (upper, b1, b3) (scored 1/1/1 Min/Med/Max)] [note, as administration of contrast continued (b3), the portal vein ruptured], BPC 157 (immediate presentation of yellow contrast (down, b2, b4) in the liver that further progressed (down, b4) scored 4/4/4 (µg), 4/4/4 (ng) Min/Med/Max, aP < 0.05, at least vs control); C: Application in inferior caval vein in rats with a PTO-ligation. Presentation of the hepatic veins into the liver, and the liver presentation in rats with a PTO-ligation, controls (c1: immediate scant yellow contrast presentation in liver that would later disappear and poor presentation in hepatic veins, scored 1/1/2 Min/Med/Max)), BPC 157 (c2: immediate very abundant presentation of yellow contrast in the liver, the yellow contrast in hepatic veins abundantly seen, scored 4/4/4 (µg), 4/4/4 (ng) Min/Med/Max, aP < 0.05, at least vs control); D: Reperfusion with yellow ink contrast application in inferior caval vein at the level of bifurcation. Presentation at the time when liver is fully presented in BPC 157 rats [d2: scored 3/4/4 (µg), 3/4/4 (ng) Min/Med/Max, aP < 0.05, at least vs control)], and still not fully presented in controls (d1: scored 1/2/3 Min/Med/Max). A total injection volume of 1 mL (0.1 mL/s) in portal vein (A, B), or 2 mL (0.3 mL/s) in inferior caval vein (C, D).
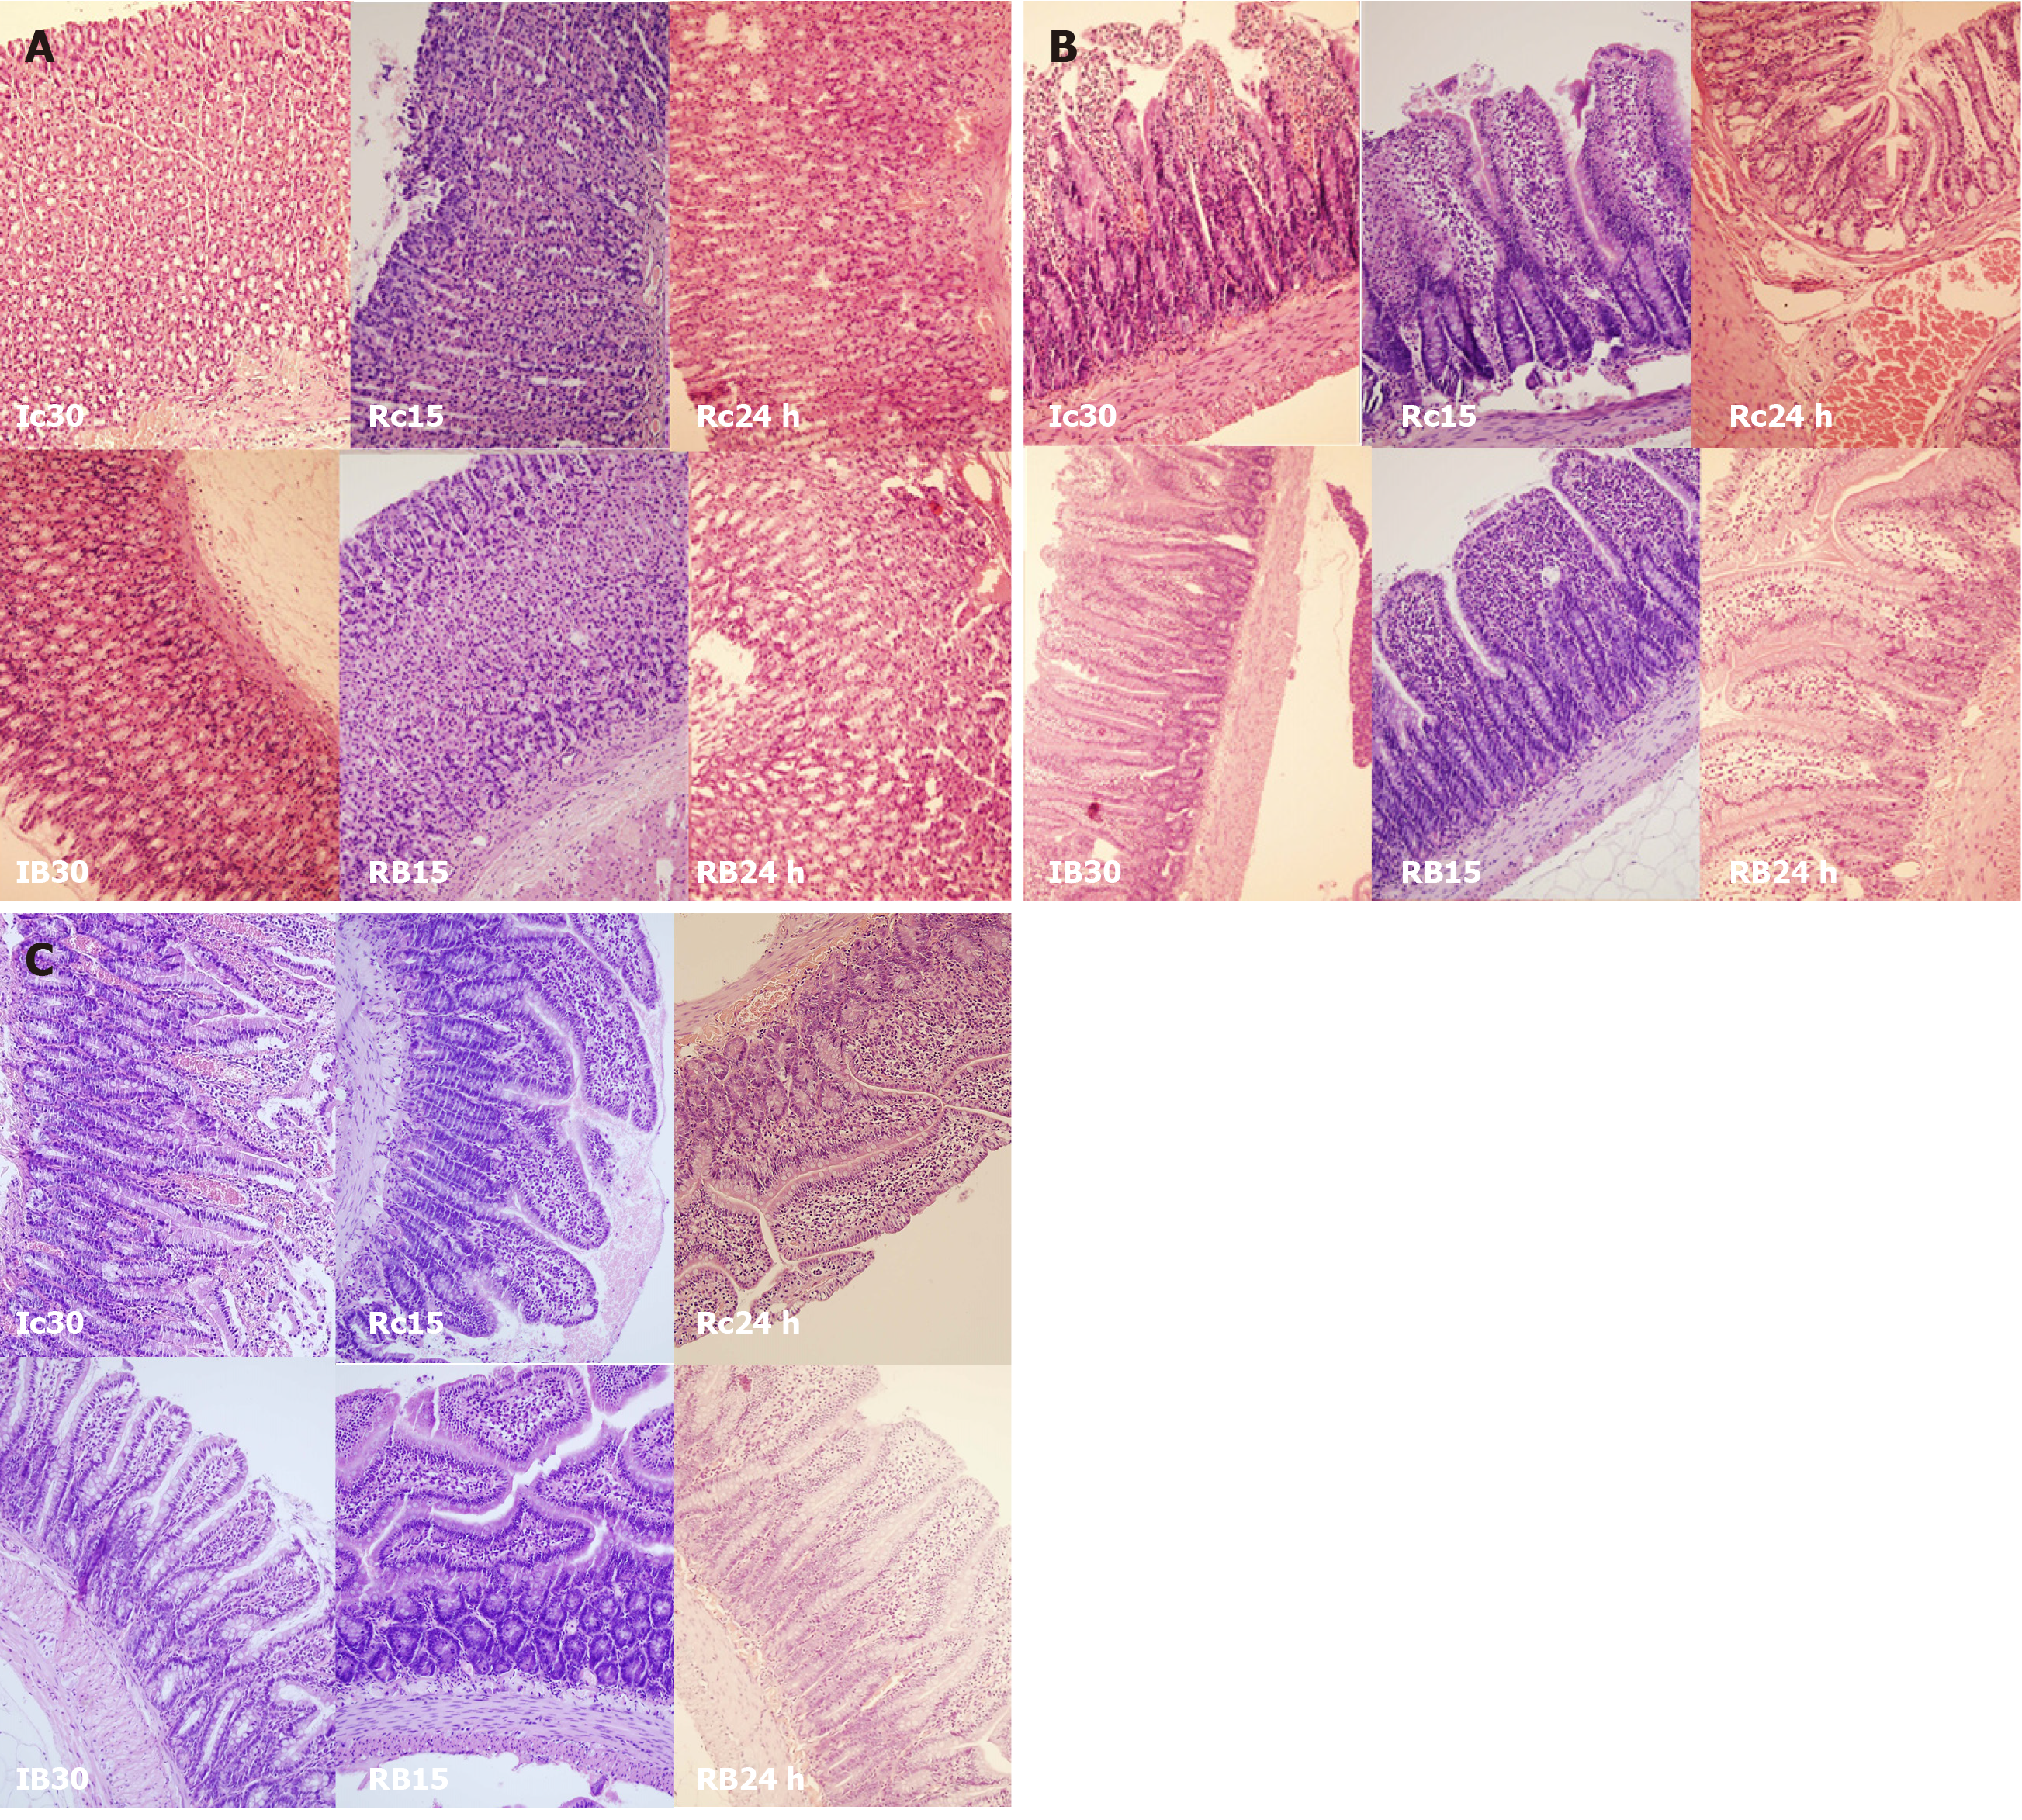
Figure 12 BPC 157 effect on gastrointestinal lesions microscopy presentation [stomach, duodenum, ileum].
A: Stomach (HE staining, × 20), Controls: Enhanced capillary congestion and erythrocytes extravasation present at the end of 30 min portal triad obstruction (PTO) ischemia period (Ic30). With reperfusion, as seen at 15 min of reperfusion the lesion progressed to enhanced capillary congestion, mild lifting of surface epithelial layer from lamina propria (Rc15). At the 24 h of reperfusion appears enhanced capillary congestion in lamina propria with erythrocytes showing ischemic changes (Rc24 h). BPC 157: Mildly villous surface, rare erythrocytes with ischemic changes present at the end of 30 min PTO ischemia period (IB30). With reperfusion, glandular architecture preserved at 15 min of reperfusion (RB15). At the 24 h of reperfusion appears only mild capillary congestion in lamina propria is seen. Architecture of glands is preserved (RB24 h). B: Duodenum (HE staining, × 20), Controls: Loss of villous architecture, loss of surface epithelium, edema of lamina propria present at the end of 30 min PTO ischemia period (Ic30). With reperfusion, the lesion progressed as seen with edema of lamina propria with extravasation of erythrocytes, some of them with ischemic changes, and focal loss of surface epithelium at 15 min of reperfusion (Rc15). At the 24 h of reperfusion appear enhanced capillary congestion, focal erythrocytes showing ischemic changes (Rc24 h). BPC 157: Mild capillary congestion in lamina propria is seen with edema of lamina propria. Extravasation of erythrocytes, elevation of surface epithelium from lamina propria at the end of 30 min PTO ischemia period (IB30). Villous architecture is preserved. Edema of lamina propria with extravasation of erythrocytes and reparatory changes of epithelium. Mild capillary congestion in lamina propria is seen at 15 min of reperfusion (RB15). At the 24 h of reperfusion villous architecture is preserved. Edema of lamina propria (RB24 h); C: Ileum (HE staining, × 20), Controls: Loss of villous architecture, enhanced elevation of surface epithelium from lamina propria with loss of surface epithelium, edema of lamina propria, marked capillary congestion present at the end of 30 min PTO ischemia period (Ic30). With reperfusion, edema of lamina propria with extravasation of erythrocytes. Some of them with ischemic changes. Mild lymphocytic infiltrate. Focal elevation of surface epithelium from lamina propria, at 15 min of reperfusion (Rc15). At the 24 h of reperfusion appear enhanced capillary congestion, focal erythrocytes showing ischemic changes (Rc24 h). BPC 157: Mild capillary congestion in lamina propria is seen with mild edema of lamina propria. Mild elevation of surface epithelium from lamina propria. Some lymphocytes infiltrating lamina propria at the end of 30 min PTO ischemia period (IB30). Villous architecture is preserved, edema of lamina propria with extravasation of erythrocytes and mild lymphocytic infiltrate is seen at 15 min of reperfusion (RB15). At the 24 h of reperfusion mild capillary congestion in lamina propria is seen, villous architecture is preserved, edema of lamina propria (RB24 h).
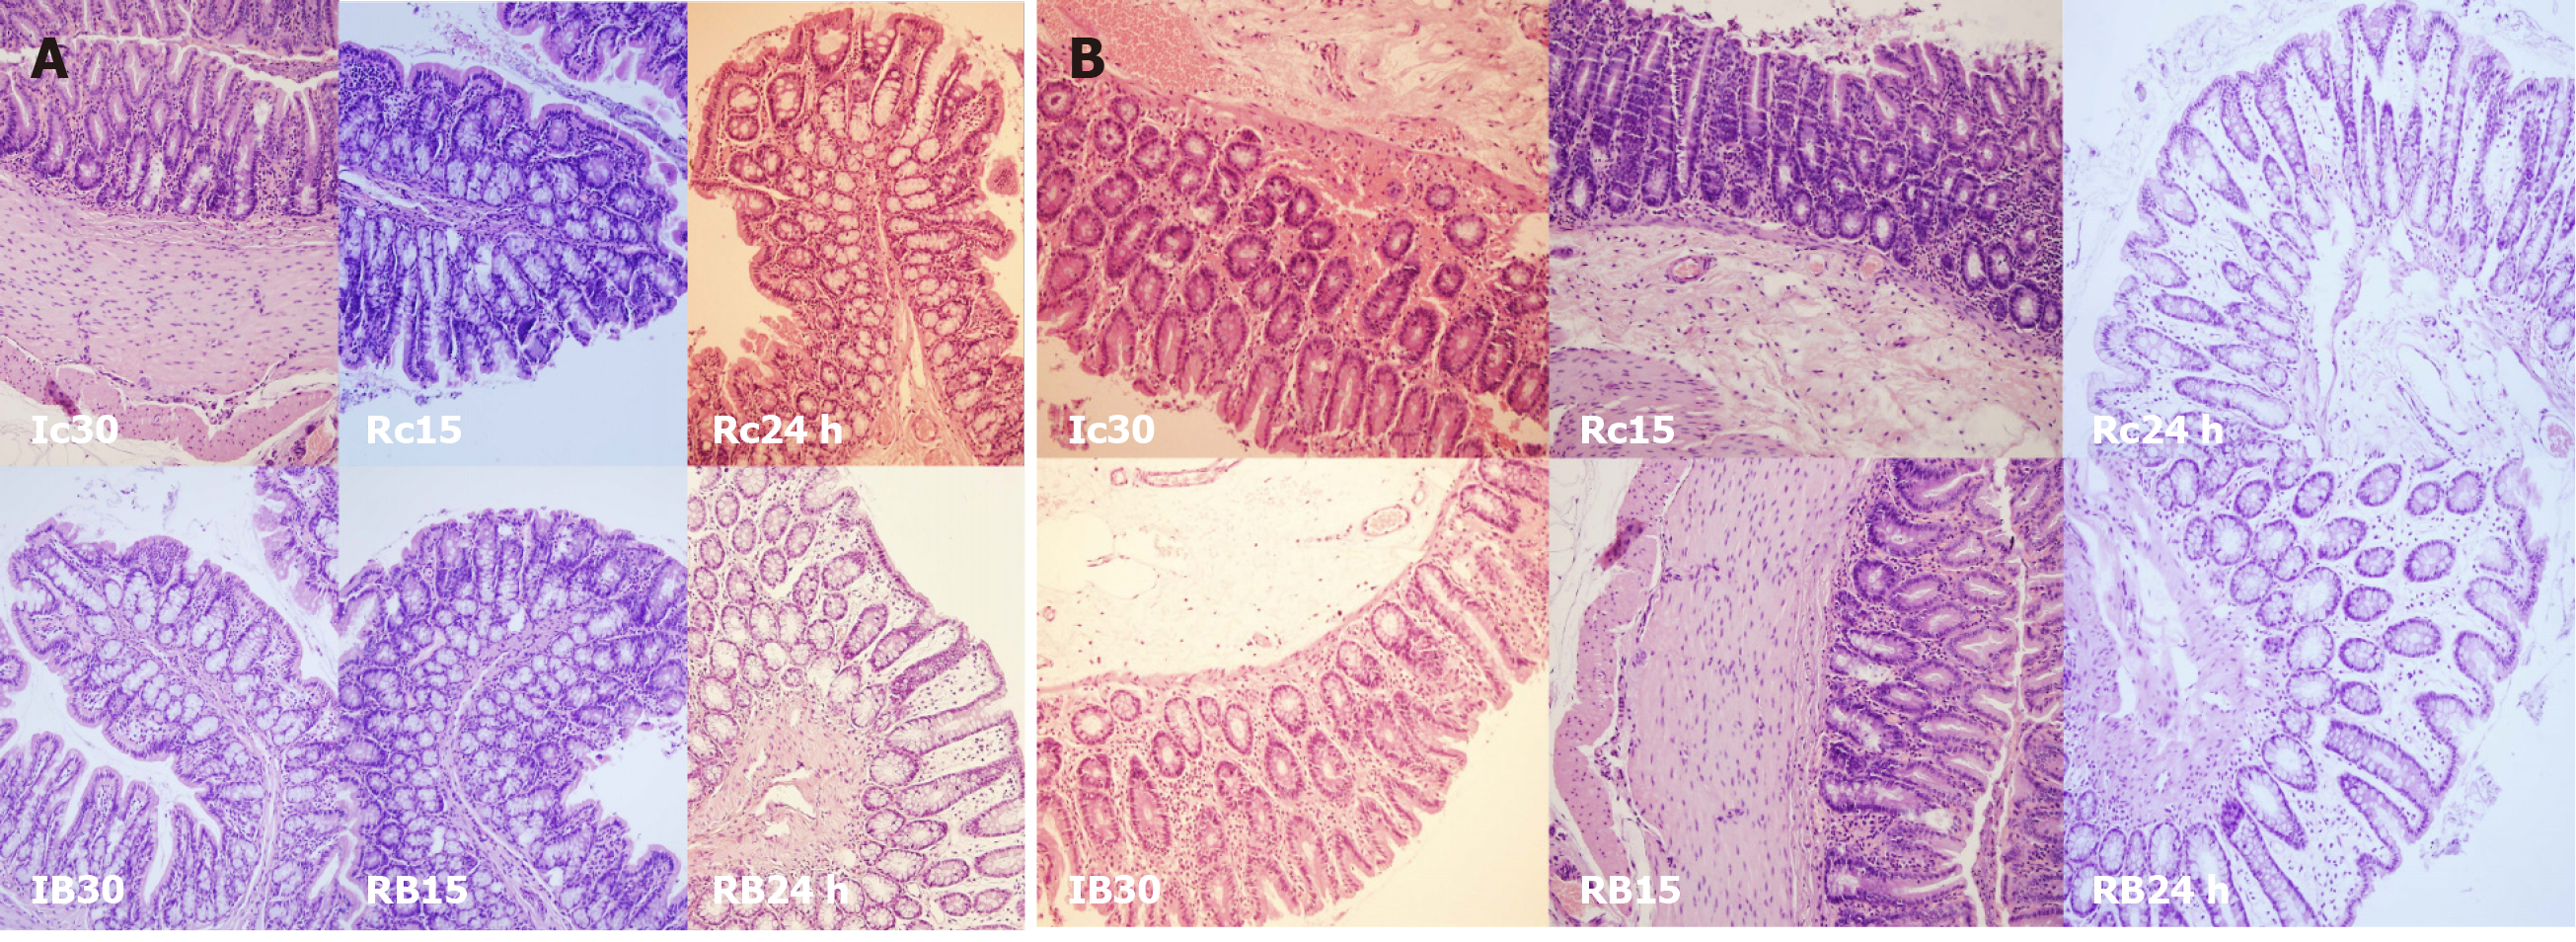
Figure 13 BPC 157 effect on gastrointestinal lesions microscopy presentation (cecum, colon).
A: Cecum (HE staining, × 20), controls: Increased capillary congestion and edema of lamina propria. Extravasation of erythrocytes some of them with ischemic changes. Present at the end of 30 min portal triad obstruction (PTO) ischemia period (Ic30). With reperfusion, at 15 min of reperfusion mild capillary congestion with just focal loss of surface epithelium. Mild infiltrate of lymphocytes (Rc15). At the 24 h of reperfusion appear enhanced capillary congestion, focal erythrocytes showing ischemic changes (Rc24 h). BPC 157: Mild capillary congestion in lamina propria is seen with mild edema of lamina propria at the end of 30 min PTO ischemia period (IB30). Mild capillary congestion in lamina propria is seen at 15 min of reperfusion (RB15). At the 24 h of mild capillary congestion in lamina propria is seen. Edema of lamina propria (RB24 h); B: Colon (HE staining, × 20), controls: Increased capillary congestion and edema of lamina propria, extravasation of erythrocytes some of them with ischemic changes, focal loss of surface epithelium present at the end of 30 min PTO ischemia period (Ic30). With reperfusion, at 15 min of reperfusion mild capillary congestion with just focal loss of surface epithelium (Rc15). At the 24 h of reperfusion appear enhanced capillary congestion, focal erythrocytes showing ischemic changes (Rc24 h). BPC 157: Mild capillary congestion in lamina propria with mild edema of lamina propria at the end of 30 min PTO ischemia period (IB30). Mild capillary congestion in lamina propria is seen at 15 min of reperfusion (RB15). At the 24 h of mild capillary congestion in lamina propria is seen. Edema of lamina propria (RB24 h).
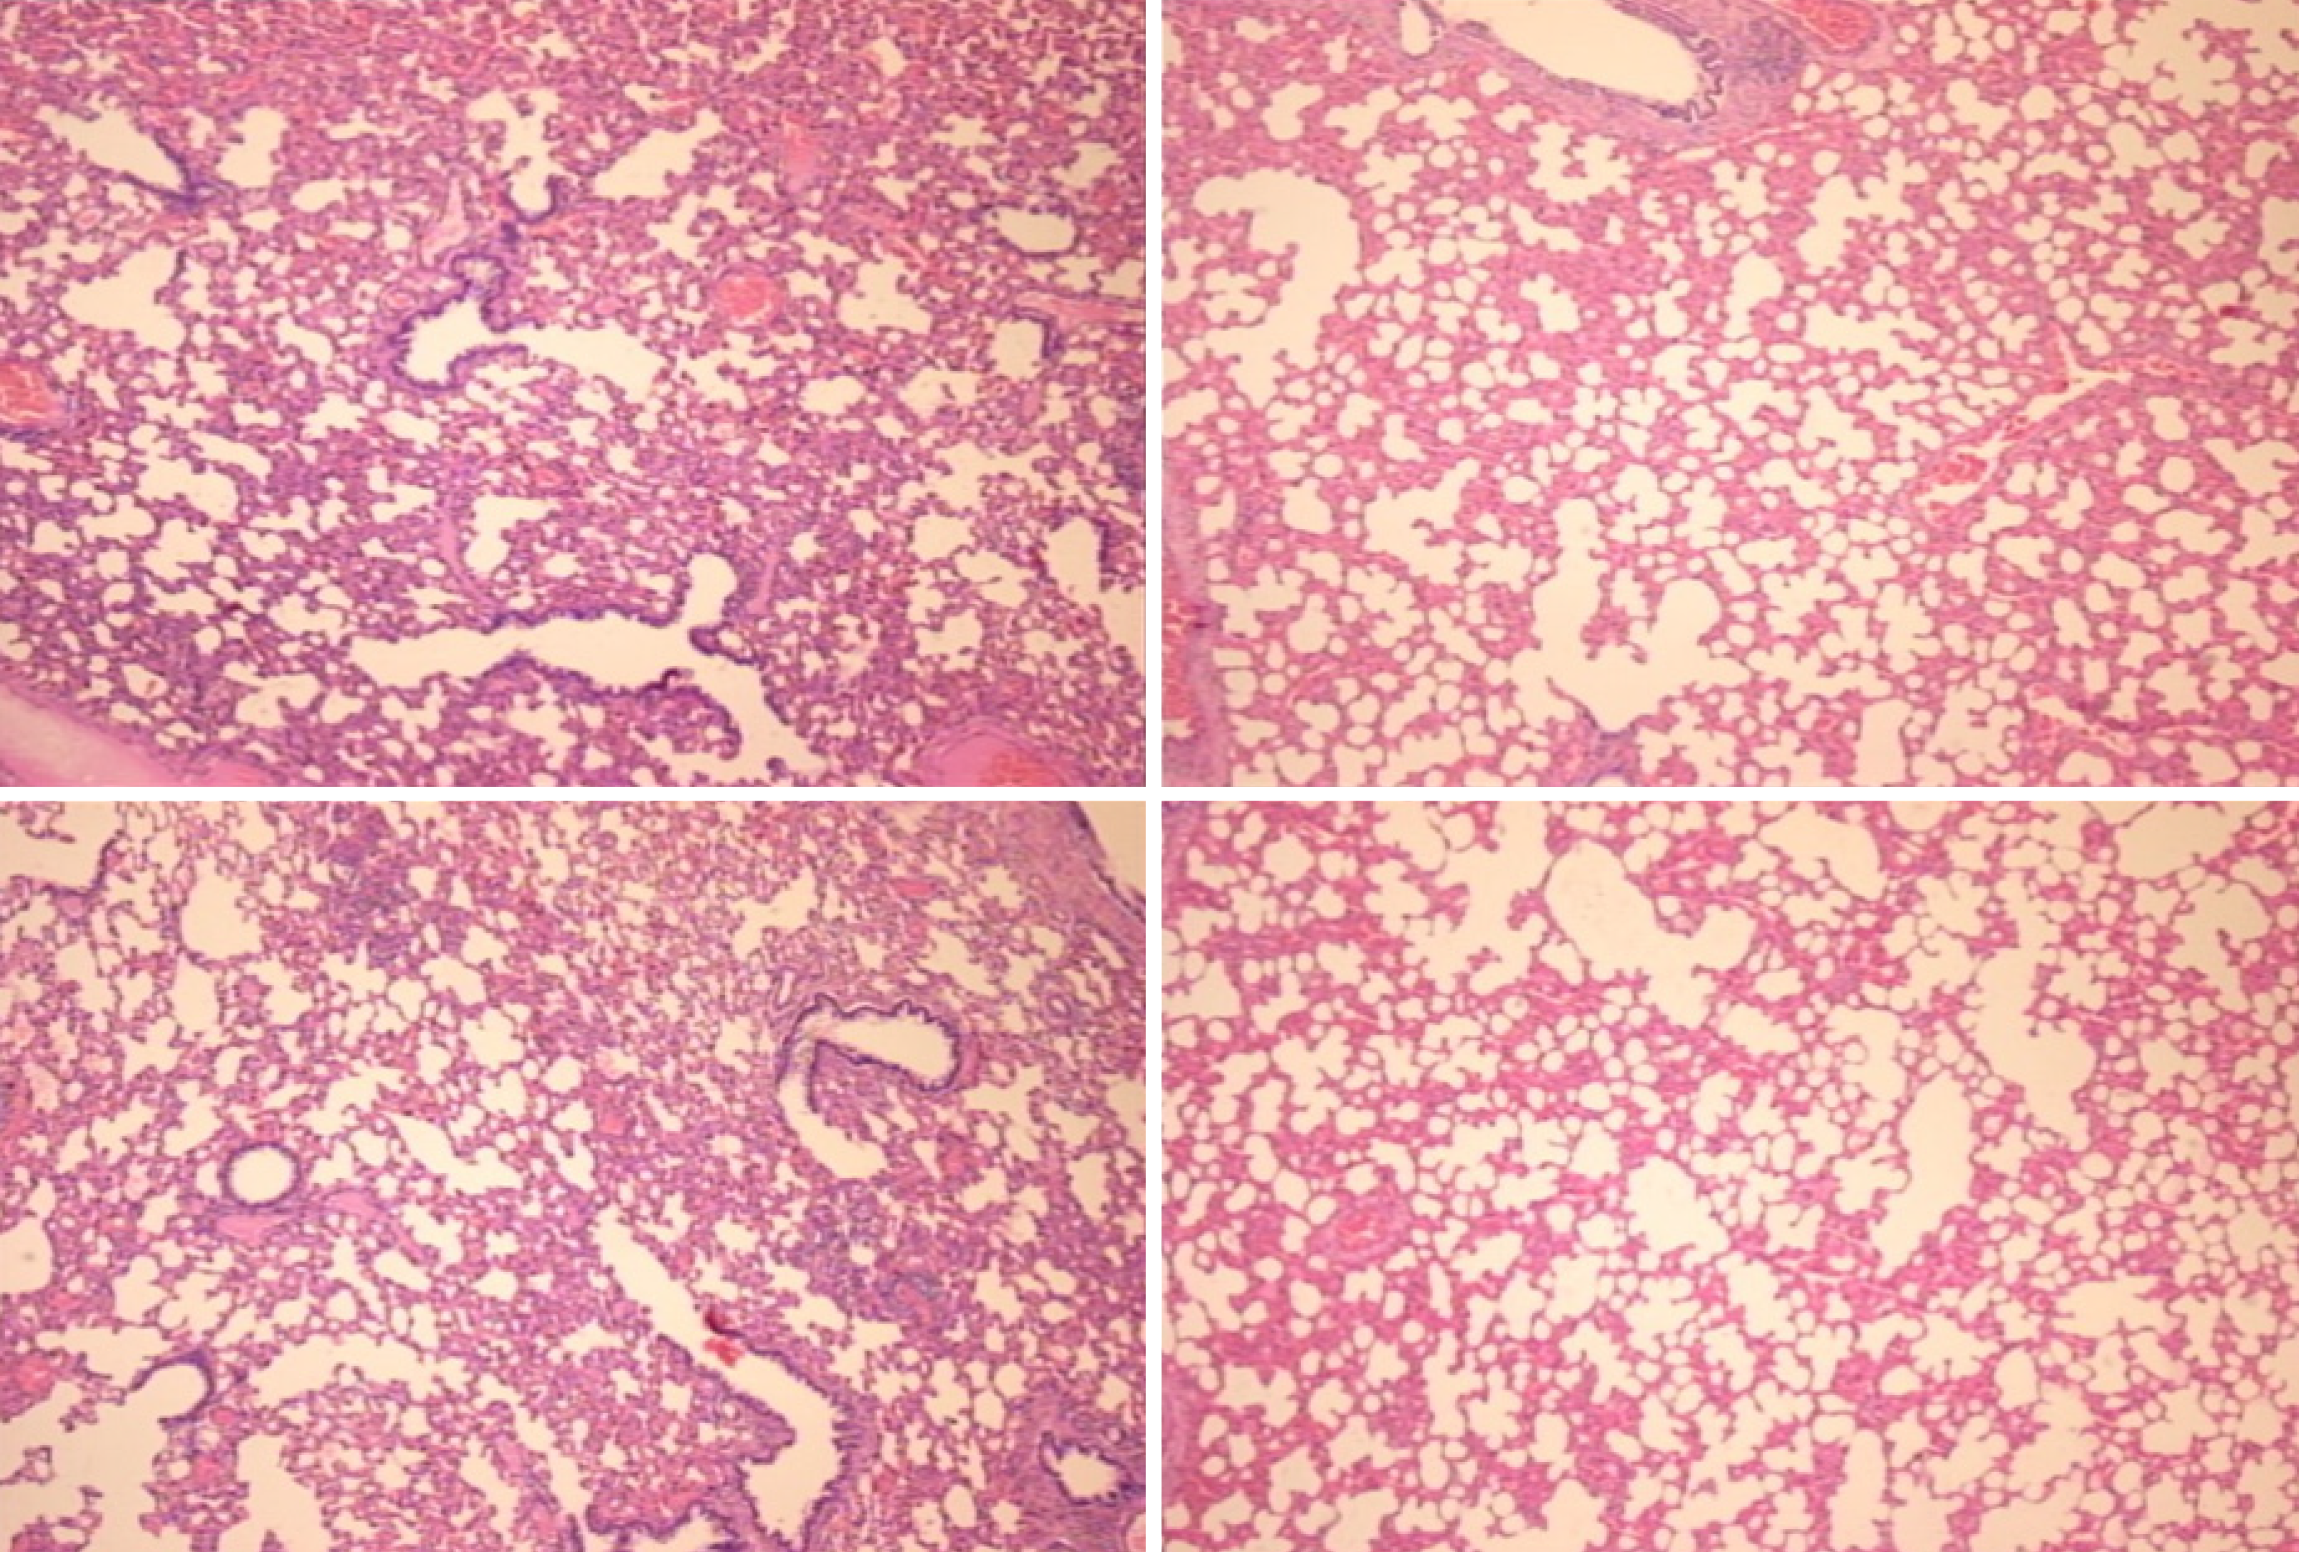
Figure 14 Lung (HE staining, × 4).
Portal triad obstruction-rats, 24 h reperfusion (control, left; BPC 157 right). While architecture was preserved, there was in portal triad obstruction-rats some edematous exudate in alveoli and progressing capillary congestion, mild to severe in alveolar septa, which counteraction was clearly seen at 24 h of reperfusion.
- Citation: Kolovrat M, Gojkovic S, Krezic I, Malekinusic D, Vrdoljak B, Kasnik Kovac K, Kralj T, Drmic D, Barisic I, Horvat Pavlov K, Petrovic A, Duzel A, Knezevic M, Mirkovic I, Kokot A, Boban Blagaic A, Seiwerth S, Sikiric P. Pentadecapeptide BPC 157 resolves Pringle maneuver in rats, both ischemia and reperfusion. World J Hepatol 2020; 12(5): 184-206
- URL: https://www.wjgnet.com/1948-5182/full/v12/i5/184.htm
- DOI: https://dx.doi.org/10.4254/wjh.v12.i5.184


