Copyright
©The Author(s) 2016.
World J Stem Cells. Oct 26, 2016; 8(10): 355-366
Published online Oct 26, 2016. doi: 10.4252/wjsc.v8.i10.355
Published online Oct 26, 2016. doi: 10.4252/wjsc.v8.i10.355
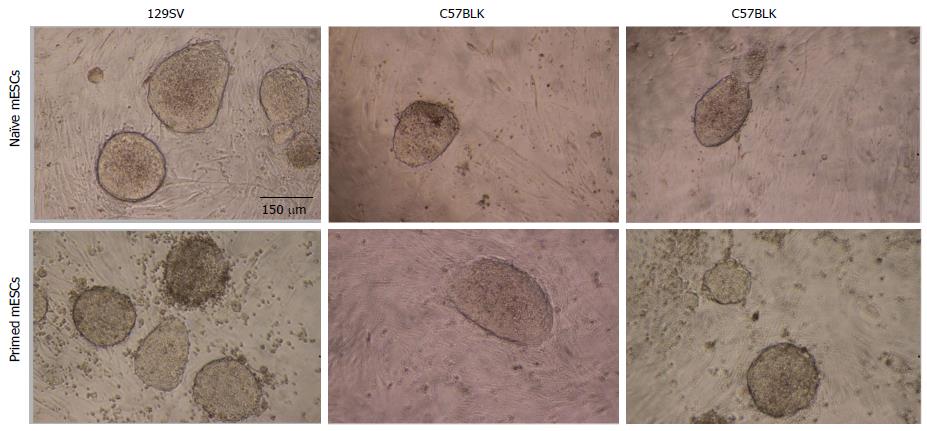
Figure 1 Primed and naive cells from different strains exhibit similar morphology.
Cells that turn out to be primed are visually indistinguishable from otherwise fully naïve stem cells (scale bar 150 μm). ESCs: Embryonic stem cells
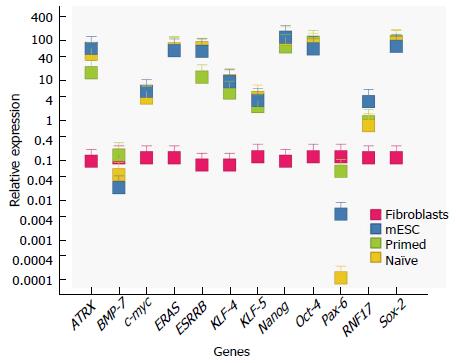
Figure 2 Differentially expressed genes in primed, naive and reprogrammed primed embryonic stem cells.
qRT-PCR of known master factor stem cell genes and candidate genes selected from our microarray analysis (Tables 3 and 4, Figure 4). Differences are measured in relative expression levels (to control fibroblasts). Results show that master factor genes such as Oct-4, Sox-2 and Nanog are all significantly higher than the control fibroblasts (red) in naive (blue), primed (green) and reprogrammed primed cells (yellow). Primers used are shown in Table 2. Esrrb, Atrx and Rnf-17 are all significantly upregulated in naïve ESCs and reprogrammed primed ESCs, relative to primed ESCs. Pax-6 and BMP-7 are significantly upregulated in primed ESCs. Expression levels were measured in established ESCs and primed ESCs after the 30th passage, in re-programmed primed ESCs two passages after transduction, and in fibroblasts two passages after primary cells were extracted. Error bars indicate SEM within cell populations (Tukey’s post hoc, P < 0.001; n = 5 replicates of independent cell lines). ESCs: Embryonic stem cells.
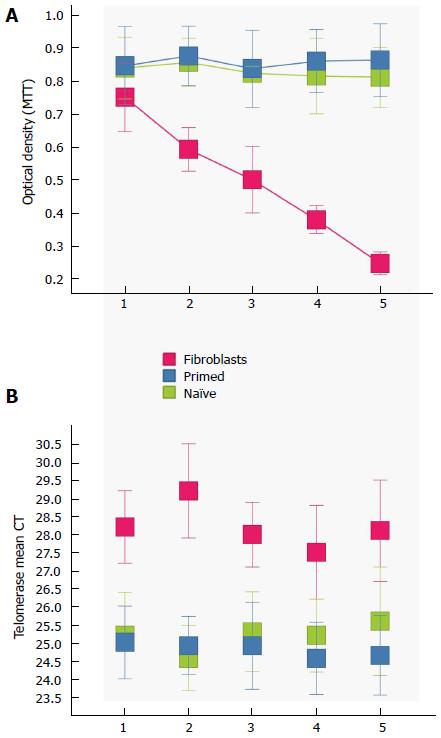
Figure 3 Proliferation and telomerase.
Time course of self-renewal and proliferation of stem cells (potential induced pluripotent stem cells-like cells and embryonic stem cells) relative to control fibroblast (red) as measured by the MTT [3-(4,5-Dimethylthiazol-2-yl)-2,5-diphenilytetrazolium bromide] assay (read at 570 nm). mESCs (blue) and primed mESCs (green) exhibit similar patterns of proliferation, while fibroblast proliferation diminishes as time passes. Telomerase activity was greatly increased (lower mean CT) in both mESCs and primed mESCs over control fibroblast cells. Error bars, SEM (n = 5 independent replicates for both MTT and telomerase data). mESCs: Mouse embryonic stem cells; CT: Cycle threshold.
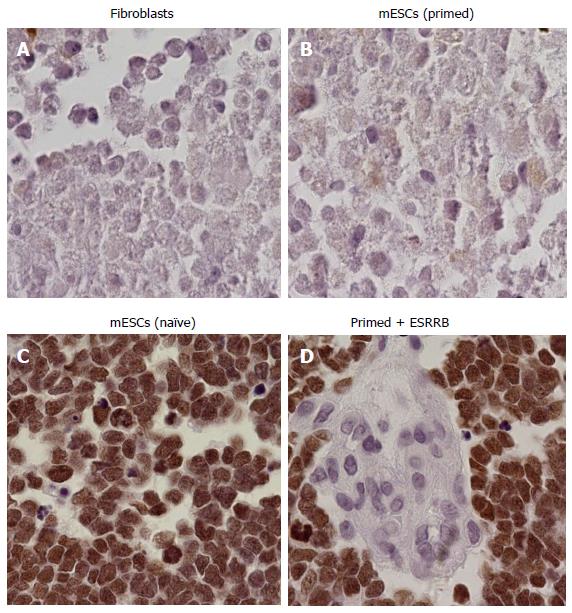
Figure 4 Sample tissue of mouse embryos after blastocyst injections of embryonic stem cells (100 ×).
Five days old embryos that were produced with GFP labeled cells were sectioned and stained for GFP (brown color). Sample tissues are shown here. Cells that were reprogrammed with Esrrb + Klf-4 + c-myc integrated into the embryo (D), as well as positive control naïve ESCs (C). No incorporation was observed in the primed state (B) or in control embryos injected with fibroblasts (A). Sample size was set at n = 4 mice per cell type. ESCs: Embryonic stem cells; GFP: Green fluorescent protein.
- Citation: Rossello RA, Pfenning A, Howard JT, Hochgeschwender U. Characterization and genetic manipulation of primed stem cells into a functional naïve state with ESRRB. World J Stem Cells 2016; 8(10): 355-366
- URL: https://www.wjgnet.com/1948-0210/full/v8/i10/355.htm
- DOI: https://dx.doi.org/10.4252/wjsc.v8.i10.355


