Copyright
©The Author(s) 2015.
World J Stem Cells. May 26, 2015; 7(4): 700-710
Published online May 26, 2015. doi: 10.4252/wjsc.v7.i4.700
Published online May 26, 2015. doi: 10.4252/wjsc.v7.i4.700
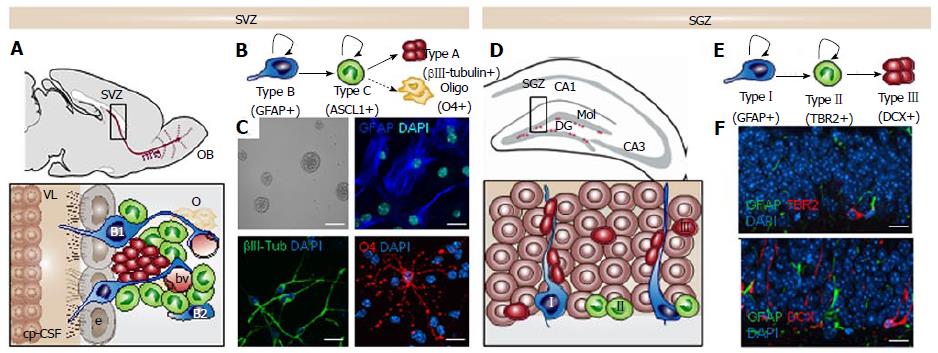
Figure 1 The neurogenic niches in the adult murine mammalian brain.
A: Sagittal view showing the adult mouse subventricular zone (SVZ) and the migrating neuroblasts (red) reaching the olfactory bulb (OB) through the rostral migratory stream (rms). Enlarged view of SVZ: type B1 stem cells (blue) express the astrocyte marker glial fibrillary acidic protein (GFAP) and contact the ventricle with a thin process extended between the ependymal cells (e; gray); type B2 stem cells (blue) contacting the brain parenchyma; transit amplyfing progenitors (TAP) or type C cells (green) express the achaete-scute homolog 1 (ASCL1) transcription factor and give rise to type A cells (red) that migrate through the rostral migratory stream (rms). Dividing stem cells and their TAP progeny are tightly opposed to blood vessels (bv); B: Schematic drawing showing the lineage progression in the SVZ; C: SVZ neural stem cell (NSC) cultures in self-renewal (neurosphere formation) and differentiation. The astrocyte marker GFAP in blue, the neuronal marker βIII-tubulin in green and the oligodendrocyte marker O4 in red; The Choroid plexus-cerebrospinal fluid system (cp-CSF) is shown. D: Coronal view showing the adult mouse subgranular zone (SGZ) and the newborn neurons (red) being integrated in the granular cell layer (gr). Enlarged view of the dentate gyrus (DG): Type I stem cells (blue) are GFAP+ and show a radial single prolongation through the granular layer; Type II precursors give rise to neuronal lineage-restricted progenitors type III cells (red) that differentiate into neurons in the granular layer; E: Schematic drawing showing the lineage progression in the SGZ; F: Confocal images showing immunostaining in the DG for the astrocyte marker GFAP in green, for the progenitor precursor marker T-box brain protein 2 (TBR2) in red and for the neuronal precursor marker Doublecortin (DCX) in red. DAPI is used to stain DNA. Scale bar in C: Top left panel 100 μm, rest 10 μm; In f: 10 μm.
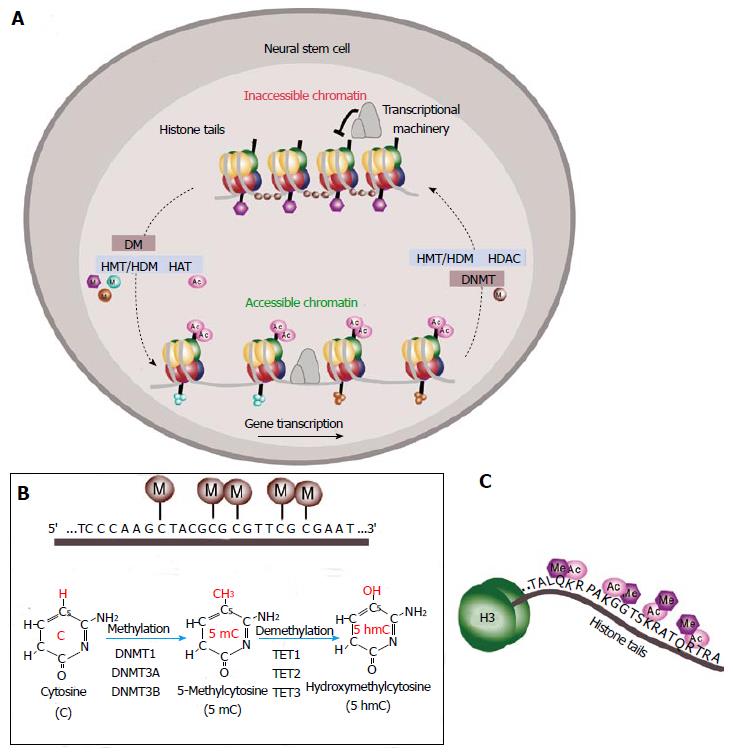
Figure 2 Epigenetic regulation of gene expression.
A: Schematic of DNA methylation and histone modifications in neural stem cells (NSCs). DNA is compressed through interactions with histones and methyl groups (M) are added to cytosine-guanine (CpGs) dinucleotides in regulatory regions. Histone methylation reactions are catalyzed by histone methyltransferases (HMTs) and the reverse process is mediated by histone demethylases (HDMs). Histone acetylation is mediated by histone acetyltransferases (HATs) that leads to chromatin decondensation (accessible chromatin) and transcription activation. Histone deacetylases (HDACs) catalyze the reverse process inducing inactivation of transcription (inaccessible chromatin); B: Schematic of DNA methylation at the cytosine-guanine dinucleotides in gene regulatory regions. Methylation reactions are mediated by DNA methyltransferases (DNMTs) that transfer methyl groups (M) to the fifth position of the pyrimidine ring. This is a reversible process mediated by the ten-eleven translocation (TET) family of enzymes TET1, TET2 and TET3 dioxygenases that catalyze the conversion of the modified genomic base 5-methylcytosine (5mC) into 5-hydroxymethylcytosine (5hmC) playing a key role in active DNA demethylation; C: Schematic of the histone tail showing multiple sites for epigenetic modifications as acetylation (Ac) or methylation (Me).
- Citation: Montalbán-Loro R, Domingo-Muelas A, Bizy A, Ferrón SR. Epigenetic regulation of stemness maintenance in the neurogenic niches. World J Stem Cells 2015; 7(4): 700-710
- URL: https://www.wjgnet.com/1948-0210/full/v7/i4/700.htm
- DOI: https://dx.doi.org/10.4252/wjsc.v7.i4.700


