Copyright
©2013 Baishideng Publishing Group Co.
World J Stem Cells. Oct 26, 2013; 5(4): 205-216
Published online Oct 26, 2013. doi: 10.4252/wjsc.v5.i4.205
Published online Oct 26, 2013. doi: 10.4252/wjsc.v5.i4.205
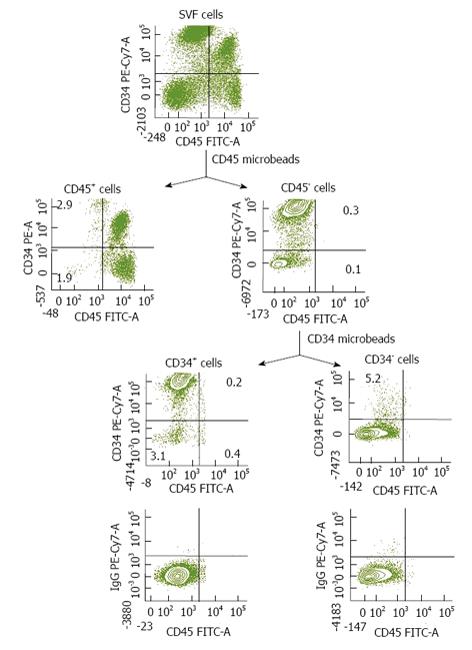
Figure 1 Purity of stromal vascular fraction populations.
Selected cell subsets from stromal vascular fraction were separated using specific monoclonal antibodies coupled to magnetic particles following magnetic cell separation technology. Representative dot plots of selected cells are shown. The numbers in the quadrants indicate the percentages of cells expressing the corresponding antigen. SVF: Stromal vascular fraction.
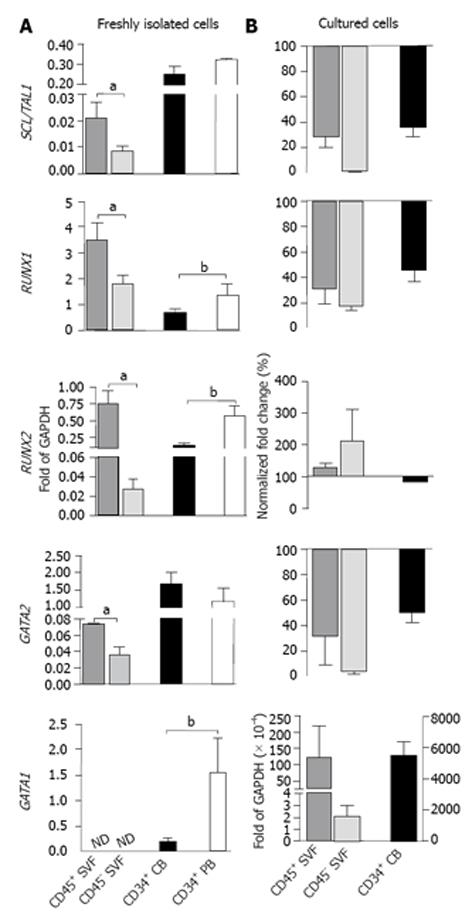
Figure 2 Hematopoietic transcription factors genes are expressed in isolated stromal vascular fraction cell populations.
A: Freshly isolated CD45+ and CD45- cells from stromal vascular fraction (SVF) and CD34+ cells from cord blood (CB) or adult peripheral blood (PB) were isolated via immunomagnetic methods and used for a gene expression analysis by reverse transcription-polymerase chain reaction (RT-PCR). The transcripts were normalized to glyceraldehyde-3-phosphate dehydrogenase (GAPDH); B: CB CD34+ cells and CD45+ and CD45- cells from the SVF were cultured in liquid serum-free medium containing early-acting cytokines for 7 d and then analyzed by RT-PCR to determine changes in the expression of selected genes. The transcripts were normalized to GAPDH, and the ratio between the gene quantity in cultured cells and the gene quantity in isolated cells was determined to yield a normalized fold change. CB CD34+ cells, n = 6-8; PB CD34+ cells, n = 3-4; SVF populations - CD45+ cells, n = 6; CD45- cells, n = 6. Levels of statistical significance: aP < 0.02, bP < 0.001. ND: Not detected. All samples were assayed in duplicate. SVF: Stromal vascular fraction; CB: Cord blood; PB: Peripheral blood; GAPD: Glyceraldehyde-3-phosphate dehydrogenase.
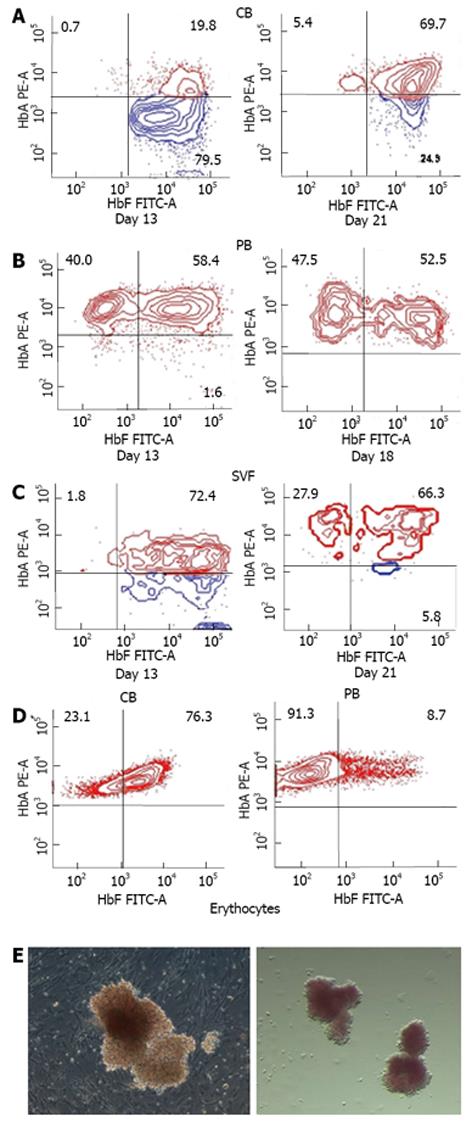
Figure 3 Representative flow cytometric dot plots of hemoglobin expression in erythroid cells.
Burst-forming units-erythroid (BFU-E)-derived colonies were analyzed for HbF and HbA expression by flow cytometry after different lengths of time in culture. Erythroid cells generated from cord blood (CB) CD34+ cells (A), from peripheral blood (PB) CD34+ cells (B), and from stromal vascular fraction (SVF) cells (C). Representative fluorescence-activated cell sorting plots showing hemoglobin expression in circulating erythrocytes from CB and PB (D). Representative phase-contrast photomicrographs showing the morphological aspect of the BFU-Es generated from CD45- (left) and CD45+(right) cells isolated from SVF (E). HbF: Fetal hemoglobin; HbA: Adult hemoglobin; CB: Cord blood; PB: Peripheral blood.
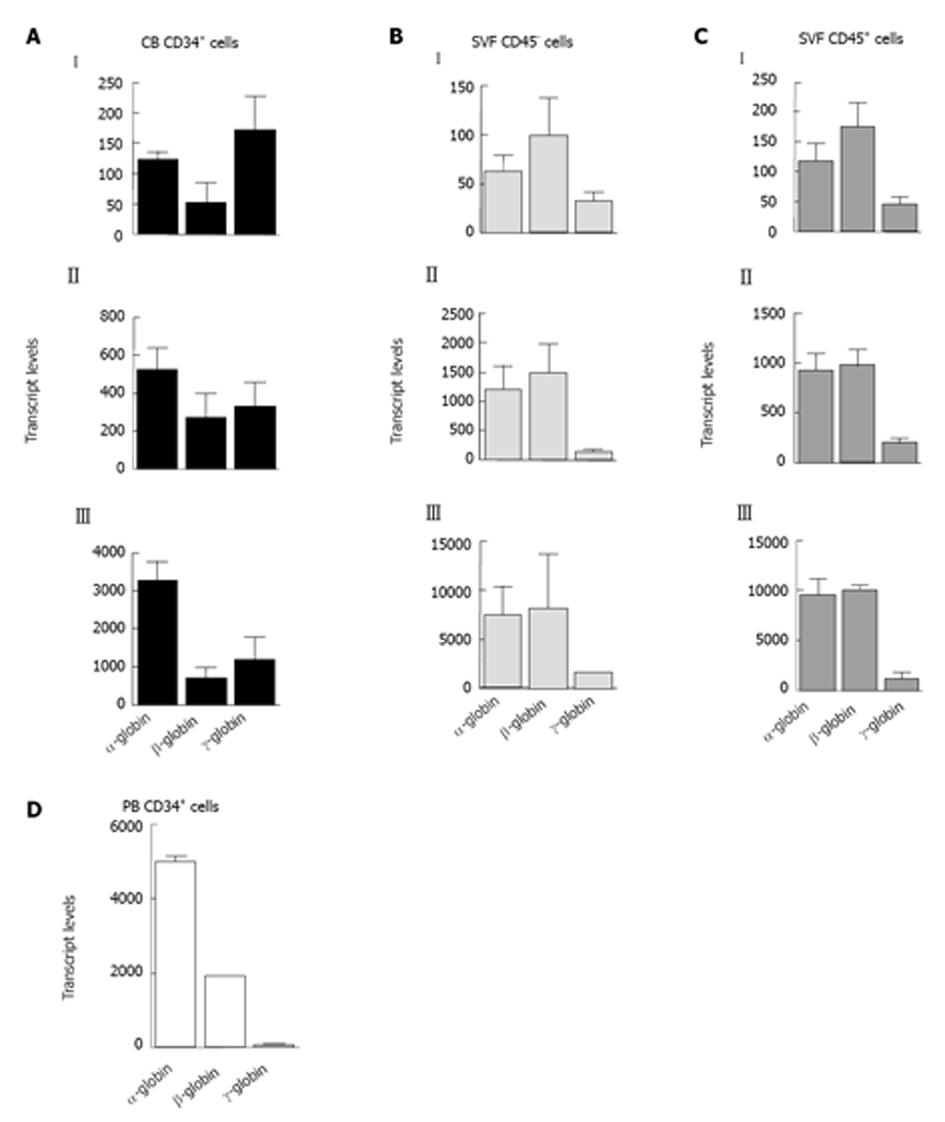
Figure 4 Analysis of globin gene expression in erythroid cells.
CD45+ and CD45- cells isolated from the stromal vascular fraction (SVF) and CD34+ cells from cord blood (CB) or adult peripheral blood (PB) were cultured in a methylcellulose-based medium, and burst-forming units-erythroid -derived erythroid cells were isolated at day 15 of culture to determine globin gene expression by reverse transcription-polymerase chain reaction. The transcripts were normalized to glyceraldehyde-3- phosphate dehydrogenase. Based on the α-globin levels, the values obtained for SVF- and CB-derived cells were placed into three groups (I, II and III). A: CB CD34+ cells, n = 10; B: SVF CD45- cells, n = 17; C: SVF CD45+ cells, n = 17; D: PB CD34+ cells, n = 4. All samples were assayed in duplicate.
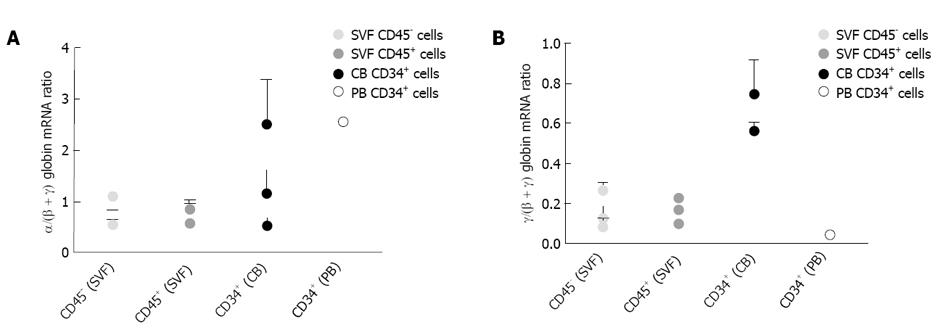
Figure 5 Ratio of α to (β + γ) and of γ to (β + γ) globin mRNA in erythroid cells.
The values of transcript levels corresponding to the samples analyzed in Figure 4 were used to calculate the α/(β + γ) globin ratios (A) and γ/(β + γ ) globin ratios (B). The results are expressed as the mean ± SE. SVF: Stromal vascular fraction; CB: Cord blood; PB: Peripheral blood.
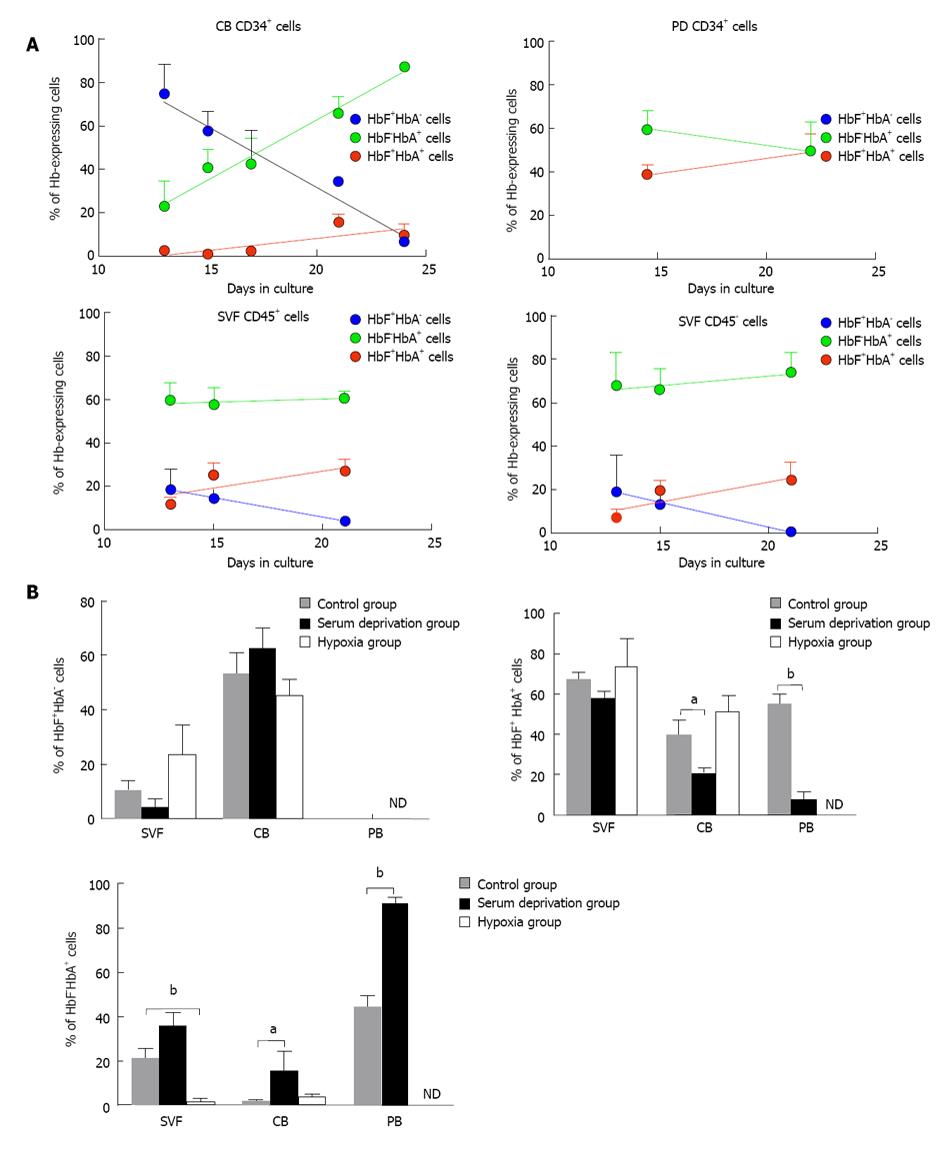
Figure 6 Effects of time and cell culture conditions on the pattern of hemoglobin expression in erythroid cells.
Individual burst-forming units-erythroid (BFU-E)-derived colonies generated in a methylcellulose-based medium were selected, pooled and analyzed for hemoglobin expression by flow cytometry. A: The kinetics of HbF+HbA- cells, HbF-HbA+ cells and HbF+HbA+ cells of erythroid cells in the different cultures over time are given. From top to bottom: erythroid cells derived from cord blood (CB) CD34+ cells, from peripheral blood (PB) CD34+ cells, from stromal vascular fraction (SVF) CD45+ cells and from SVF CD45- cells. The results are expressed as the percentage of total Hb-expressing cells (CB CD34+ cells, n = 7; PB CD34+ cells, n = 4; SVF CD45+ cells, n = 10 and SVF CD45+cells, n = 10). The data are provided as the means ± SE; B: A parallel series of cultures were performed to examine the effect of serum deprivation and hypoxia (5% O2) on hemoglobin expression. Control cultures were grown under conditions of normoxia (20% O2) using a serum-containing medium. SVF cells, n = 10; CB CD34+ cells, n = 10; PB CD34+ cells, n = 4. BFU-E-derived erythroid cells were analyzed by flow cytometry for hemoglobin composition at day 15 of culture. The results are expressed as the percentage of total Hb-expressing cells. The data are provided as the mean ± SE. aP < 0.02, aP < 0.0001. ND: Not detected. CB: Cord blood; PB: Peripheral blood; SVF: Stromal vascular fraction.
- Citation: Navarro A, Carbonell-Uberos F, Marín S, Miñana MD. Human adipose tissue contains erythroid progenitors expressing fetal hemoglobin. World J Stem Cells 2013; 5(4): 205-216
- URL: https://www.wjgnet.com/1948-0210/full/v5/i4/205.htm
- DOI: https://dx.doi.org/10.4252/wjsc.v5.i4.205


