Copyright
©2012 Baishideng.
World J Stem Cells. Aug 26, 2012; 4(8): 87-93
Published online Aug 26, 2012. doi: 10.4252/wjsc.v4.i8.87
Published online Aug 26, 2012. doi: 10.4252/wjsc.v4.i8.87
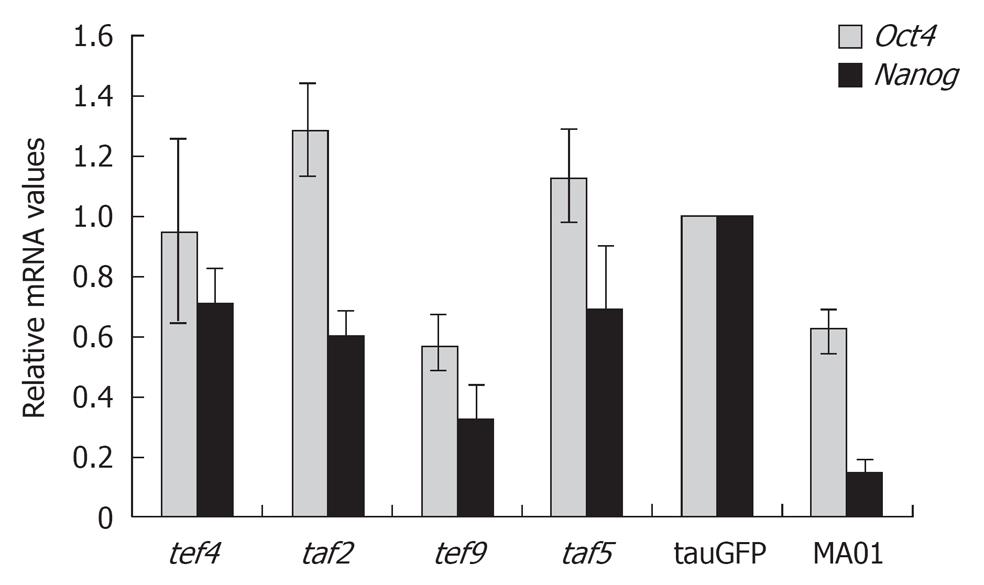
Figure 1 Relative expression levels of the pluripotency markers, Oct4 and Nanog, in embryonic stem cell lines tauGFP and MA01 and in the hybrid cell clones tef4, taf2, tef9, and taf5.
The values from tauGFP embryonic stem cells were set at 1.
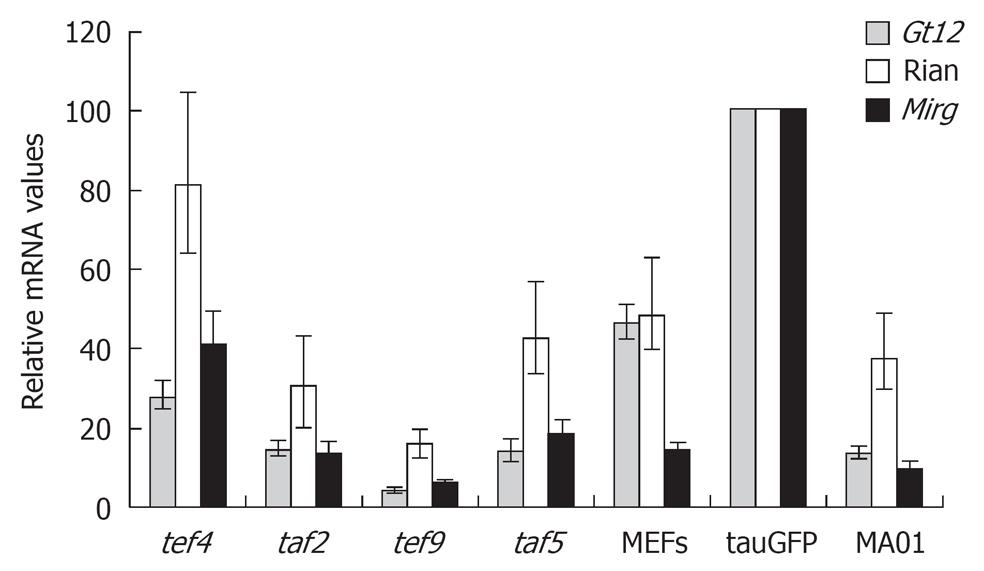
Figure 2 Relative expression levels of the maternally imprinted genes Gtl2, Rian, and Mirg in the tef4, taf2, tef9, and taf5 hybrid clones, tauGFP and MA01 embryonic stem cell lines, and MEFs.
The values from tauGFP embryonic stem cells were set at 1.
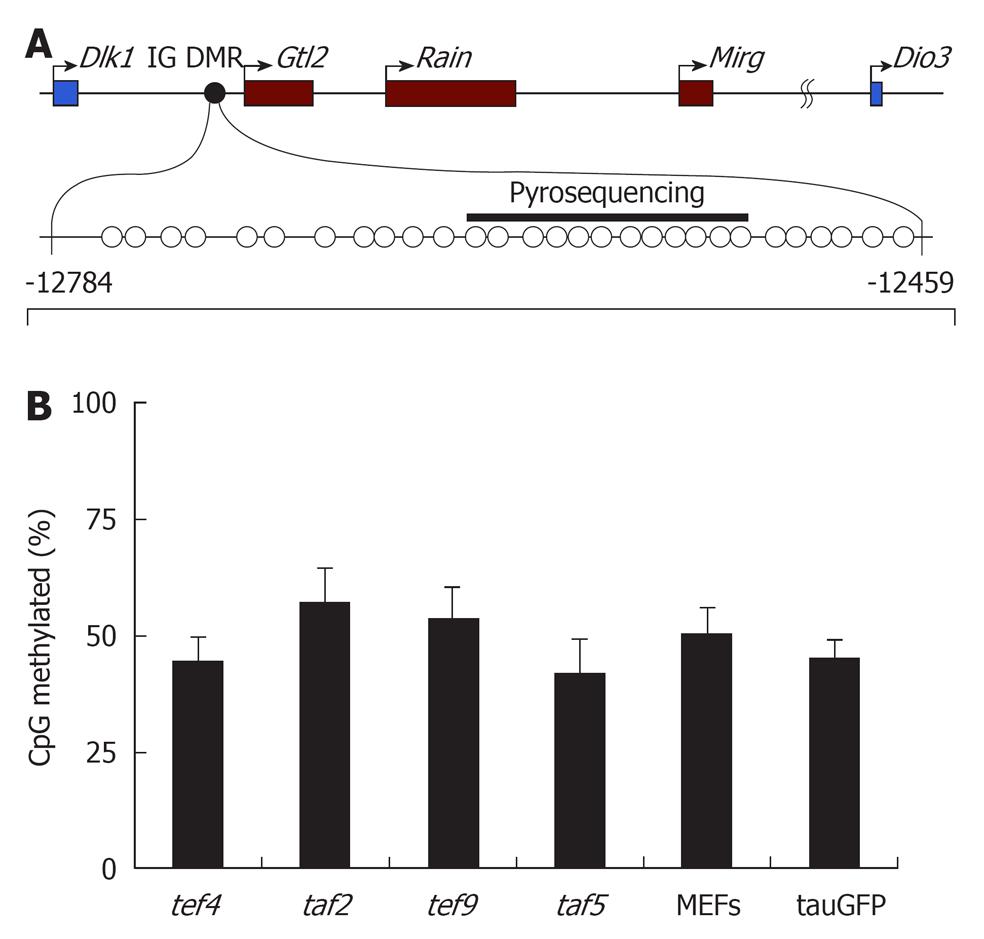
Figure 3 DNA methylation of intergenic differentially methylated region in embryonic stem cells (tauGFP), MEFs, tef4, taf2, tef9, and taf5.
(A) Structure of the Dlk1-Dio3 locus with the position of the intergenic differentially methylated region (IG DMR) analyzed by bisulfite sequencing (CpGs indicated by circles) and pyrosequencing (indicated by black bar). Numbers indicate position relative to the Gtl2 transcription start site; (B) Percentage of DNA methylation of CpG-sites within IG DMR in tef4, taf2, tef9, and taf5 hybrid clones, as well as parental tauGFP embryonic stem (ES) cells (ESC) and fibroblasts (MEFs), based on the data of pyrosequencung.
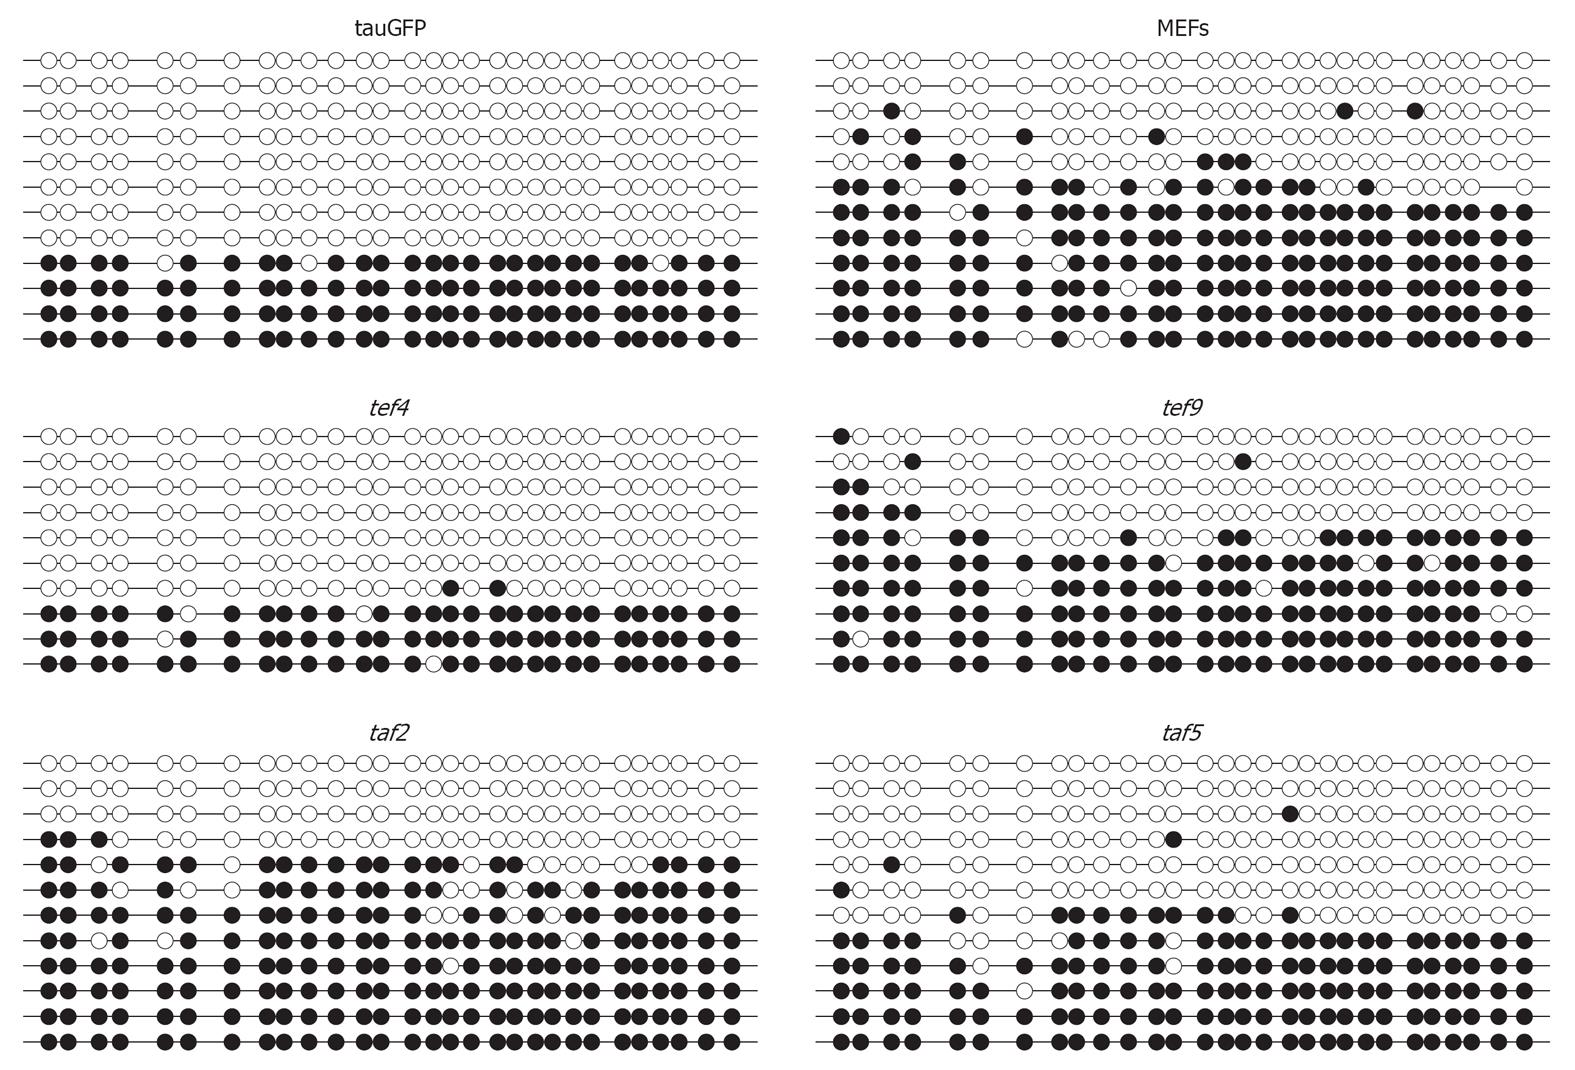
Figure 4 Representations of the DNA methylation profiles of the intergenic differentially methylated region in embryonic stem cells (tauGFP), MEFs, and four hybrid clones, based on the data of bisulfite analysis.
Methylation status of CpG-sites is depicted by open circles (unmethylated) and closed circles (methylated).
-
Citation: Battulin NR, Khabarova AA, Boyarskikh UA, Menzorov AG, Filipenko ML, Serov OL. Reprogramming somatic cells by fusion with embryonic stem cells does not cause silencing of the
Dlk1-Dio3 region in mice. World J Stem Cells 2012; 4(8): 87-93 - URL: https://www.wjgnet.com/1948-0210/full/v4/i8/87.htm
- DOI: https://dx.doi.org/10.4252/wjsc.v4.i8.87


