Copyright
©2012 Baishideng.
World J Stem Cells. Jun 26, 2012; 4(6): 53-61
Published online Jun 26, 2012. doi: 10.4252/wjsc.v4.i6.53
Published online Jun 26, 2012. doi: 10.4252/wjsc.v4.i6.53
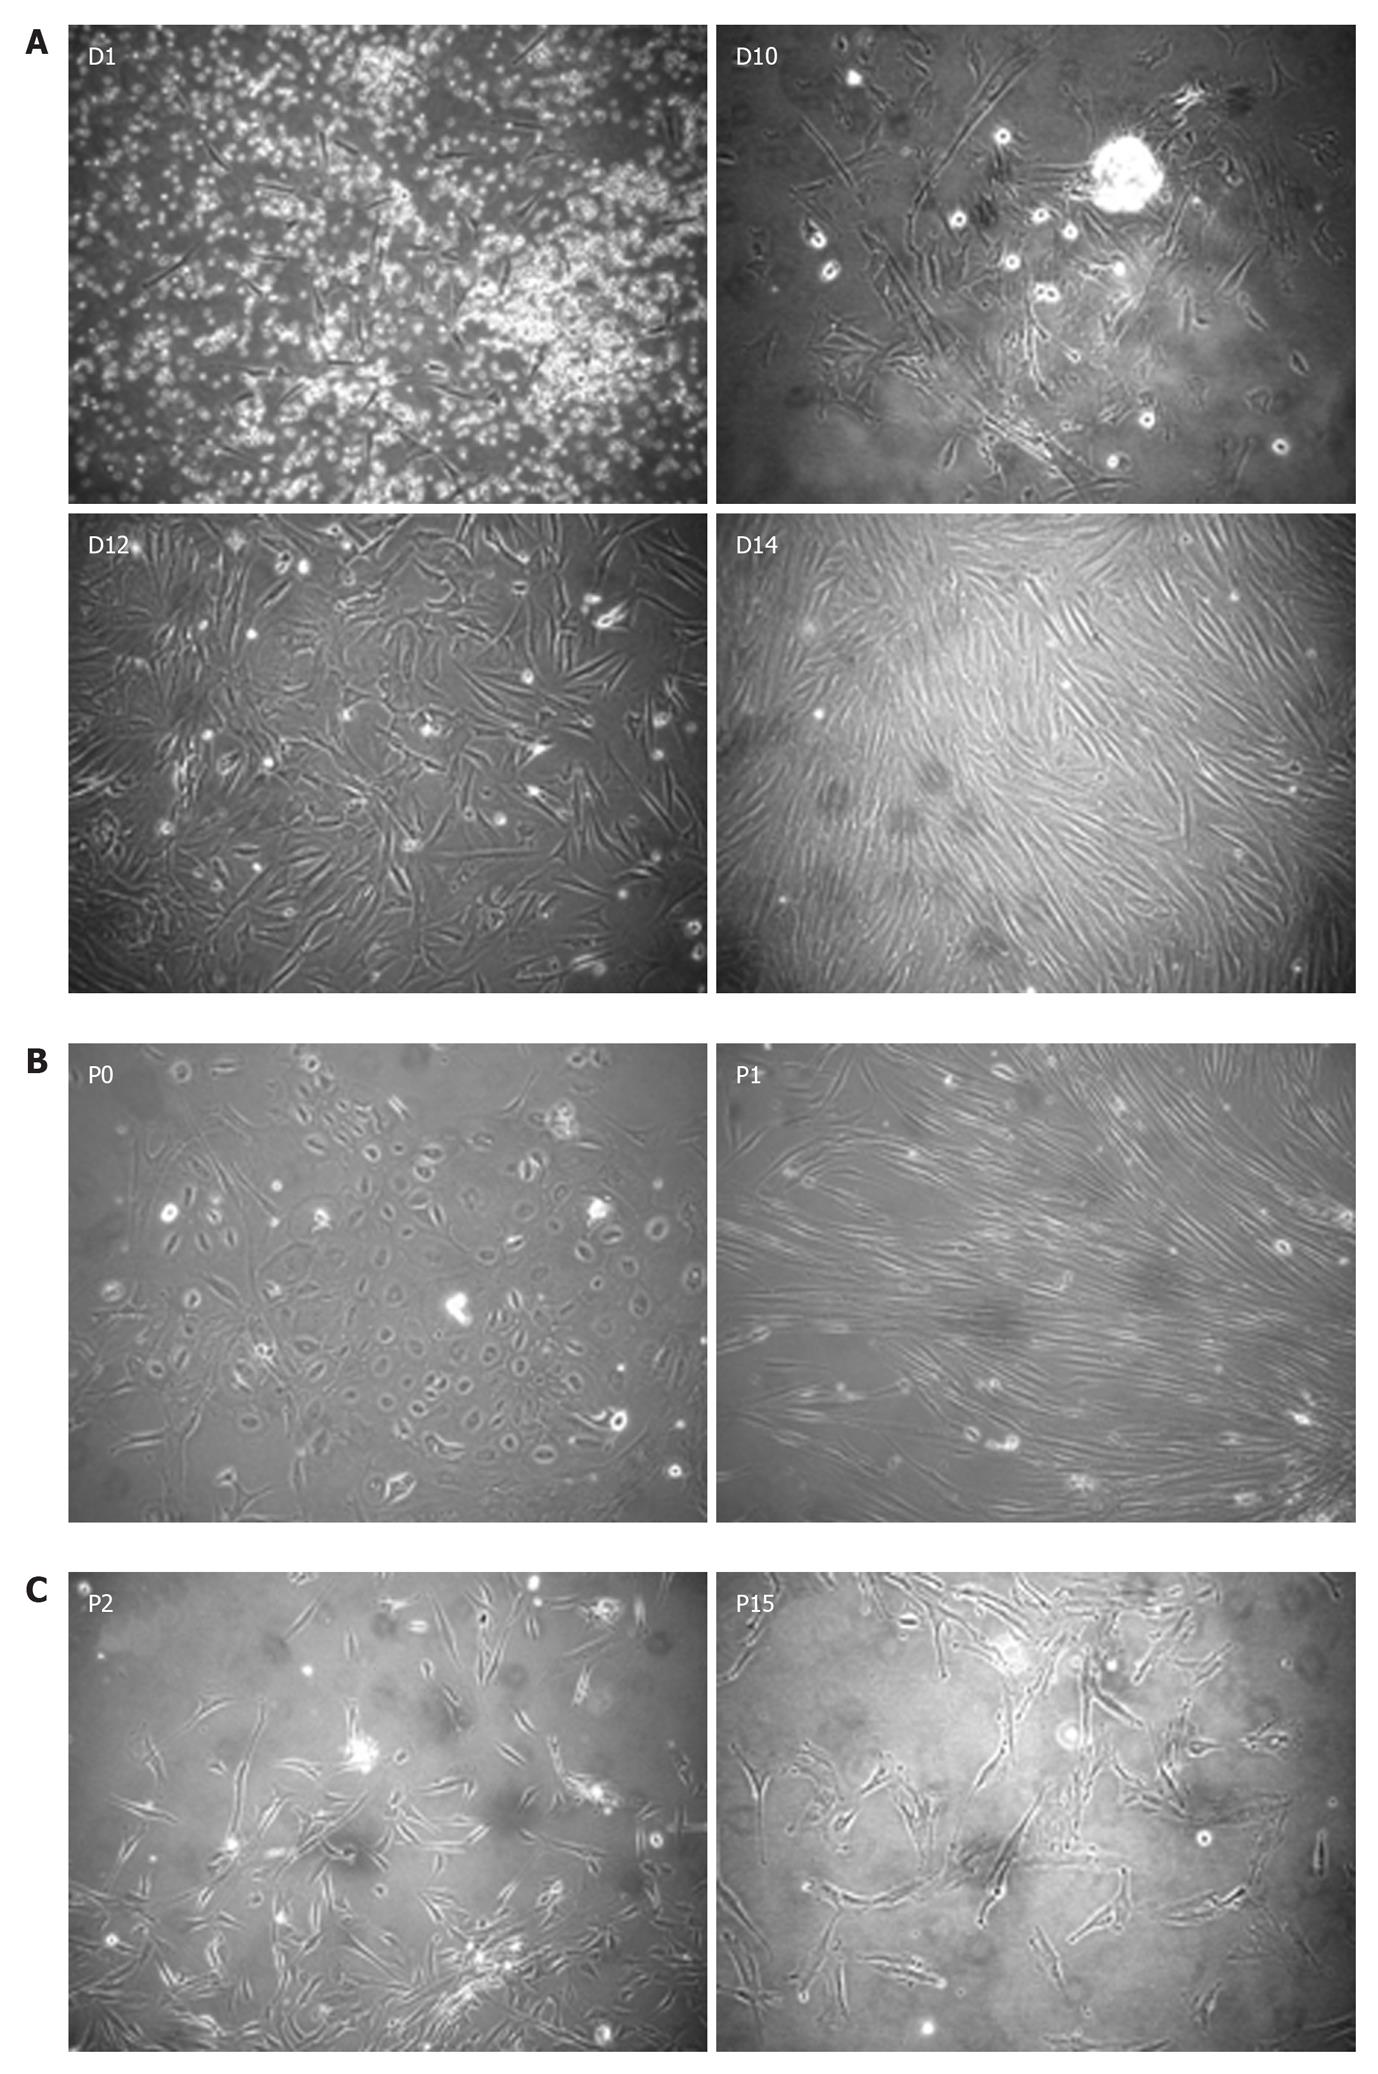
Figure 1 Morphology of placenta mesenchymal stem cells primary cultures.
A: The formation of heterogeneous populations of placenta mesenchymal stem cells (PLC-MSC) with fibroblastic and epithelioid morphologies at passage 0, P0 until confluence at day 14; B: Homogenous population of PLC-MSC at P1; Disappearance of the epitheloid population and appearance of fibroblast-like cells upon trypsinisation and passaging; C: Comparison of early and late passages of primary MSC cultures (C). Photomicrographs taken using phase contrast microscope at magnification 100 ×.
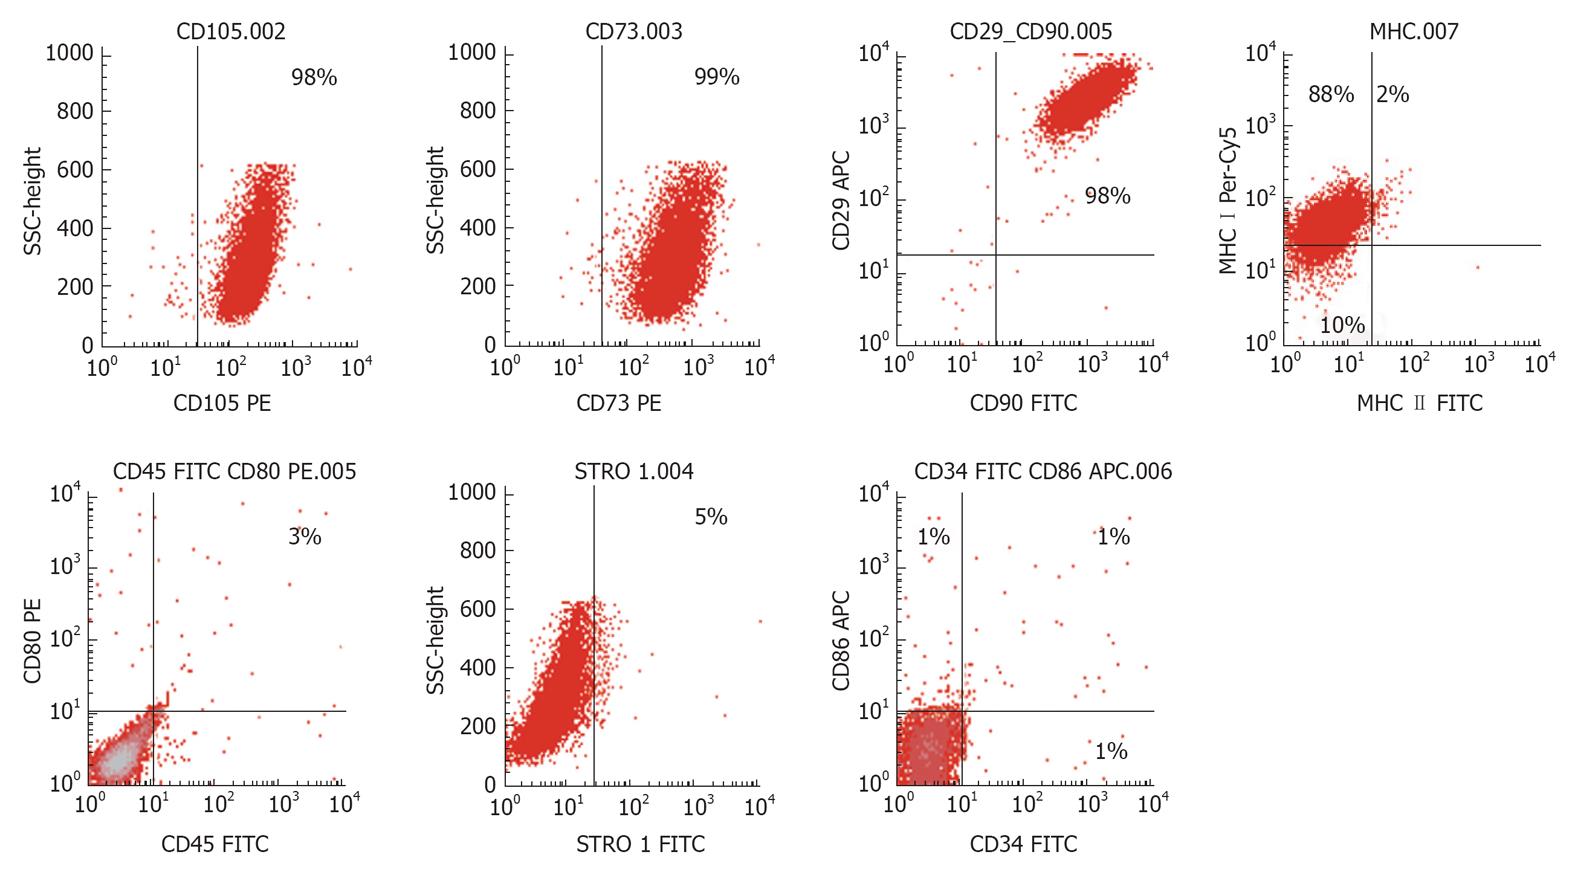
Figure 2 Immunophenotyping of placenta mesenchymal stem cells by flow cytometry.
Adherent placenta mesenchymal stem cells (MSC) were harvested upon confluence and stained for MSC cell surface markers using a panel of anti human antibodies. Results represent at least 3 experiments.
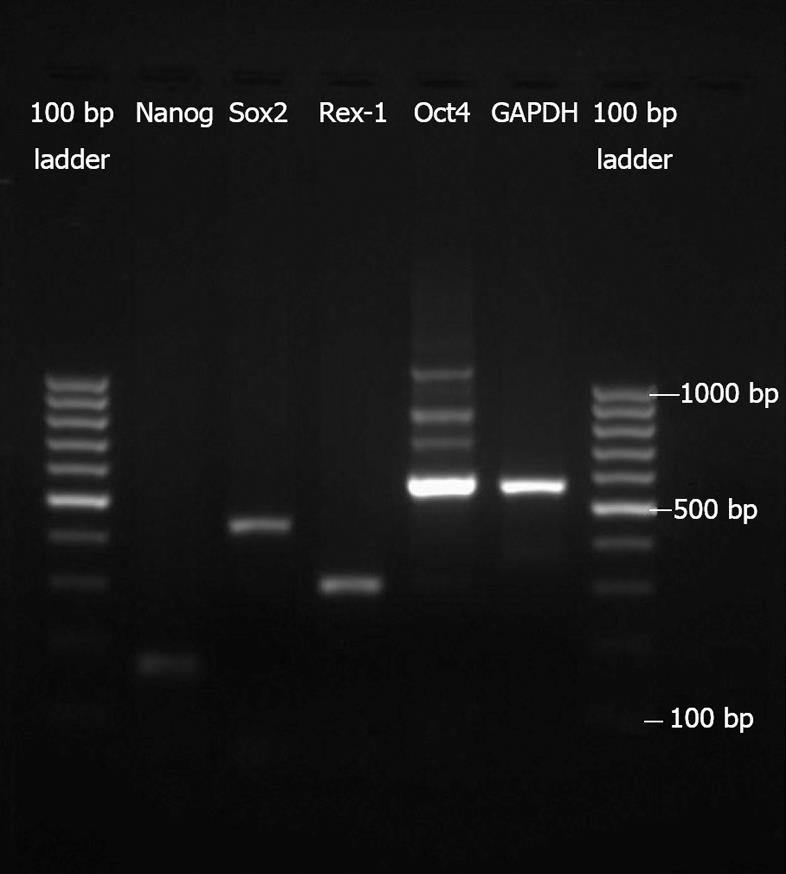
Figure 3 Gene expression by reverse transcription-polymerase chain reaction of placenta mesenchymal stem cells.
Placenta mesenchymal stem cells express markers of embryonic stem cell transcriptional factors such as Nanog, Sox2, Rex-1 and Oct4. GAPDH was used as a reference gene. 100 bp DNA ladder was used as a marker.
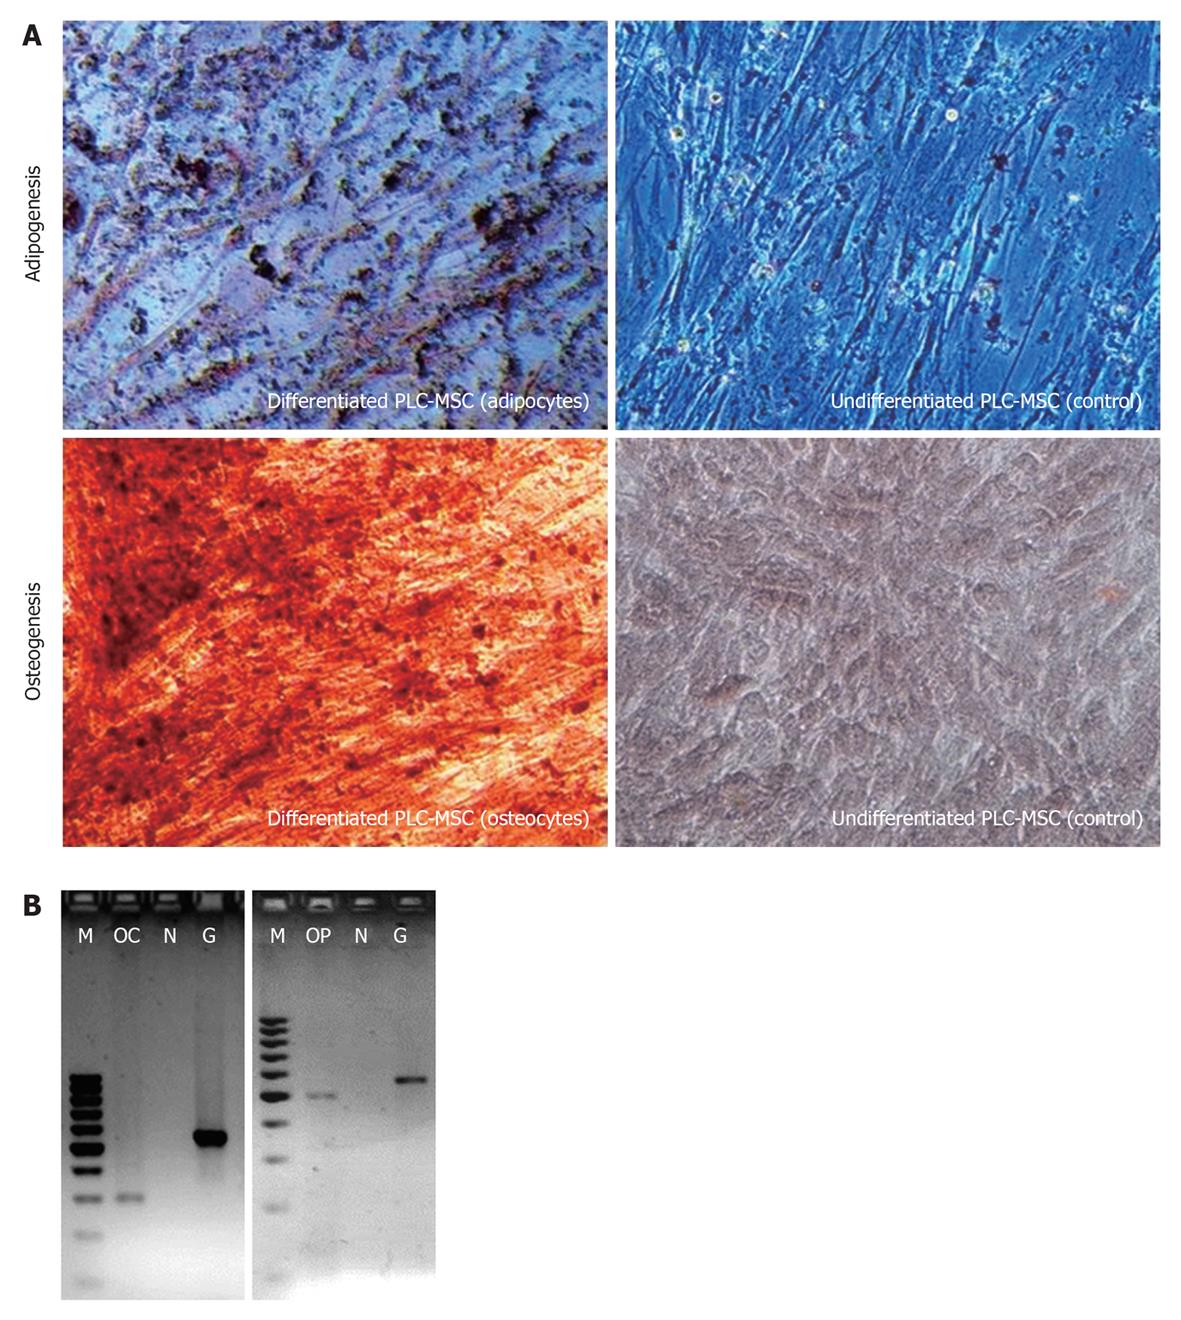
Figure 4 Differentiation potential of placenta mesenchymal stem cells into mesodermal lineages.
A: Placenta MSC (PLC-MSC) after 3 wk in adipogenic or osteogenic or normal cell culture medium. Formation of lipid droplets (stained red in Oil-Red-O), calcium deposition (stained orangy-red in Alizarin Red) and formation of proteoglycans (stained blue in Alcian Blue) confirms the ability to differentiate into mesodermal lineages. The picture was taken using phase contrast microscope at 100 × magnification. B: PLC-MSC differentiated into osteocytes expresses Osteocalcin (OC) and Osteopontin (OP) (data from two independent experiments). M: 100 bp DNA ladder; N: Non template control as negative control; C: Control-undifferentiated PLC-MSC; G1: GAPDH for differentiated PLC-MSC; G2: GAPDH for control.
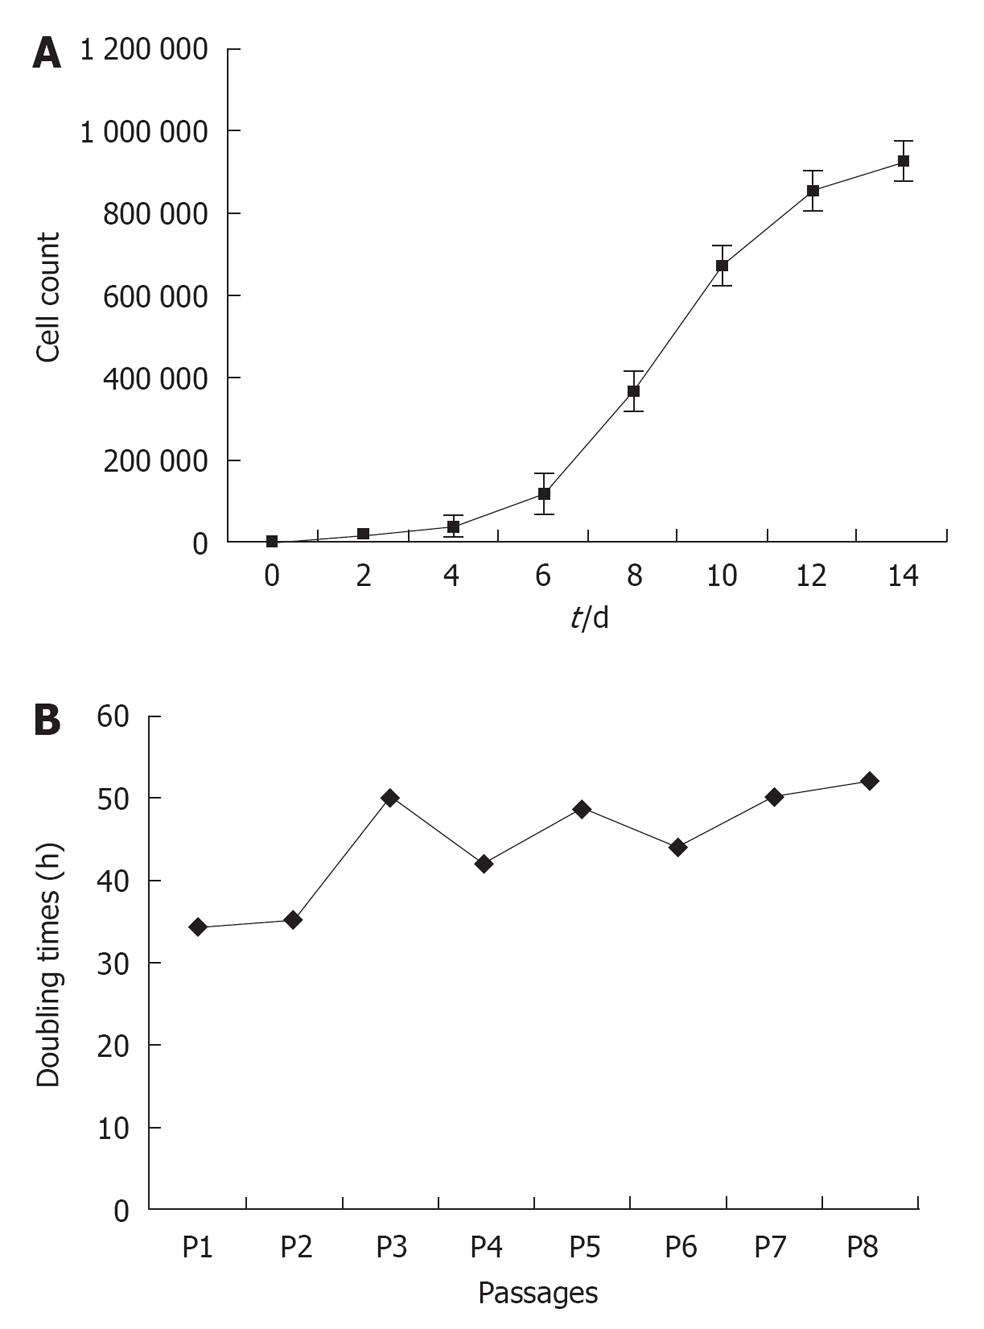
Figure 5 Growth Kinetics of placenta mesenchymal stem cells.
Placenta mesenchymal stem cells (PLC-MSC) (4000 cells/well) were plated in 6 well plates and medium was changed three times a week. A: Triplicate cultures were harvested for trypan blue exclusion cell count every 2 d; B: Doubling time of PLC-MSC was measured at every passage (B). Average doubling time PLC-MSC was 41 h. Figure 5 is representative of 3 individual experiments with ± SD, results considered significant at P < 0.05.
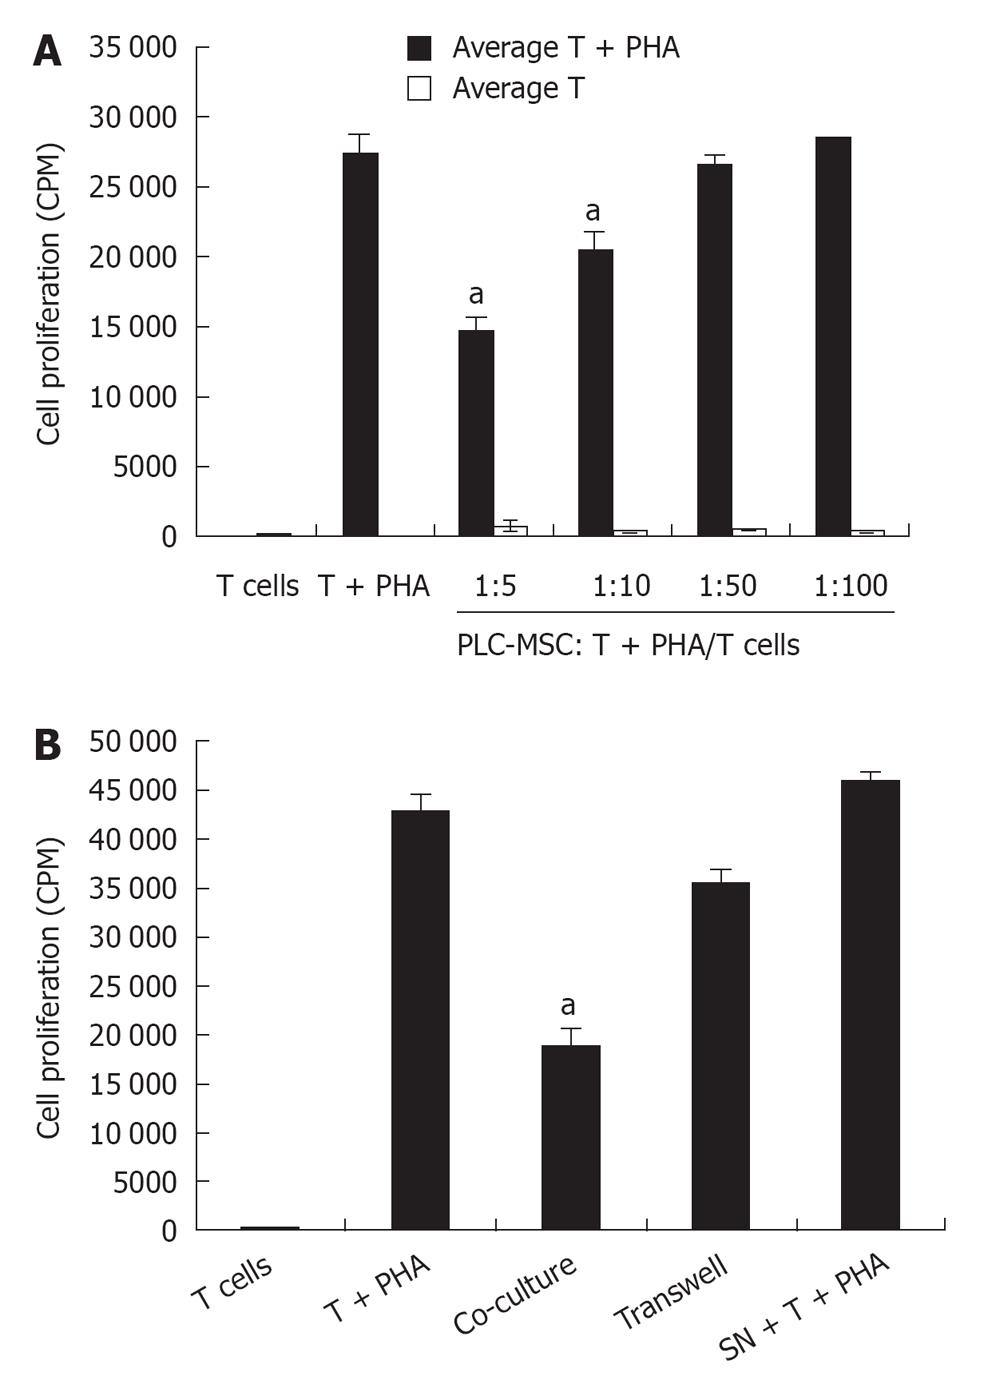
Figure 6 Dose dependent inhibitory effect of placenta mesenchymal stem cells on phytohemagglutinin stimulated PBMC via cell to cell contact.
A: Peripheral blood mononuclear cells (5 × 10⁵ cells) with or without phytohemagglutinin (PHA) stimulation were co-cultured with various ratios of placenta mesenchymal stem cells (PLC-MSC) and incubated for 72 h. For the final 18 h of the culture, tritium thymidine (3H-TdR) was pulsed into the wells. PLC-MSC failed to stimulate proliferation of resting T cells but PLC-MSC inhibited activated T cells proliferation in a dose dependent mechanism; B: PBMC (2 × 10⁶) stimulated with PHA were also co-cultured with 2 × 10⁵ PLC-MSC (direct and indirect contact) and MSC conditioned media in a 12 well plate. T cells were harvested after 48 h of incubation, plated in 96-well plates and proliferation was measured by 3H-TdR on day 3. This result represents the average percentage of T cell proliferation ± SD of 3 repeated experiments. aP < 0.05 vs positive control (T + PHA).
- Citation: Vellasamy S, Sandrasaigaran P, Vidyadaran S, George E, Ramasamy R. Isolation and characterisation of mesenchymal stem cells derived from human placenta tissue. World J Stem Cells 2012; 4(6): 53-61
- URL: https://www.wjgnet.com/1948-0210/full/v4/i6/53.htm
- DOI: https://dx.doi.org/10.4252/wjsc.v4.i6.53


