Copyright
©2011 Baishideng Publishing Group Co.
World J Stem Cells. Aug 26, 2011; 3(8): 70-82
Published online Aug 26, 2011. doi: 10.4252/wjsc.v3.i8.70
Published online Aug 26, 2011. doi: 10.4252/wjsc.v3.i8.70
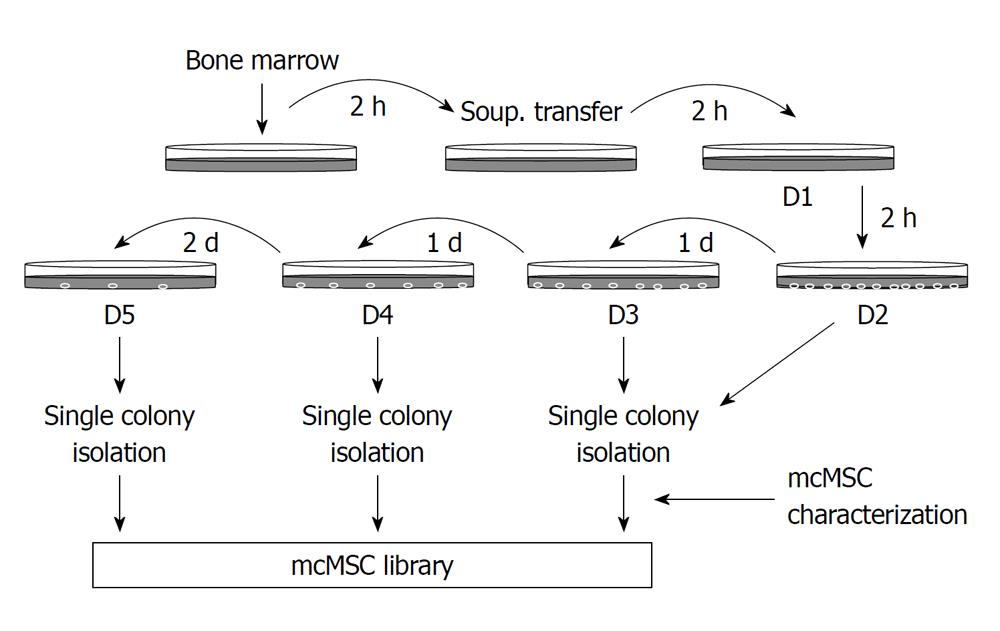
Figure 1 Flow diagram of the “subfractionation culturing method” used to establish mouse clonal mesenchymal stem cell lines.
Mouse bone marrow aspirate was mixed with Dulbecco’s modified Eagle’s Medium-low glucose and plated onto a 100-mm cell culture dish. After 2-h incubation, the supernatant only was transferred to a new dish. This procedure was repeated two more times, and then the supernatant was subsequently transferred to cell culture dishes with a 1- or 2-d interval as shown. Each dish was then incubated until single-cell-derived colonies appeared. When colonies of cells were large enough, they were transferred to a six-well plate or 100-mm cell culture dish and then expanded to larger flasks for freezing and further study. Unique mouse clonal mesenchymal stem cell (mcMSC) lines were saved in a mcMSC library.
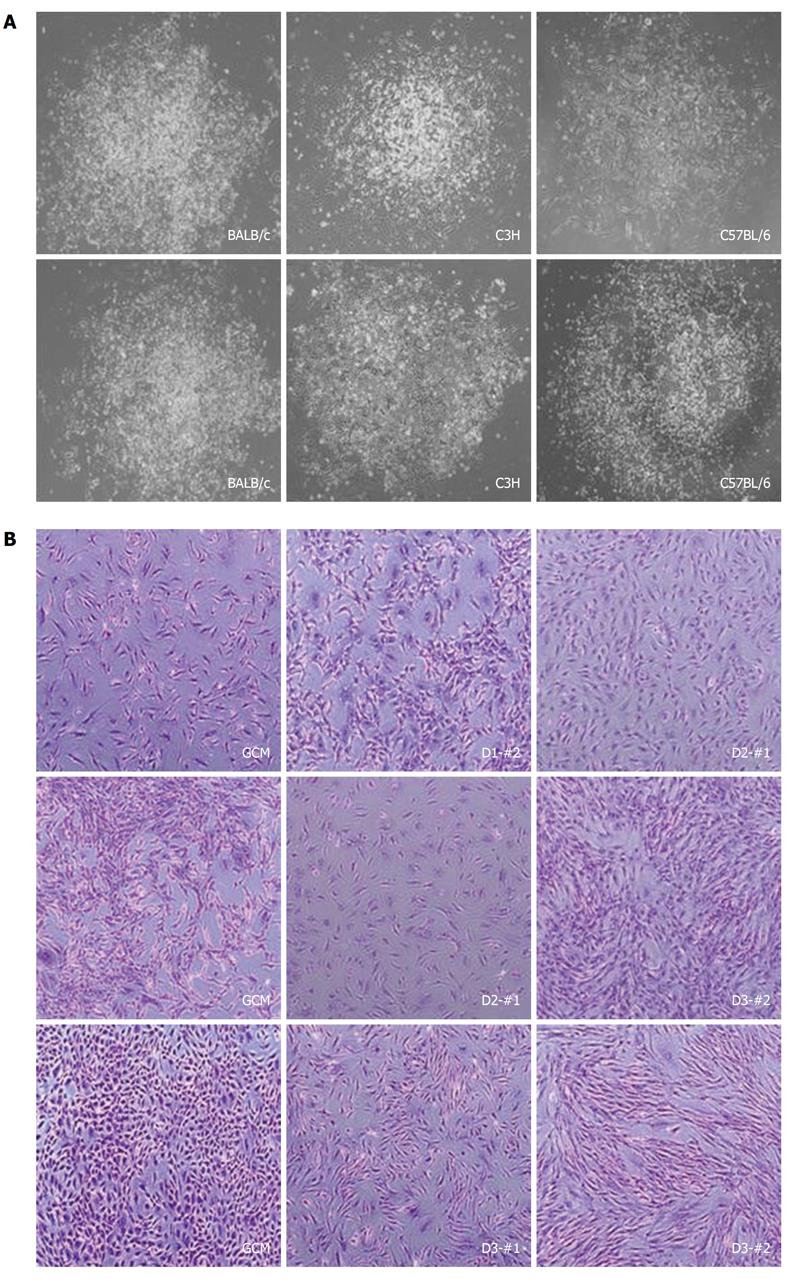
Figure 2 Pictures of the individual colonies and cell morphology of the established mouse clonal mesenchymal stem cell lines.
A: Representative pictures of single colonies obtained from different strains; B: Pictures of mouse clonal mesenchymal stem cells (mcMSCs) established from single colonies at about 70%-80% confluence. Nonclonal MSCs isolated by the conventional method, labeled as the gradient centrifugation method, from the three strains are also shown. Every mcMSCs in the right panel have a fibroblast-like morphology. The cells were fixed with 4% paraformaldehyde for 10 min and stained with 0.1% crystal violet for 5 min. Magnification: 100 ×.
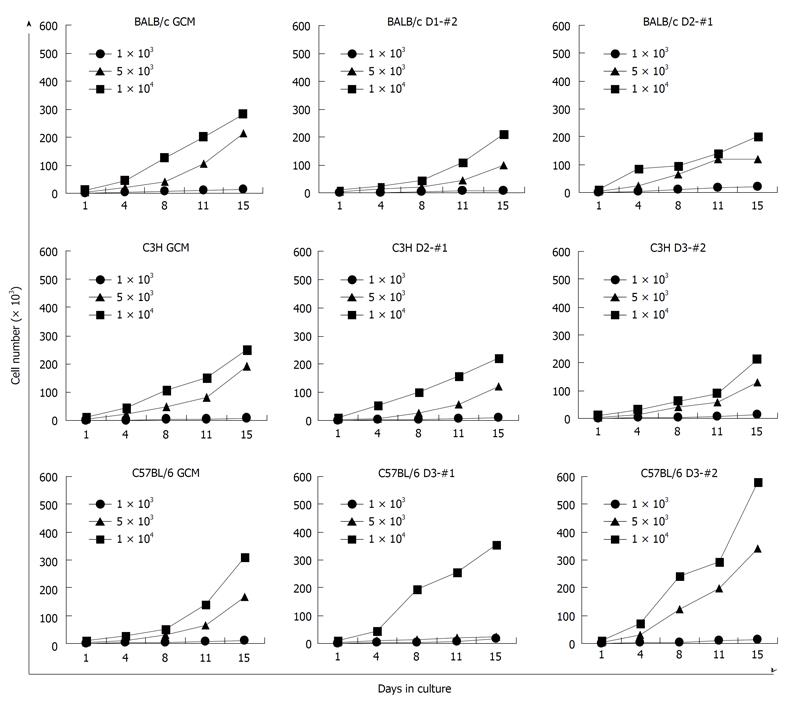
Figure 3 Cell growth of the established mouse clonal mesenchymal stem cell lines and nonclonal mesenchymal stem cells.
Cells were plated at 1 × 10³, 5 × 10³, or 1 × 10⁴ cells in a 60-mm dish and incubated in Dulbecco’s modified Eagle’s Medium-low glucose. Cells were trypsinized by incubation with trypsin/ethylene diamine tetraacetic acid and counted twice a week with a haemocytometer for 15 d. GCM: Gradient centrifugation method.
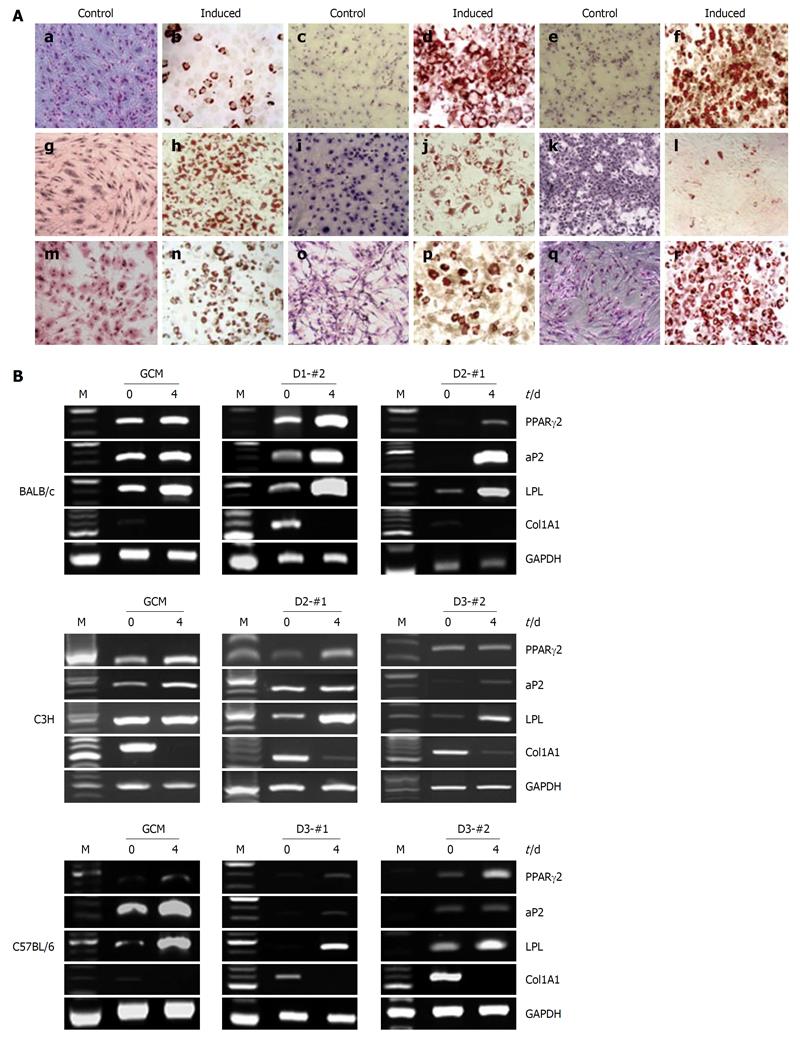
Figure 4 Adipogenic differentiation potential of the established mouse clonal mesenchymal stem cell lines and nonclonal mesenchymal stem cells.
A: Oil-red-O staining showed that adipogenically differentiated mouse clonal mesenchymal stem cell lines were positive, tested 4 d after adipogenic induction: a and b: BALB/c gradient centrifugation method (GCM); c and d: BALB/c D1-#2; e and f: BALB/c D2-#1; g and h: C3H GCM; i and j: C3H D2-#1; k and l: C3H D3-#2; m and n: C57BL/6 GCM; o and p: C57BL/6 D3-#1; q and r: C57BL/6 D3-#2; B: Reverse transcriptase-polymerase chain reaction analysis of the adipogenic markers peroxisome proliferator-activated receptor γ2 (PPARγ2), fatty acid-binding protein 4, lipoprotein lipase (LPL), and Col1A1 at days 0 and 4 after adipogenic induction. glyceraldehyde phosphate dehydrogenase was used as an internal control.
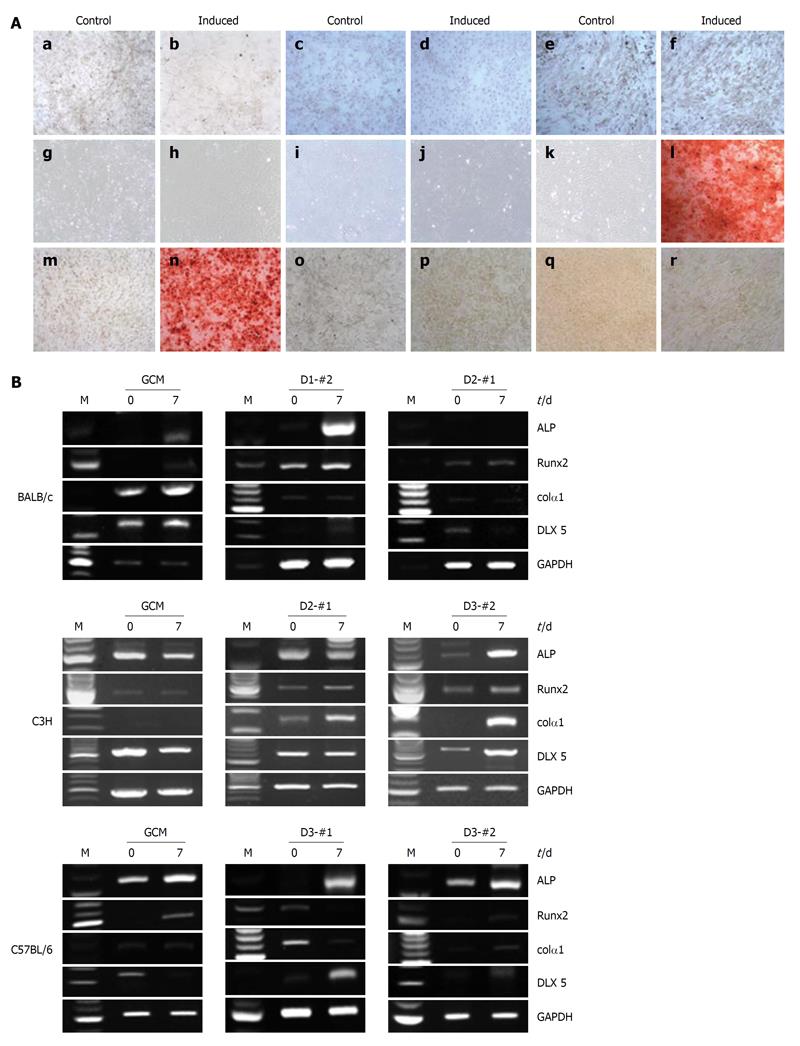
Figure 5 Osteogenic differentiation potentials of the established mouse clonal mesenchymal stem cell lines and nonclonal mesenchymal stem cells.
A: Alizarin Red S staining showed matrix mineralization in the osteogenically differentiated mouse clonal mesenchymal stem cell lines 21 d after osteogenic induction: a and b: BALB/c gradient centrifugation method (GCM); c and d: BALB/c D1-#2; e and f: BALB/c D2-#1; g and h: C3H GCM; i and j: C3H D2-#1; k and l: C3H D3-#2; m and n: C57BL/6 GCM; o and p: C57BL/6 D3-#1; q and r: C57BL/6 D3-#2; B: Reverse transcriptase-polymerase chain reaction analysis of osteogenic markers, alkaline phosphatase (ALP), Runx-2, Col1A1, and Distal-less homeobox 5 at days 0 and 7 after osteogenic induction. Glyceraldehyde phosphate dehydrogenase was used as an internal control.
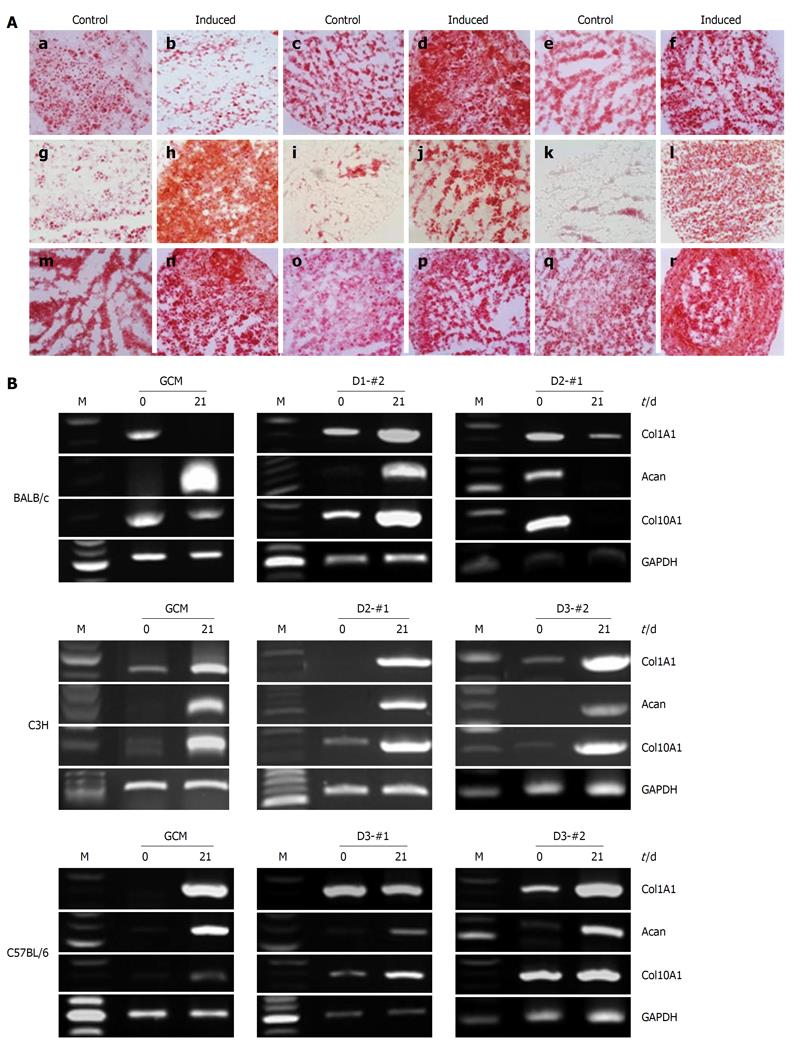
Figure 6 Chondrogenic differentiation potential of the established mouse clonal mesenchymal stem cell lines and nonclonal mesenchymal stem cells.
A: Histochemical staining with Safranin-O showed chondrogenically differentiated mouse clonal mesenchymal stem cell lines, tested 21 d after chondrogenic induction: a and b: BALB/c gradient centrifugation method (GCM); c and d: BALB/c D1-#2; e and f: BALB/c D2-#1; g and h: C3H GCM; i and j: C3H D2-#1; k and l: C3H D3-#2; m and n: C57BL/6 GCM; o and p: C57BL/6 D3-#1; q and r: C57BL/6 D3-#2; B: Reverse transcriptase-polymerase chain reaction analysis of chondrogenic markers, type II collagen, aggrecan, and type X collagen at days 0 and 21 after chondrogenic induction. Glyceraldehyde phosphate dehydrogenase was used as an internal control.
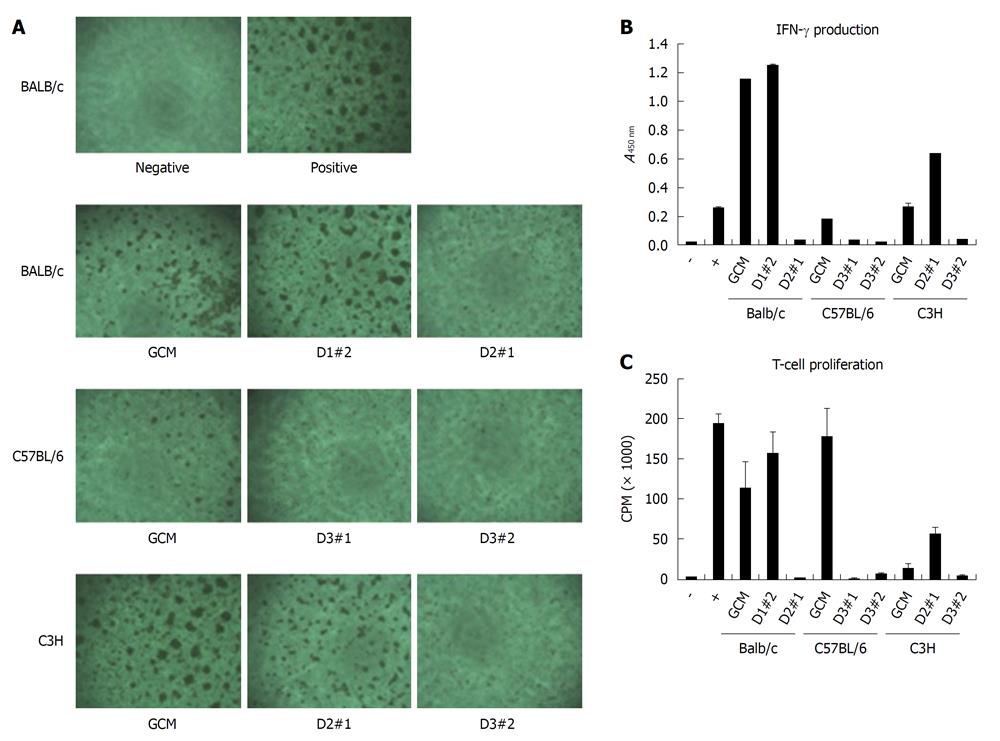
Figure 7 Immunosuppressive effect of mouse clonal mesenchymal stem cell lines or nonclonal mesenchymal stem cells on T cells.
Splenocytes (2 × 10⁵) from BALB/c were stimulated with soluble anti-CD3 (1 μg/mL) and anti-CD28 (1 μg/mL) in the presence of 1 × 10⁴ different mesenchymal stem cells. A: After 48 h, T-cell receptor-activated T-cell clusters were observed by microscopy; B: Interferon (IFN)-γ production was determined by ELISA; C: T-cell proliferation was determined by [3H]-thymidine incorporation after 3 d culture. GCM: Gradient centrifugation method.
- Citation: Jeon MS, Yi TG, Lim HJ, Moon SH, Lee MH, Kang JS, Kim CS, Lee DH, Song SU. Characterization of mouse clonal mesenchymal stem cell lines established by subfractionation culturing method. World J Stem Cells 2011; 3(8): 70-82
- URL: https://www.wjgnet.com/1948-0210/full/v3/i8/70.htm
- DOI: https://dx.doi.org/10.4252/wjsc.v3.i8.70


