Copyright
©2011 Baishideng Publishing Group Co.
World J Stem Cells. Apr 26, 2011; 3(4): 34-42
Published online Apr 26, 2011. doi: 10.4252/wjsc.v3.i4.34
Published online Apr 26, 2011. doi: 10.4252/wjsc.v3.i4.34
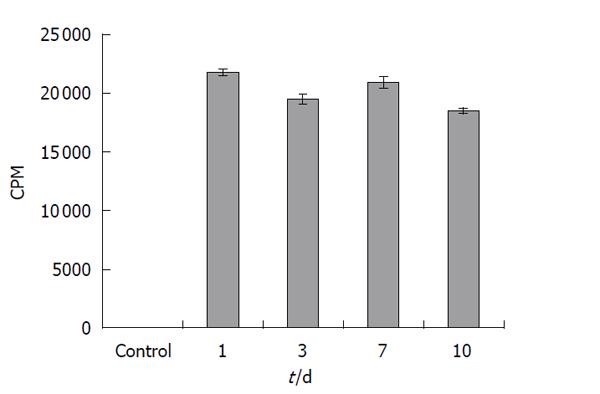
Figure 1 Retention of tritiated thymidine in human umbilical cord matrix stem cells in vitro.
Human umbilical cord matrix stem cells were radiolabeled by incubating 1 × 10⁶ cells with 1 μCi tritiated thymidine for 24 h followed by washing with 1 × PBS and kept in the growth medium without tritiated thymidine. Retention of radioactivity was measured on days 1, 3, 7 and 10 post-labeling.
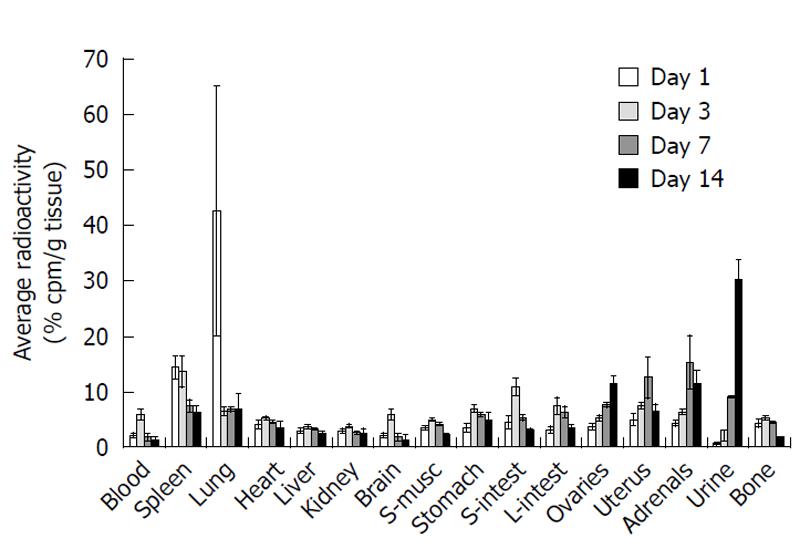
Figure 2 Average tissue distribution of radiolabeled human umbilical cord matrix stem cells 1 d (white bars), 3 d (light grey bars), 7 d (dark grey bars) and 14 d (black bars) after the cell injection.
Mice were injected through a lateral tail vein with 5 × 10⁵ human umbilical cord matrix stem cells labeled with tritiated thymidine and sacrificed 1, 3, 7, and 14 d after the injection. All tissues were individually dissected and homogenized with 9-20 volumes of 1 × PBS. Radioactivity was measured in duplicate determinations as described in the Methods. All presented data are normalized by subtracting non-specific radioactivity from respective control tissues and presented as mean ± SE. Data are expressed as% average activity per gram tissue.
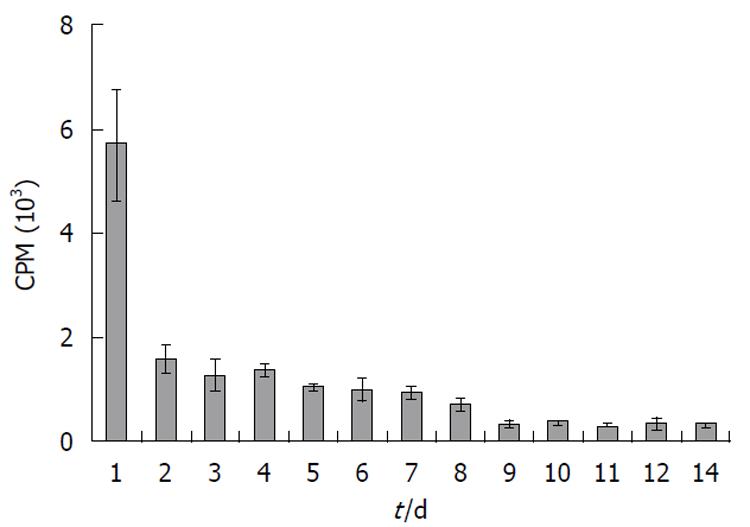
Figure 3 Amount of urinary excretion of radioactivity.
After injection of radiolabeled human umbilical cord matrix stem cells urine was collected daily and excretion of radioactivity in urine was determined. The excretion levels are normalized by urine volume and expressed as total radioactivity/day/mouse.
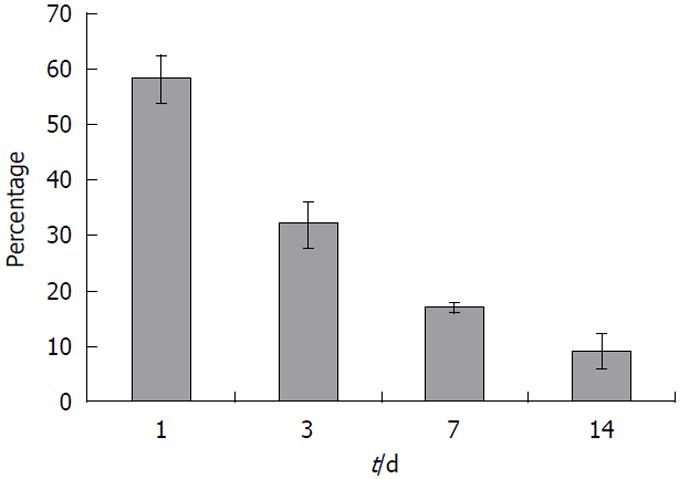
Figure 4 Percentage of radioactivity recovered on different days.
Amount of radioactivity detected in different tissues and urine on days 1, 3, 7 and 14 after radiolabeled human umbilical cord matrix stem cells injection was compared with total radioactivity injected. Data are presented in term of percentage radioactivity.
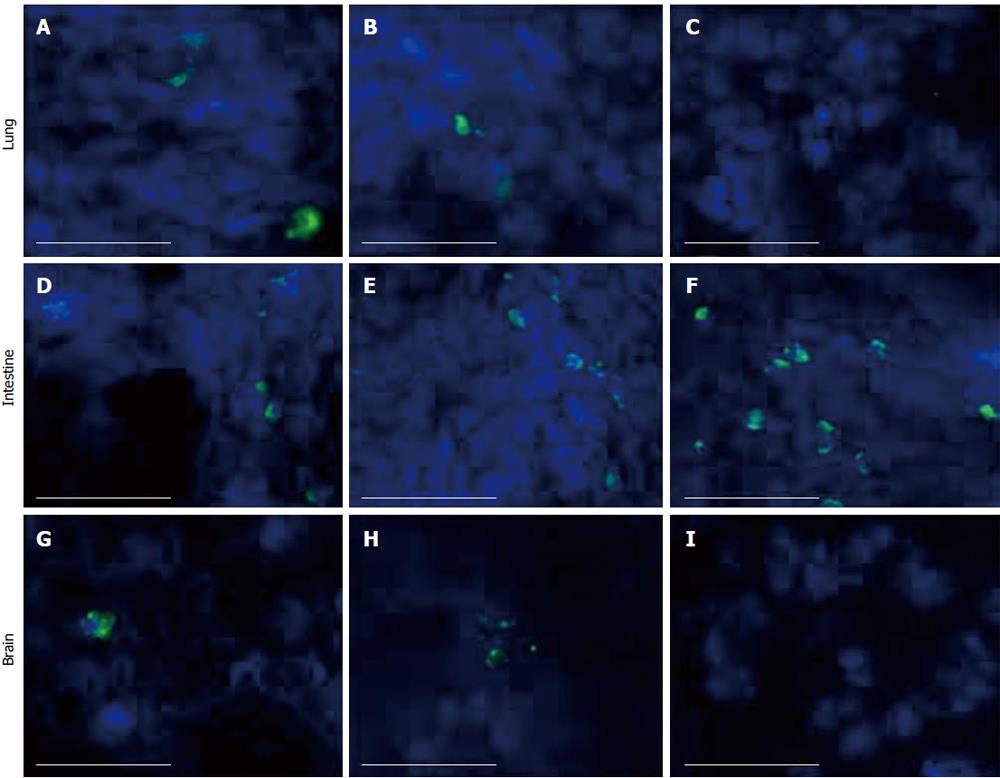
Figure 5 Detection of human umbilical cord matrix stem cells by immunofluorescence staining on days 1, 3 and 7.
Human umbilical cord matrix stem cells were detected in lung (A-C), intestine (D-F) and brain (G-I) using anti-human mitochondrial antibody. DAPI was used as counter stain for nuclear staining. All images were captured using 40 × objective. Scale bar = 50 μm.
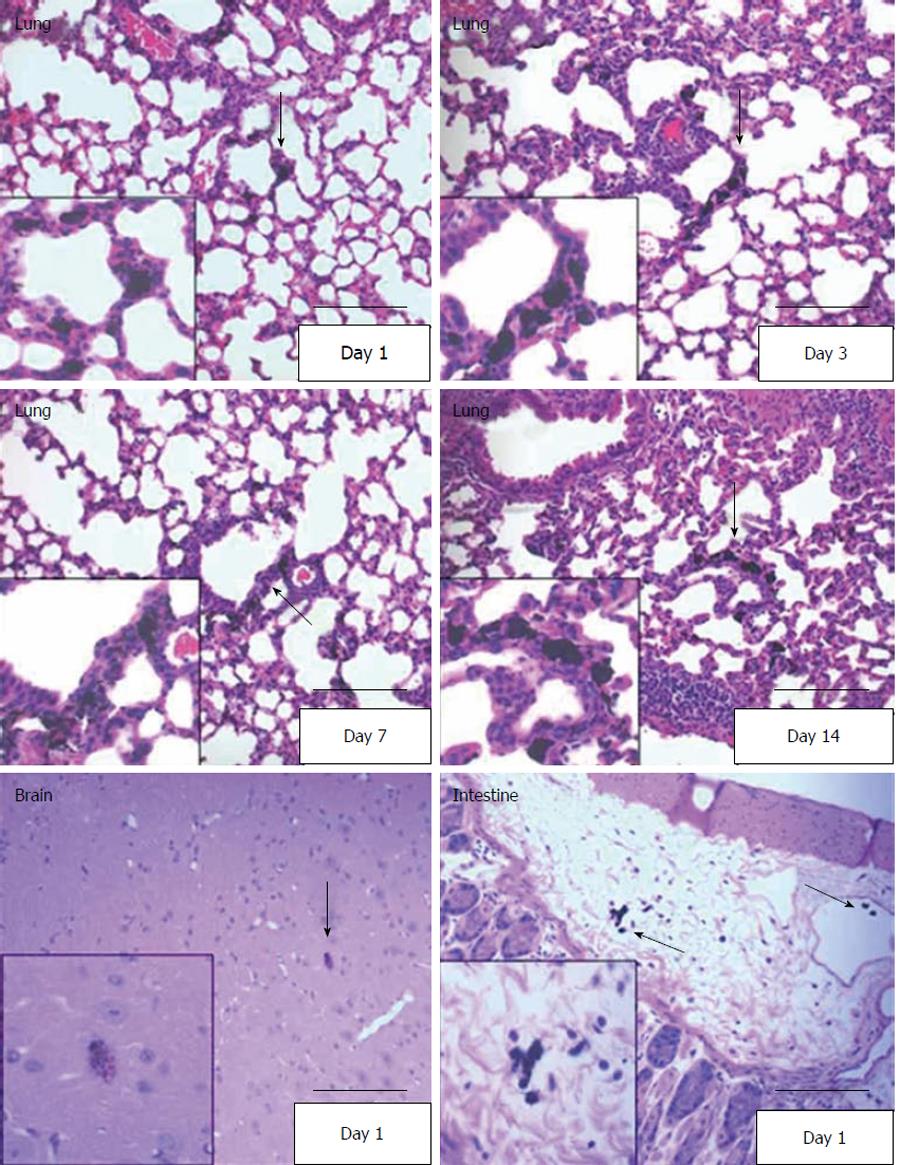
Figure 6 Visualization of human umbilical cord matrix stem cells in hematoxylin and eosin stained tissue sections.
Human umbilical cord matrix stem (hUCMS) cells were loaded with India Black ink and injected through the tail vein. hUCMS cells were detected in lung, intestine and brain on the days indicated in the panels at 200 × magnification. Red arrows in the 200 × pictures indicate India Black ink-labeled hUCMS cells which were magnified at 400 × magnification and presented as inset in each panel. Scale bar = 50 μm.
- Citation: Maurya DK, Doi C, Pyle M, Rachakatla RS, Davis D, Tamura M, Troyer D. Non-random tissue distribution of human naïve umbilical cord matrix stem cells. World J Stem Cells 2011; 3(4): 34-42
- URL: https://www.wjgnet.com/1948-0210/full/v3/i4/34.htm
- DOI: https://dx.doi.org/10.4252/wjsc.v3.i4.34


