Copyright
©2011 Baishideng Publishing Group Co.
World J Stem Cells. Dec 26, 2011; 3(12): 113-121
Published online Dec 26, 2011. doi: 10.4252/wjsc.v3.i12.113
Published online Dec 26, 2011. doi: 10.4252/wjsc.v3.i12.113
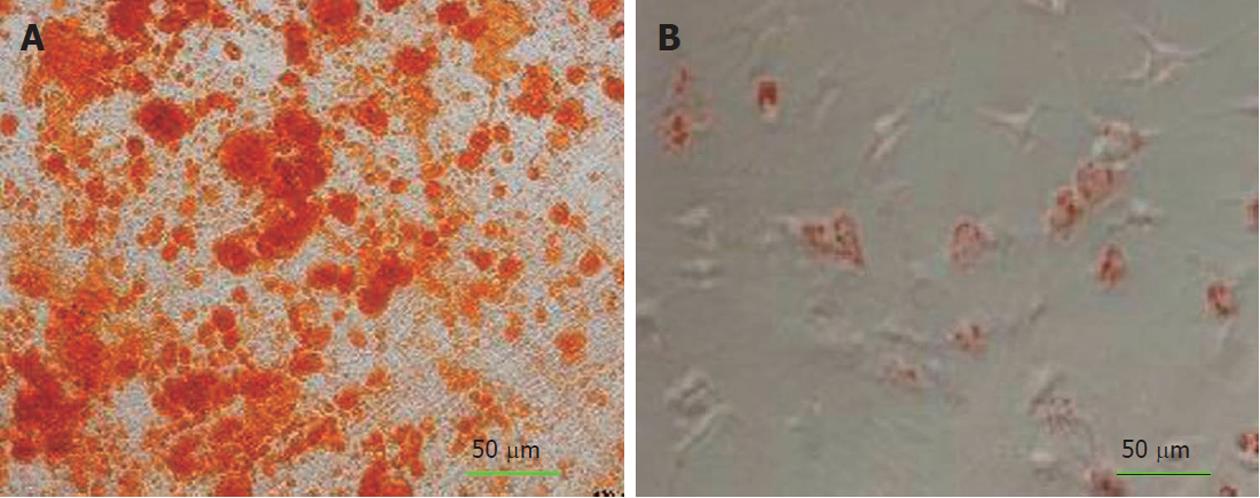
Figure 1 Osteogenic and adipogenic differentiation of bone marrow mesenchymal stem cells in the 4th passage.
A: Osteogenic differentiation was positive for alizarin red staining; B: The adipose droplet in differentiated cells after staining with oil red.
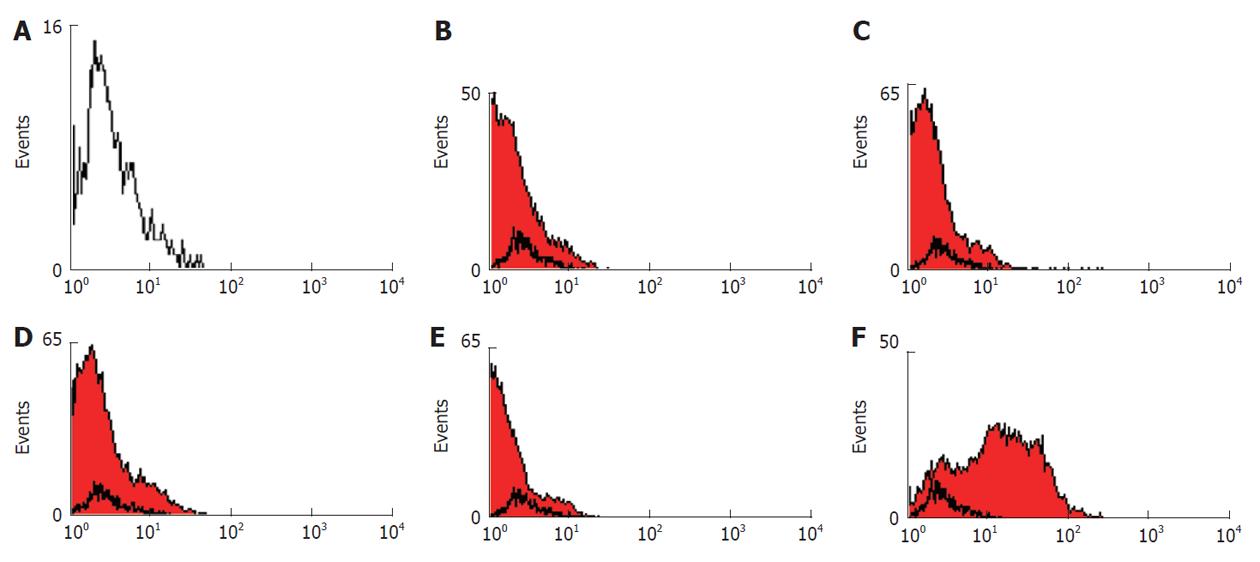
Figure 2 Immunophenotyping of bone marrow derived mesenchymal stem cells in the 3rd passage.
A: The black histogram shows the profile of the isotype control; B-E: The cells were negative for CD40, CD80, CD45 and HLA-DR respectively; F: The cells were positive for CD90.
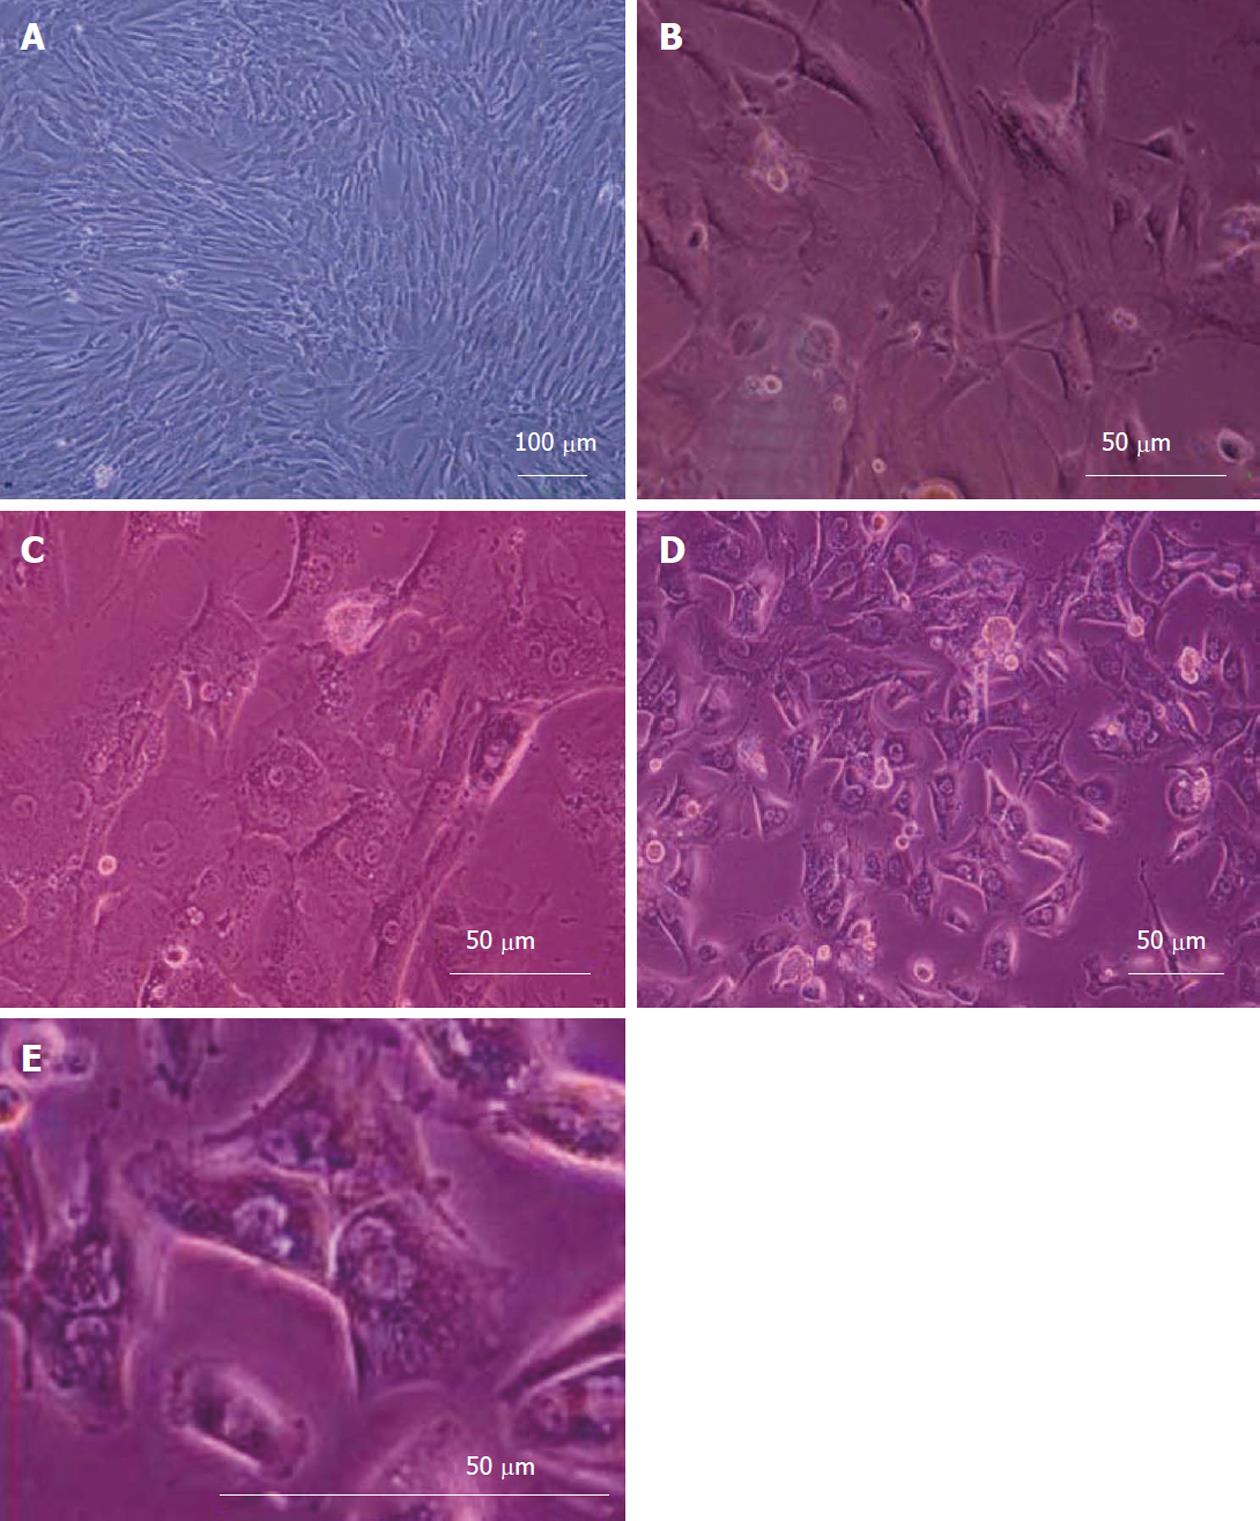
Figure 3 Morphological features of the hepatogenic differentiated cells.
A: The mesenchymal stem cells obtained from human culture before differentiation; B: The differentiated cells under hepatogenic conditions on day 7; C: The binucleated cells on day 19; D: The differentiated cells with cuboidal morphology on day 21; E: These cells exhibited a polygonal shape with cytoplasmic granules.
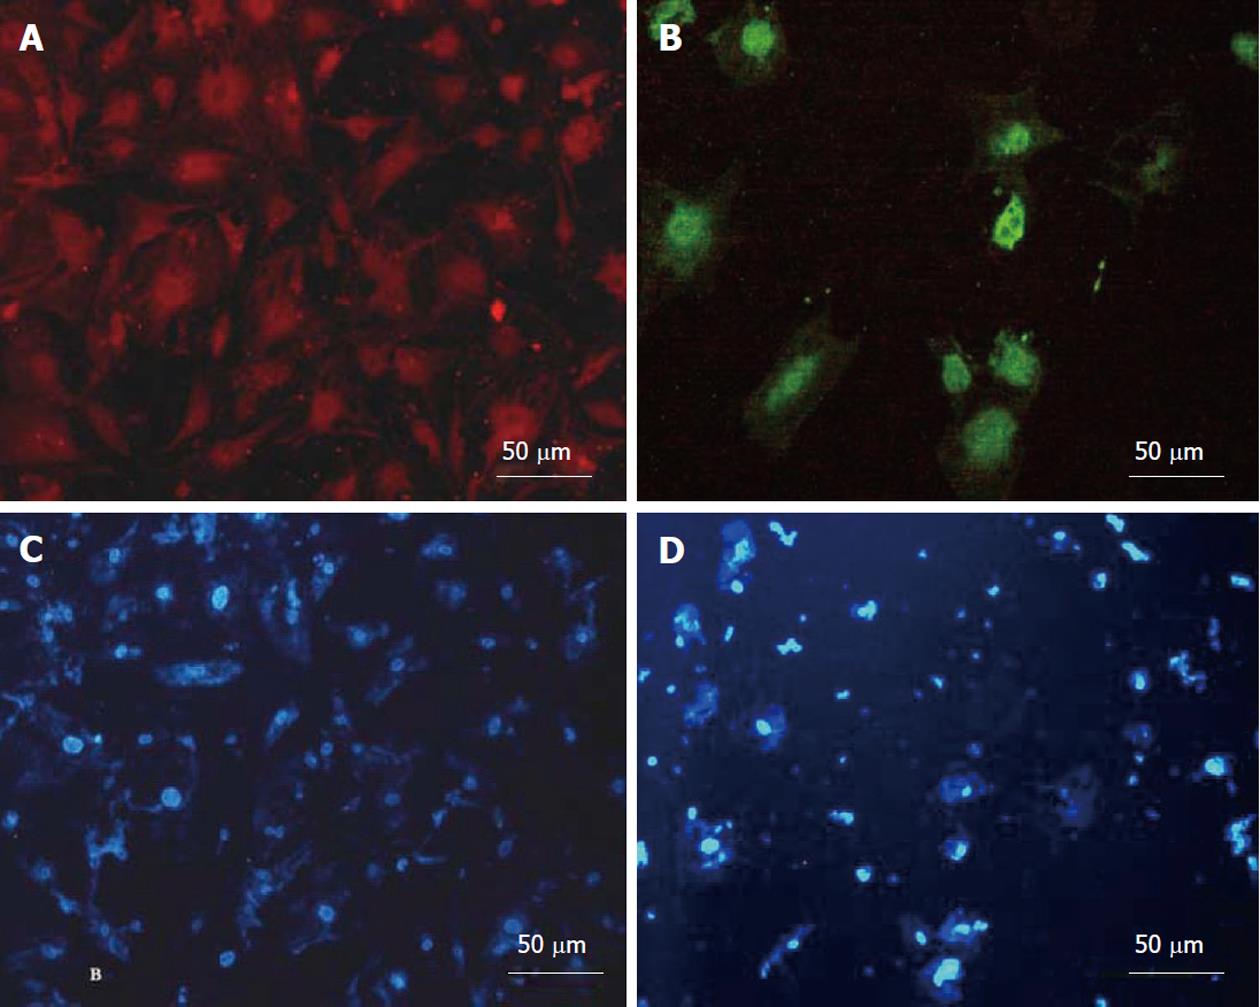
Figure 4 The immunocytochemistry analysis of the hepatogenic differentiated cells at day 21.
A: PE-fluorescent staining for albumin; B: FITC-fluorescent staining for α-feto protein; C-D: Nuclear staining using DAPI for albumin and α-feto protein respectively.
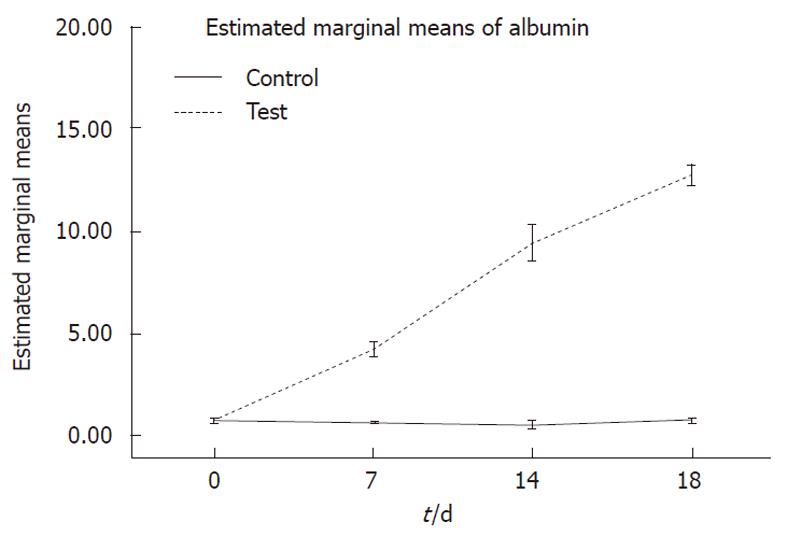
Figure 5 Albumin levels in hepatogenic differentiated cells (test) in comparison to undifferentiated cells (control) by enzyme linked immunosorbent assay.
Albumin levels are expressed as μg/mL (Y-axis) on days 0, 7, 14 and 18 of differentiation (X-axis). The treated cells produced significantly higher levels of albumin compared to undifferentiated cells (P < 0.001).
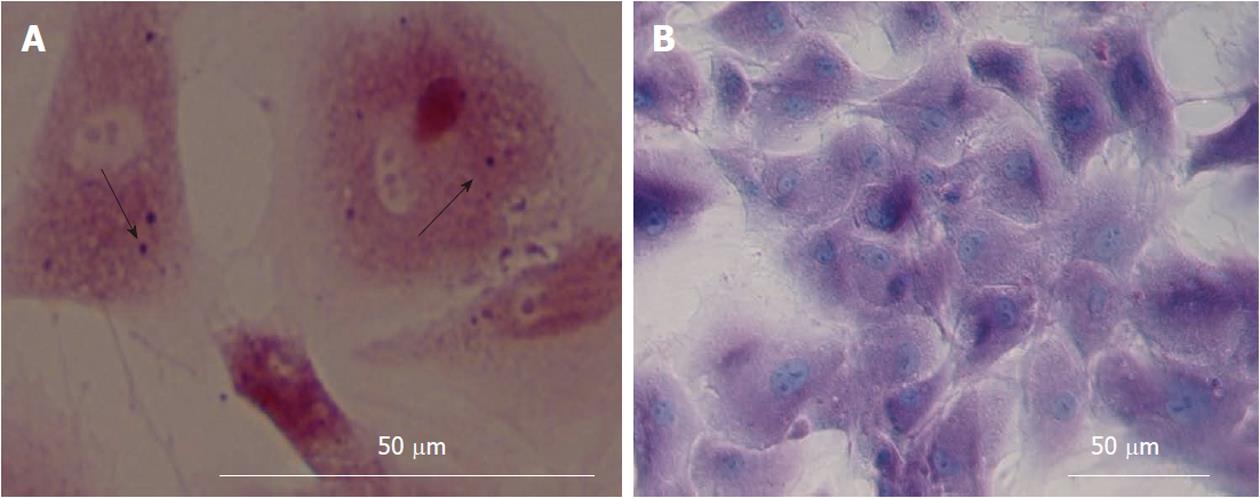
Figure 6 Periodic Acid-Schiff staining assay in hepatogenic differentiated cells.
A: Glycogen uptake by the cells was first seen after 21 d upon treatment; B: Nuclei were stained with haematoxylin.
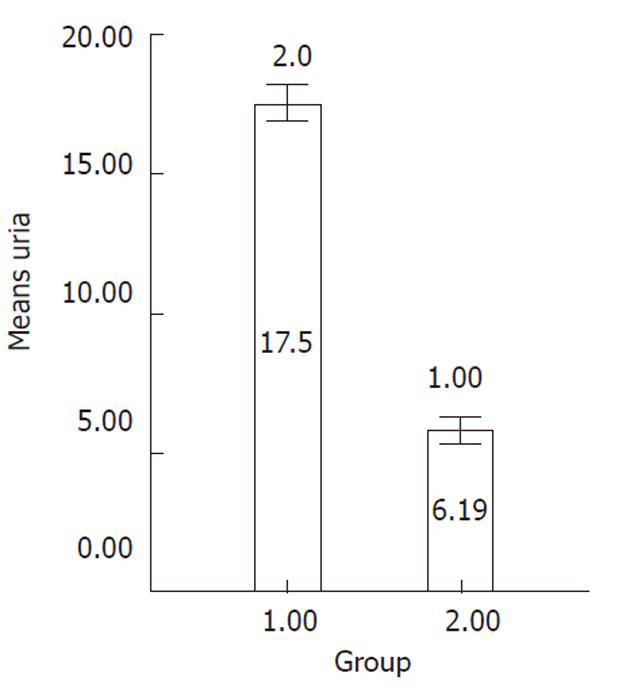
Figure 7 Production of urea in hepatogenic differentiated cells (group-1) compared to undifferentiated cells (group-2).
The urea production as mg/dL (Y-axis) was significantly increased over culture time (P < 0.001).
- Citation: Ayatollahi M, Soleimani M, Tabei SZ, Kabir Salmani M. Hepatogenic differentiation of mesenchymal stem cells induced by insulin like growth factor-I. World J Stem Cells 2011; 3(12): 113-121
- URL: https://www.wjgnet.com/1948-0210/full/v3/i12/113.htm
- DOI: https://dx.doi.org/10.4252/wjsc.v3.i12.113


