Copyright
©2011 Baishideng Publishing Group Co.
World J Stem Cells. Nov 26, 2011; 3(11): 104-112
Published online Nov 26, 2011. doi: 10.4252/wjsc.v3.i11.104
Published online Nov 26, 2011. doi: 10.4252/wjsc.v3.i11.104
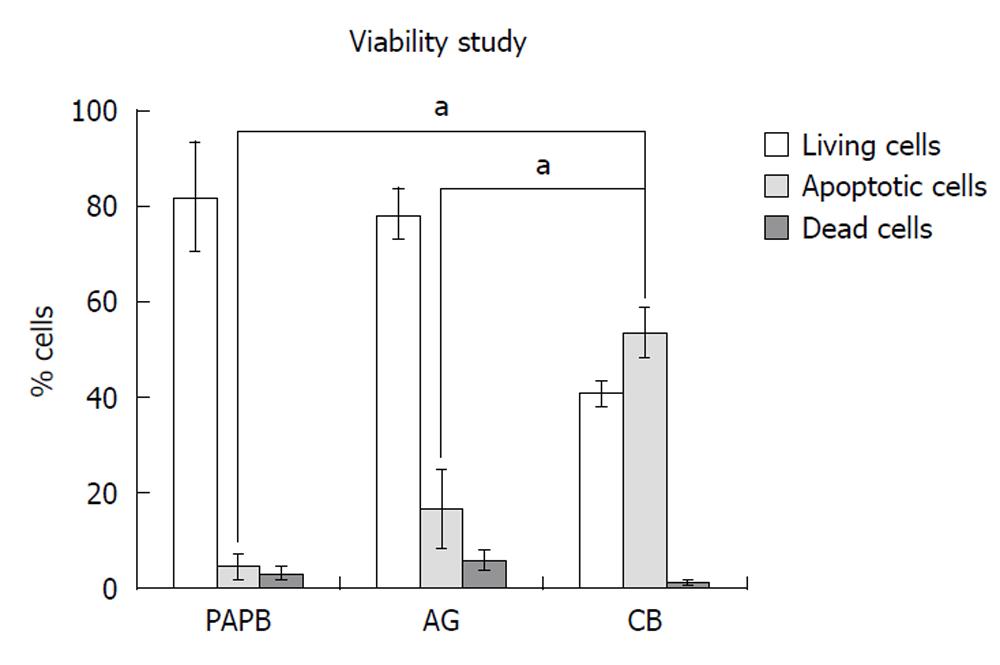
Figure 1 Profile of apoptotic cells in CD34+ cells from three different sources.
The averages and SE of samples from independent biological replicates are shown: aP = 0.005, in a Kurskal wallis test. PAPB: Pre-apheresis peripheral blood; AG: Apheresis graft; CB: Cord blood.
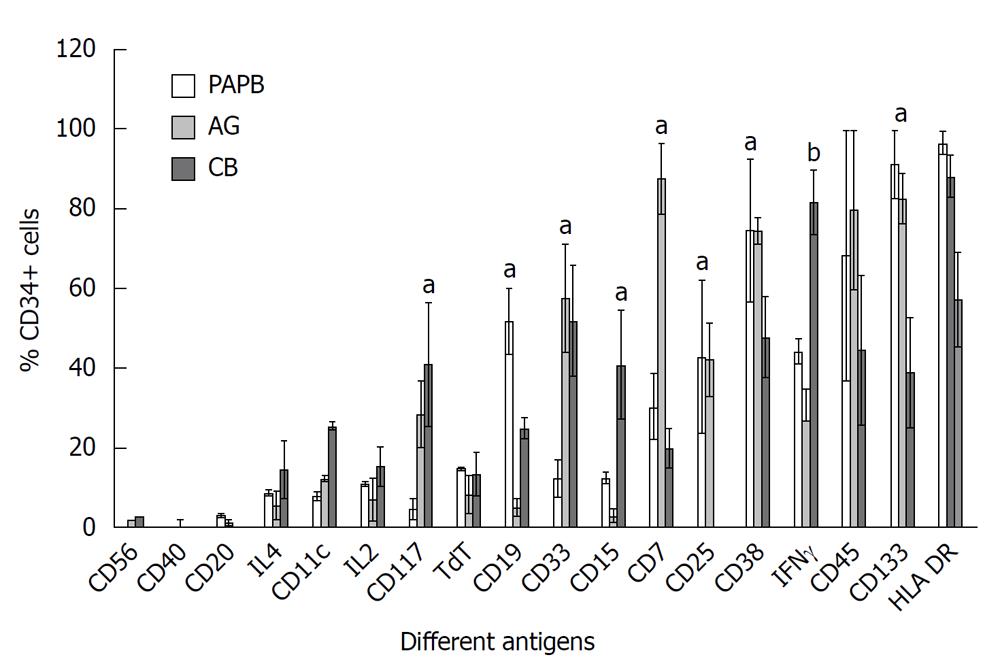
Figure 2 Comparison of the antigenic profile of CD34+ cells from three different sources: pre-apheresis peripheral blood, apheresis graft and cord blood.
Results are expressed as mean percentage ± SE of positive cells. aP < 0.05, bP < 0.0001. PAPB: Pre-apheresis peripheral blood; AG: Apheresis graft; CB: Cord blood; IFN: Interferon.
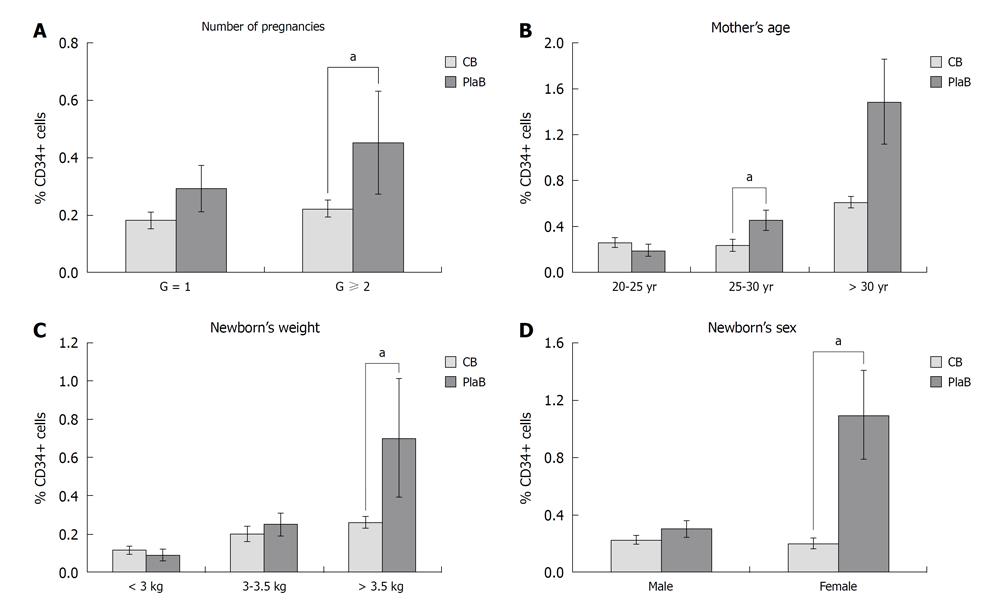
Figure 3 Variation of the incidence of hematopoietic stem cell CD34+ in relation to the number of pregnancies (A), the mother’s age (B), the newborn’s weight (C) and sex (D): Comparison between cord blood and placenta delivery.
Data showed here represent average ± SE. aP < 0.05. G: Gestation; CB: Cord blood; PlaB: Placenta delivery.
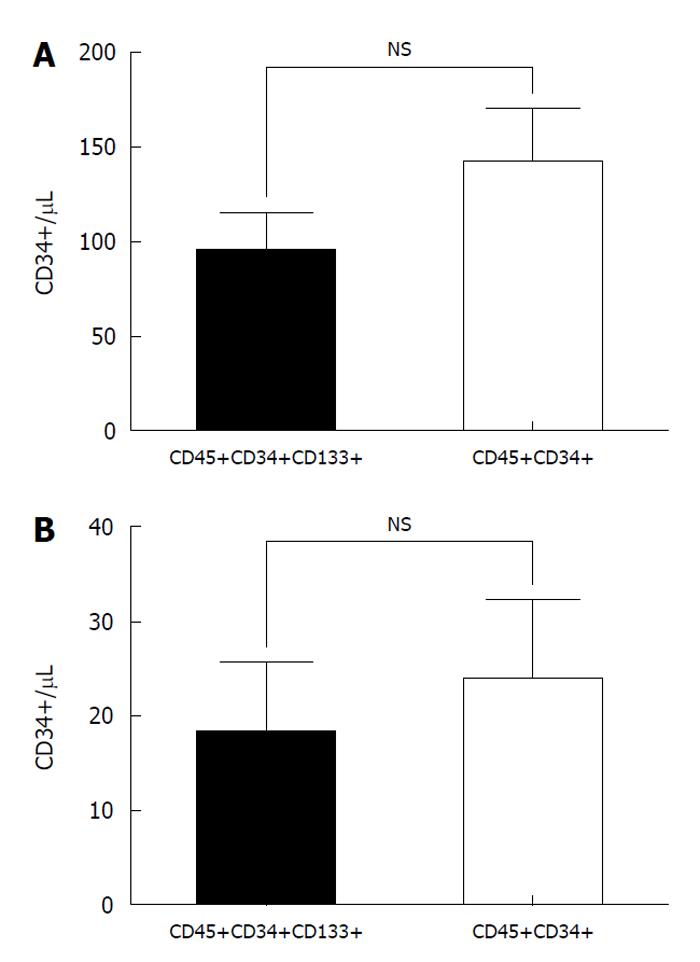
Figure 4 Quantitative study of antigenic marker CD133 in pre-apheresis peripheral blood (A) and in cord blood (B): The population CD34+CD45+
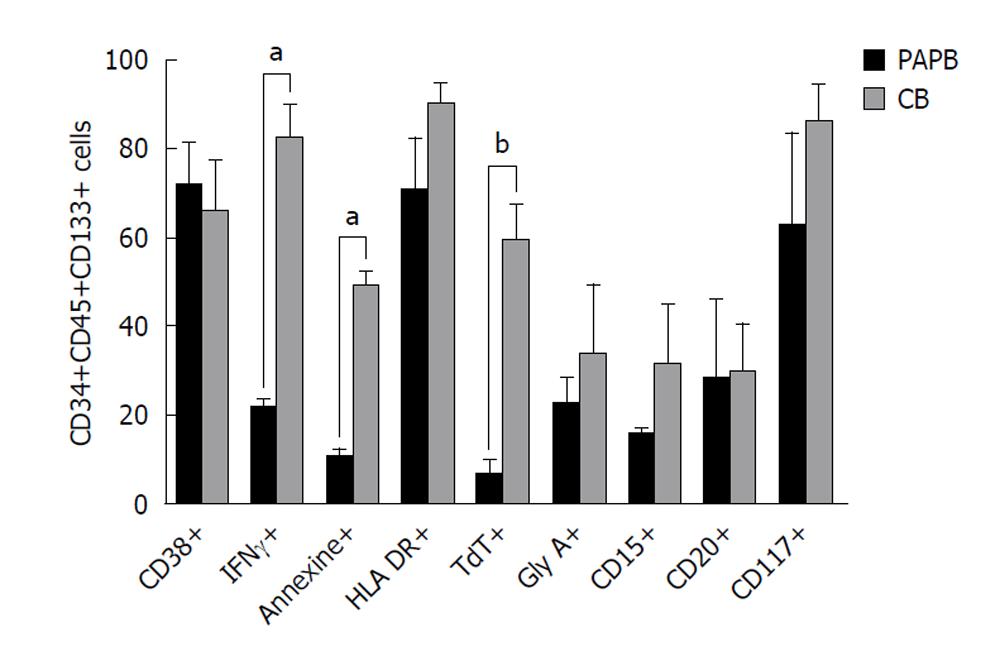
Figure 5 Comparison of the immunophenotyping of the population CD133+CD45+CD34+ cells in pre-apheresis peripheral blood and cord blood.
aP < 0.05, bP < 0.01. PAPB: Pre-apheresis peripheral blood; CB: Cord blood; IFN: Interferon.
- Citation: Azouna NB, Berraeis L, Regaya Z, Jenhani F. Immunophenotyping of hematopoietic progenitor cells: Comparison between cord blood and adult mobilized blood grafts. World J Stem Cells 2011; 3(11): 104-112
- URL: https://www.wjgnet.com/1948-0210/full/v3/i11/104.htm
- DOI: https://dx.doi.org/10.4252/wjsc.v3.i11.104


