Copyright
©2010 Baishideng Publishing Group Co.
World J Stem Cells. Dec 26, 2010; 2(6): 127-140
Published online Dec 26, 2010. doi: 10.4252/wjsc.v2.i6.127
Published online Dec 26, 2010. doi: 10.4252/wjsc.v2.i6.127
Figure 1 Overrepresentation analysis of the differentially regulated genes between R1 and HM-1 embryonic stem cells.
Panels represent analysis results based on (A, 1: Morphogenesis and development, 15, 27%; 2: Organogenesis, 12, 22%; 3: Temperature response, 3, 5%; 4: Response to abiotic stimulus, 7, 13%; 5: Miscellaneous, 5, 9%; 6: Unclassified, 13, 24%) GO biological process, (B, 1: Calcium ion binding, 14, 24%; 2: Heat shock protein activity, 3, 5%; 3: Protein binding, 14, 24%; 4: Structural molecule activity, 9, 16%; 5: Unclassified, 13, 22%; 6: Enzyme regulator activity, 5, 9%) GO molecular function, (C, 1: Extracellular matrix, 17, 31%; 2: Basement membrane, 4, 7%; 3: Unclassified, 13, 24%; 4: Muscle fiber, 3, 5%; 5: Miscellaneous, 18, 33%) GO cellular components.
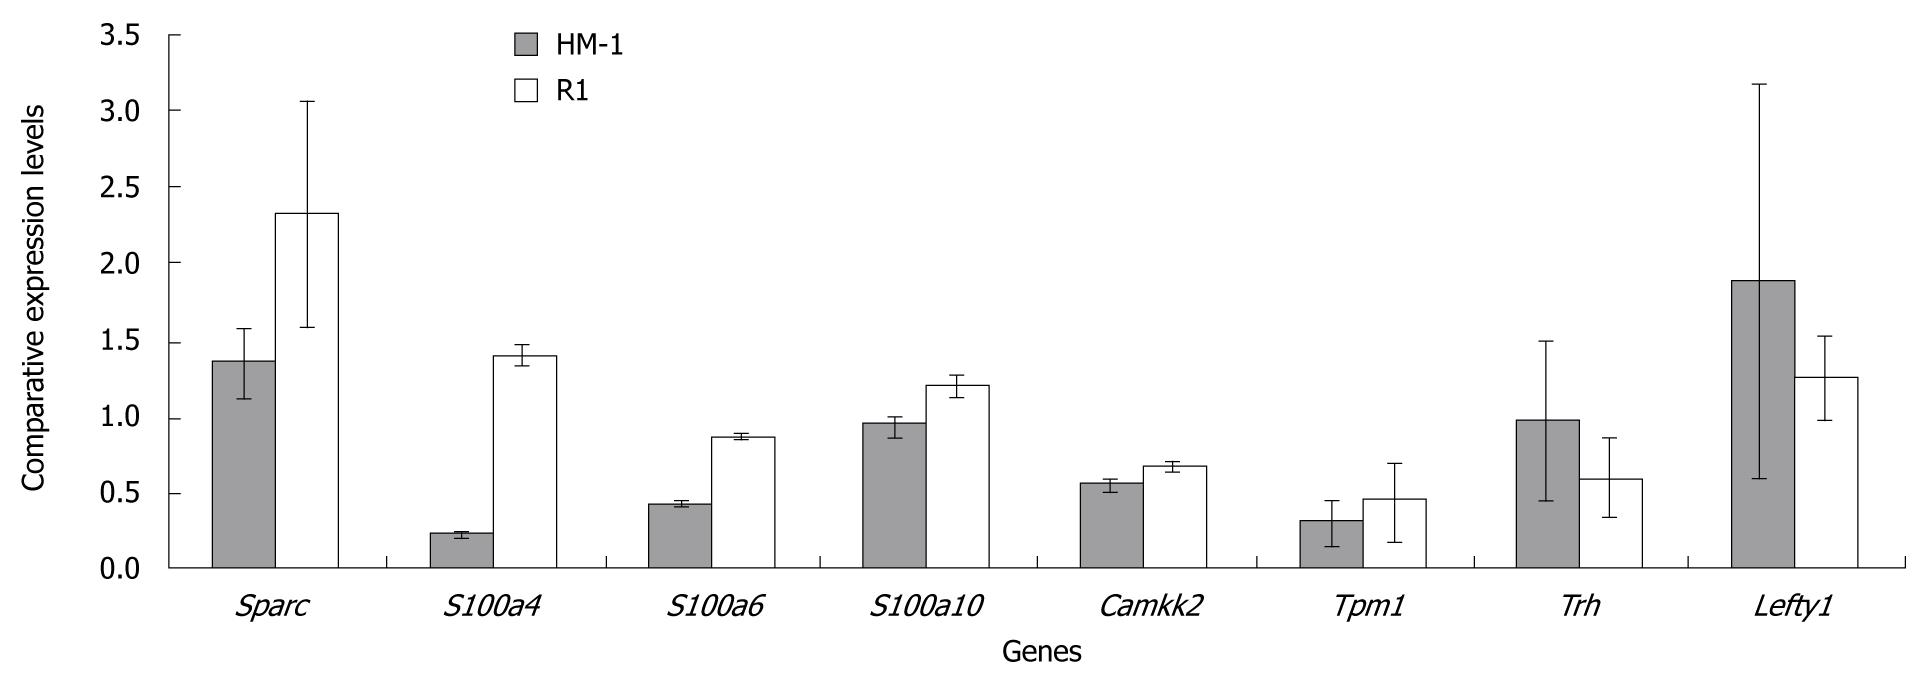
Figure 2 Relative expression analysis results of real time polymerase chain reaction for subsets of genes in R1 and HM-1 embryonic stem cells.
Independently prepared samples were compared to validate the results of microarray. The analysis of real time polymerase chain reaction results supports the earlier microarray results with minor ration variations.
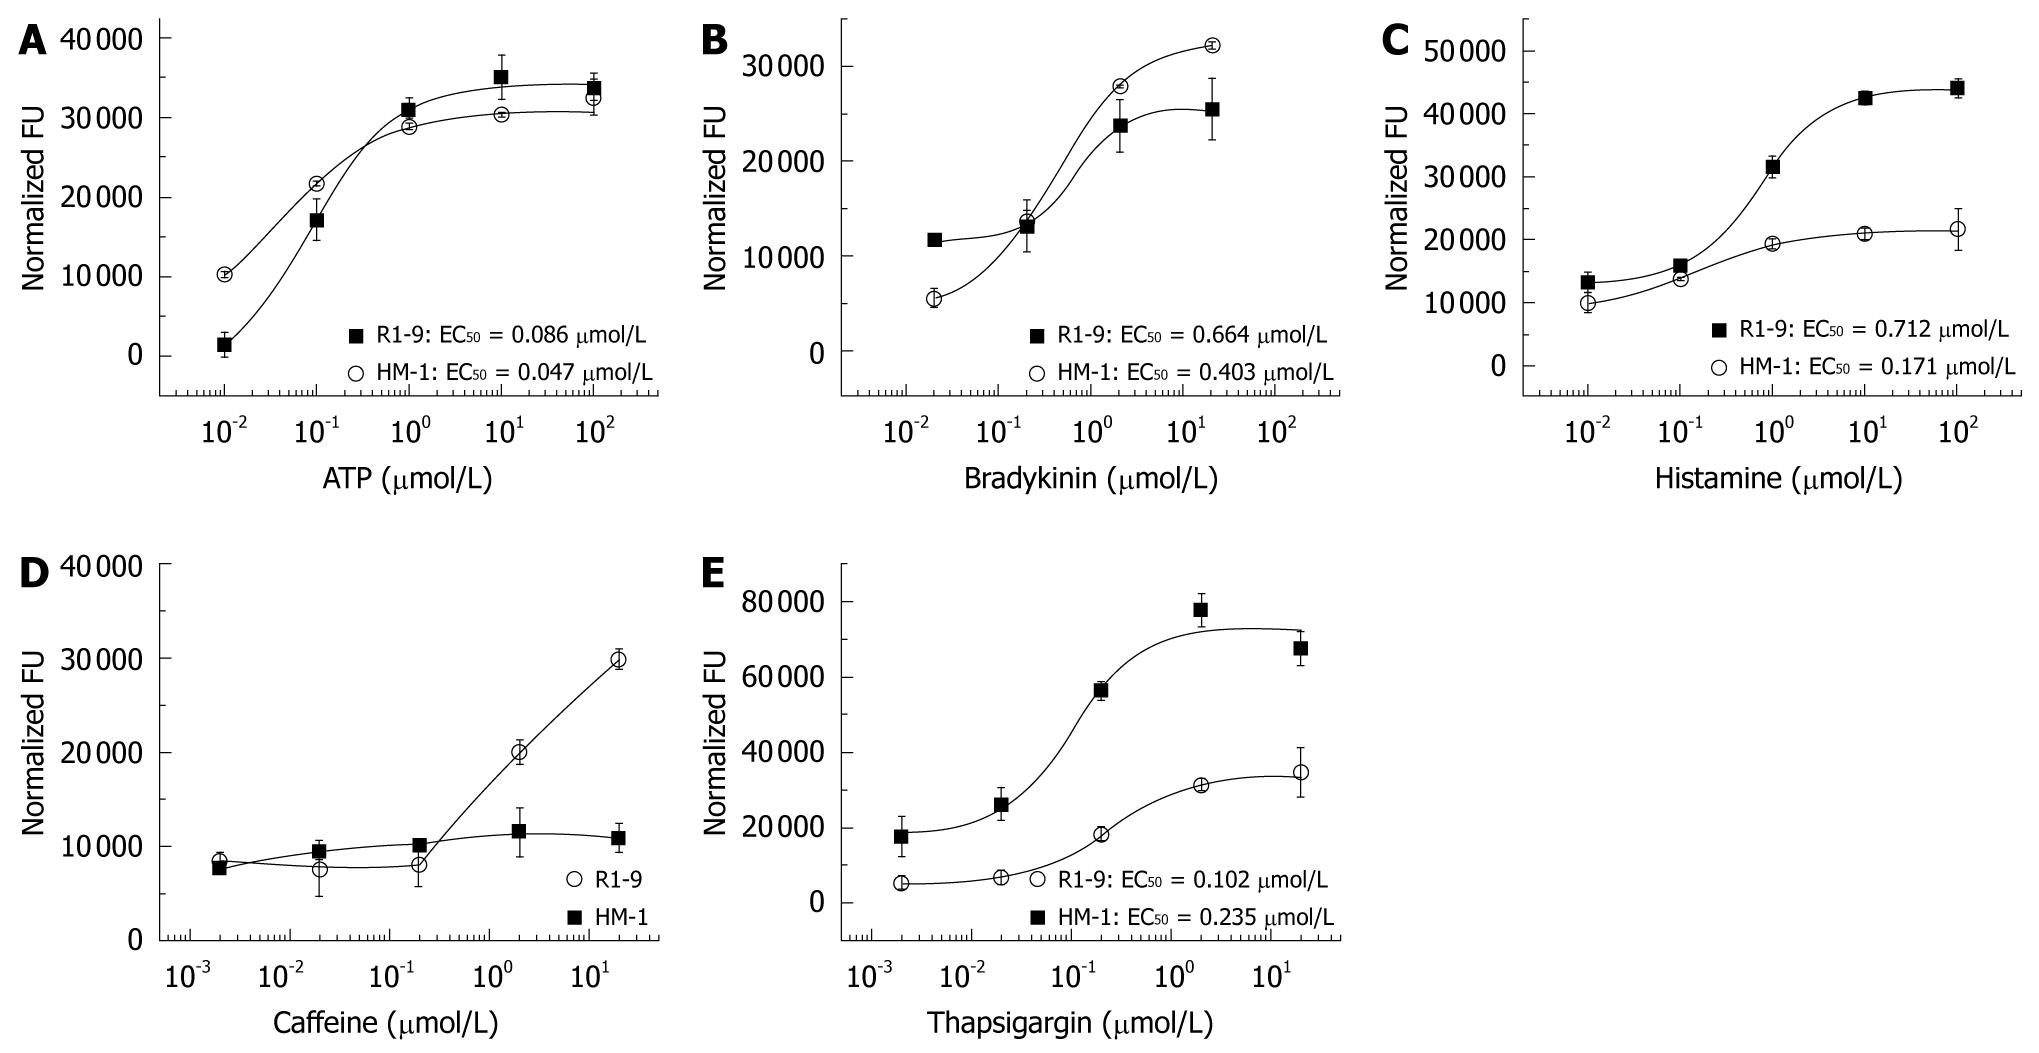
Figure 3 Comparison of agonist-induced changes in [Ca2+]i in mouse R1 and HM-1 embryonic stem cells.
The plates were placed into a FlexStation II384 (FLIPR) to monitor cell fluorescence (lEX = 494 nmol/L, lEM = 516 nmol/L, FU, fluorescence units) before and after the addition of various concentrations of agents in high-Ca (1.8 mmol/L) Hank’s medium. A: ATP; B: Bradykinin; C: Histamine; D: Caffeine; E: Thapsigargin.
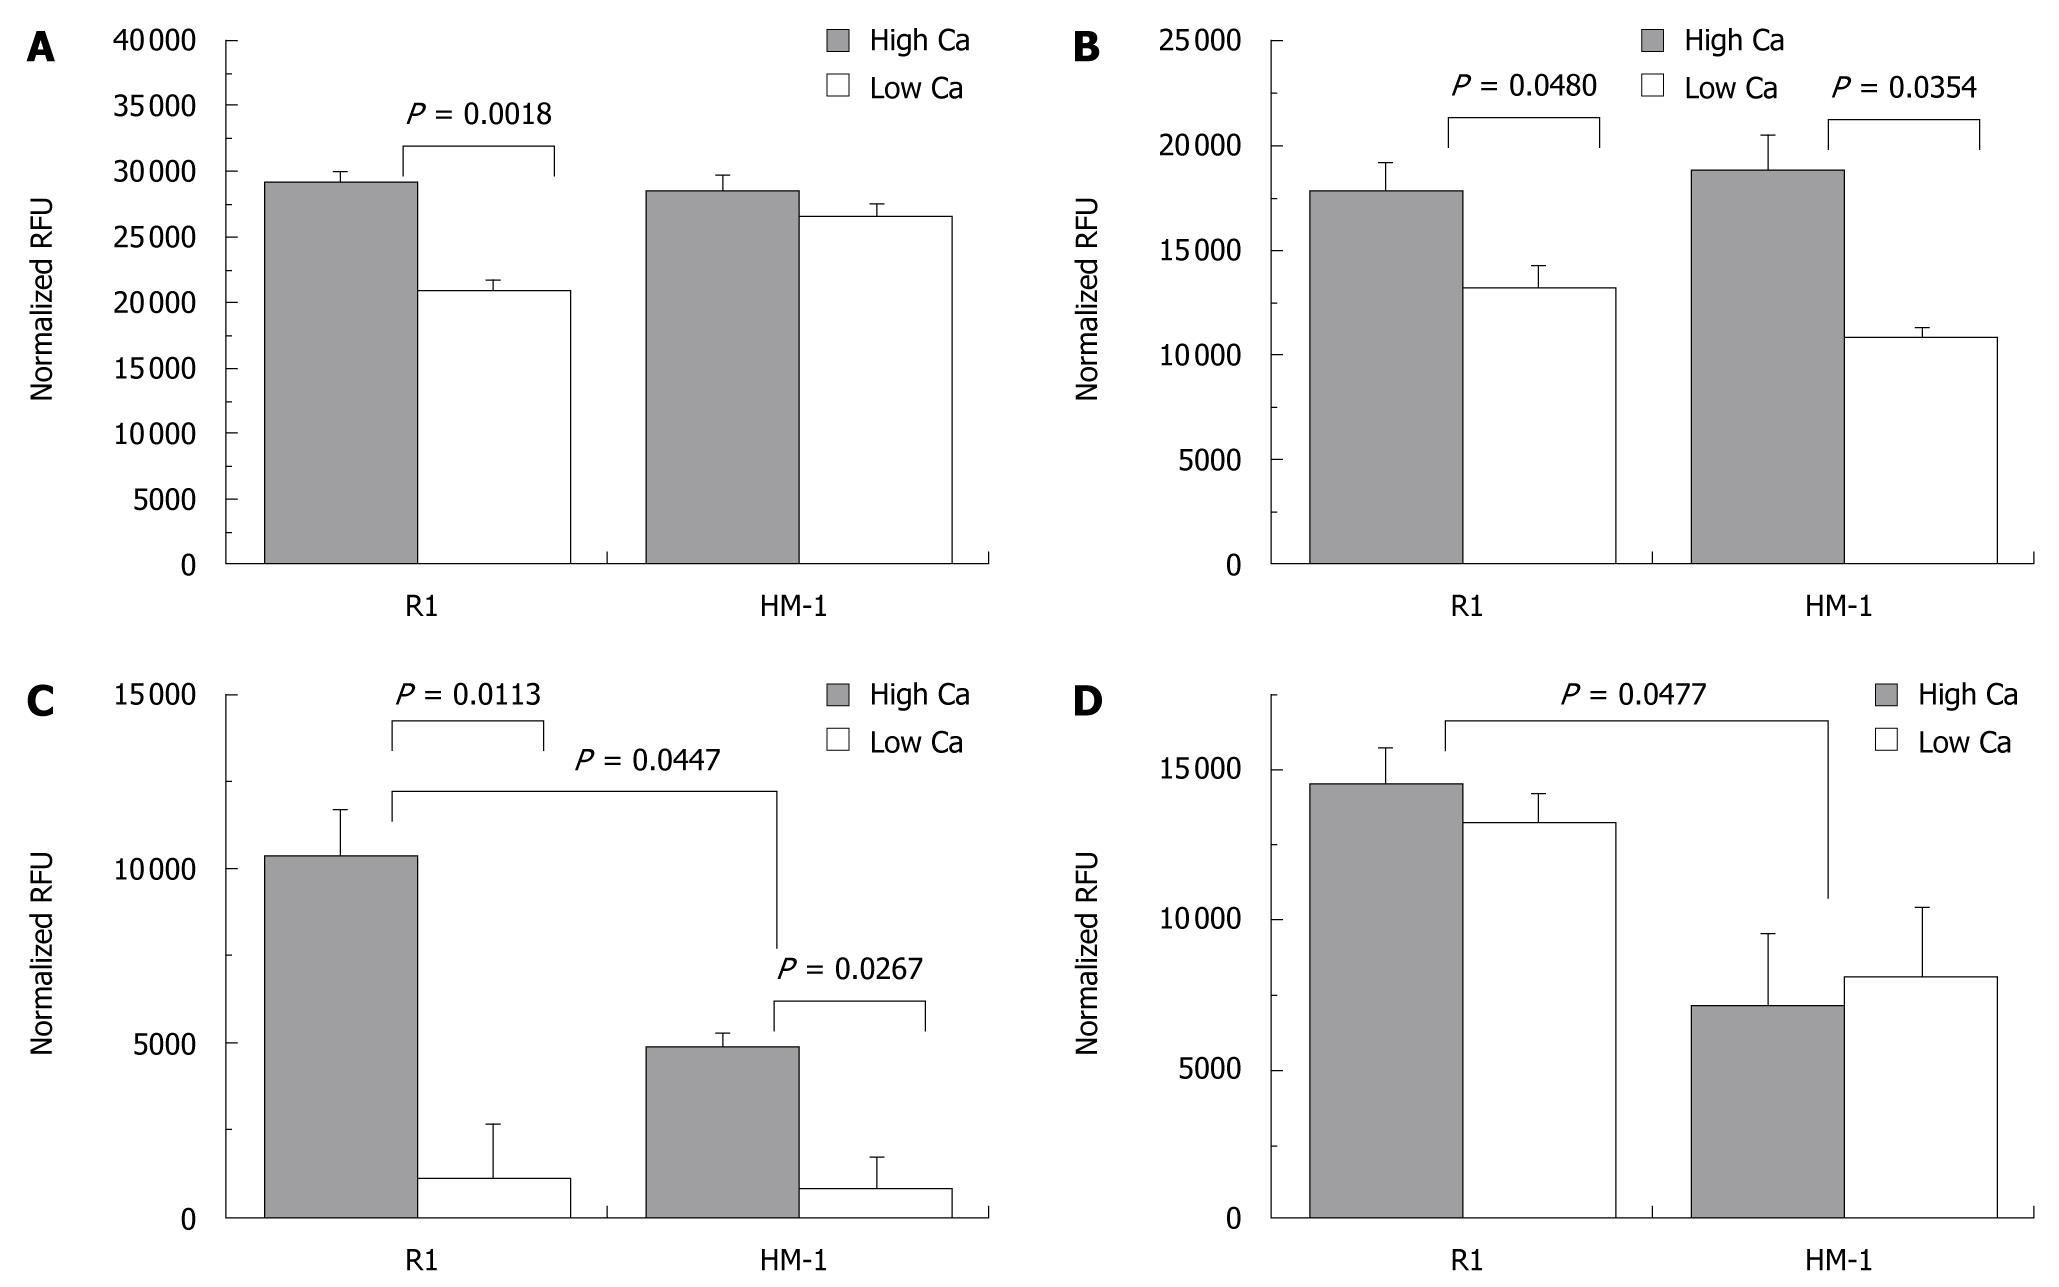
Figure 4 Comparison of agonist-induced changes of [Ca2+]i in high- and low-Ca solutions.
Cell fluorescence was monitored before and after addition of agents in high-Ca (1.8 mmol/L) and low-Ca (0.6 mmol/L) Hank’s medium. Panels summarize effects of (A) 200 mmol/L ATP (B), 20 mmol/L Bradykinin (C), 100 mmol/L Histamine (D) 20 mmol/L Thapsigargin. Asterisks mark significant (P < 0.05) differences.
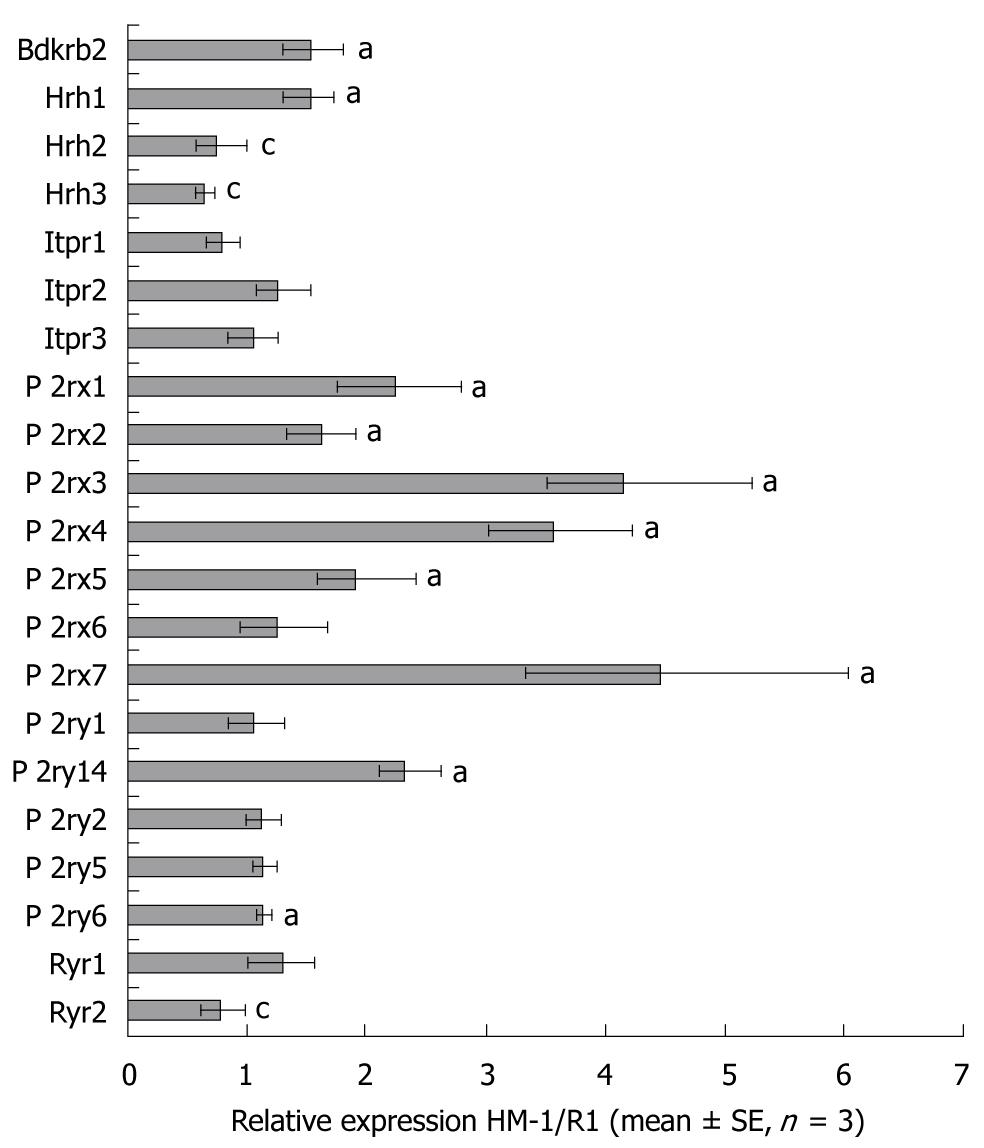
Figure 5 Differential expression of genes encoding surface membrane and intracellular receptors involved in the regulation of Ca-homeostasis of R1 and HM-1 embryonic stem cells.
Independently prepared samples were used to measure the expression of various receptors by real time polymerase chain reaction and relative expression levels were presented. aRepresent genes significantly (P < 0.05) up regulated; cRepresent genes significantly (P < 0.05) down regulated in HM-1 compared to R1 embryonic stem cells.
- Citation: Mamo S, Kobolak J, Borbíró I, Bíró T, Bock I, Dinnyes A. Gene targeting and Calcium handling efficiencies in mouse embryonic stem cell lines. World J Stem Cells 2010; 2(6): 127-140
- URL: https://www.wjgnet.com/1948-0210/full/v2/i6/127.htm
- DOI: https://dx.doi.org/10.4252/wjsc.v2.i6.127


