Copyright
©2010 Baishideng Publishing Group Co.
World J Stem Cells. Oct 26, 2010; 2(5): 114-120
Published online Oct 26, 2010. doi: 10.4252/wjsc.v2.i5.114
Published online Oct 26, 2010. doi: 10.4252/wjsc.v2.i5.114
Figure 1 Spontaneous immortalization of human dermal microvascular endothelial cells.
Appearance of primary HDMECs and immortalized iHDME1 cells after 3 and 10 passages demonstrating retention of normal phenotypic characteristics in culture. An iHDME1-GFP cell line established by a retroviral transduction shows uniform GFP expression under a fluorescent microscopy (The bottom panel). Scale bar = 50 μm.
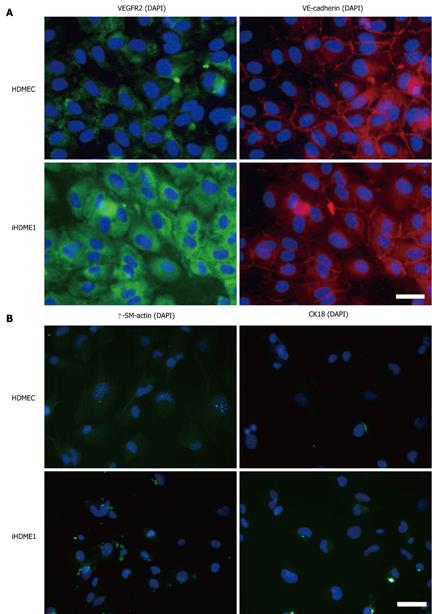
Figure 2 iHDME1 cells express endothelial markers but negative of epithelial and smooth muscle cell markers.
A: Human dermal microvascular endothelial cells (HDMECs) and iHDME1 cells grown on glass cover slides were incubated with antibodies against VEGFR2 and VE-cadherin respectively; B: HDMECs and iHDME1 cells grown on glass cover slides were incubated with antibodies against α-SM-actin and CK18 respectively. Nuclei were illuminated with DAPI. Scale bar = 50 μm.
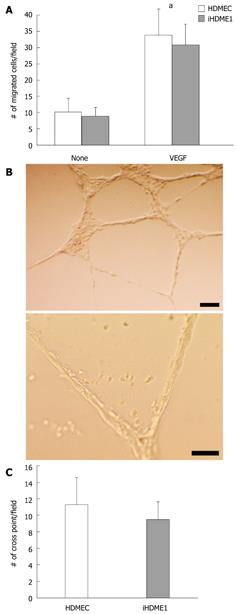
Figure 3 iHDME1 cells retain endothelial properties in vitro.
A: Migration of Human dermal microvascular endothelial cells (HDMECs) and iHDME1 cells towards medium with or without VEGF (25 ng/mL). Migrating cells were counted 4 h after cell plating in eight randomly selected high power fields. aP < 0.05 using Student’s t test, comparing to unstimulated cells; B: iHDME1 cells in 3-D Matrigel cultures. Vascular structure formation was followed over time and representative images taken 28 h after plating are shown; C: Cross point of vascular structures from HDMECs and iHDME1 cells were counted under microscope and graphed 28 h after plating. The data were collected from three independent experiments.
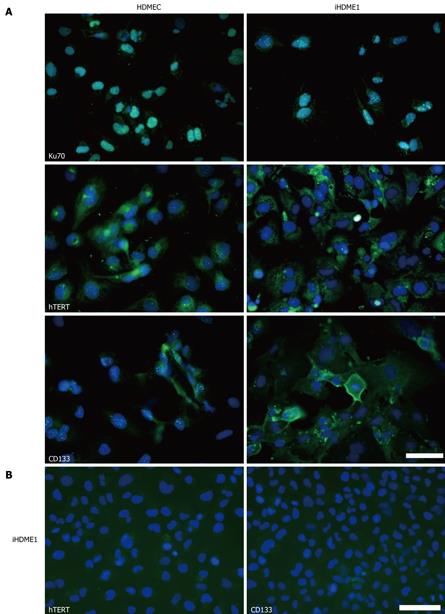
Figure 4 iHDME1 cells express elevated hTERT and CD133.
A: HDMECs and iHDME1 cells cultured on glass slides were stained for Ku70 (a human marker), hTERT and CD133 protein expression. Nuclei were illuminated with DAPI staining. The cells were examined under a fluorescent microscopy and representative images were shown. Scale bar = 50 μm; B. The staining is specific as the isotype controls of hTERT and CD133 are totally negative. Nuclei were illuminated with DAPI staining. Scale bar = 50 μm.
- Citation: Jiang M, Min Y, DeBusk L, Fernandez S, Strand DW, Hayward SW, Lin PC. Spontaneous immortalization of human dermal microvascular endothelial cells. World J Stem Cells 2010; 2(5): 114-120
- URL: https://www.wjgnet.com/1948-0210/full/v2/i5/114.htm
- DOI: https://dx.doi.org/10.4252/wjsc.v2.i5.114


