Copyright
©The Author(s) 2024.
World J Stem Cells. Jun 26, 2024; 16(6): 728-738
Published online Jun 26, 2024. doi: 10.4252/wjsc.v16.i6.728
Published online Jun 26, 2024. doi: 10.4252/wjsc.v16.i6.728
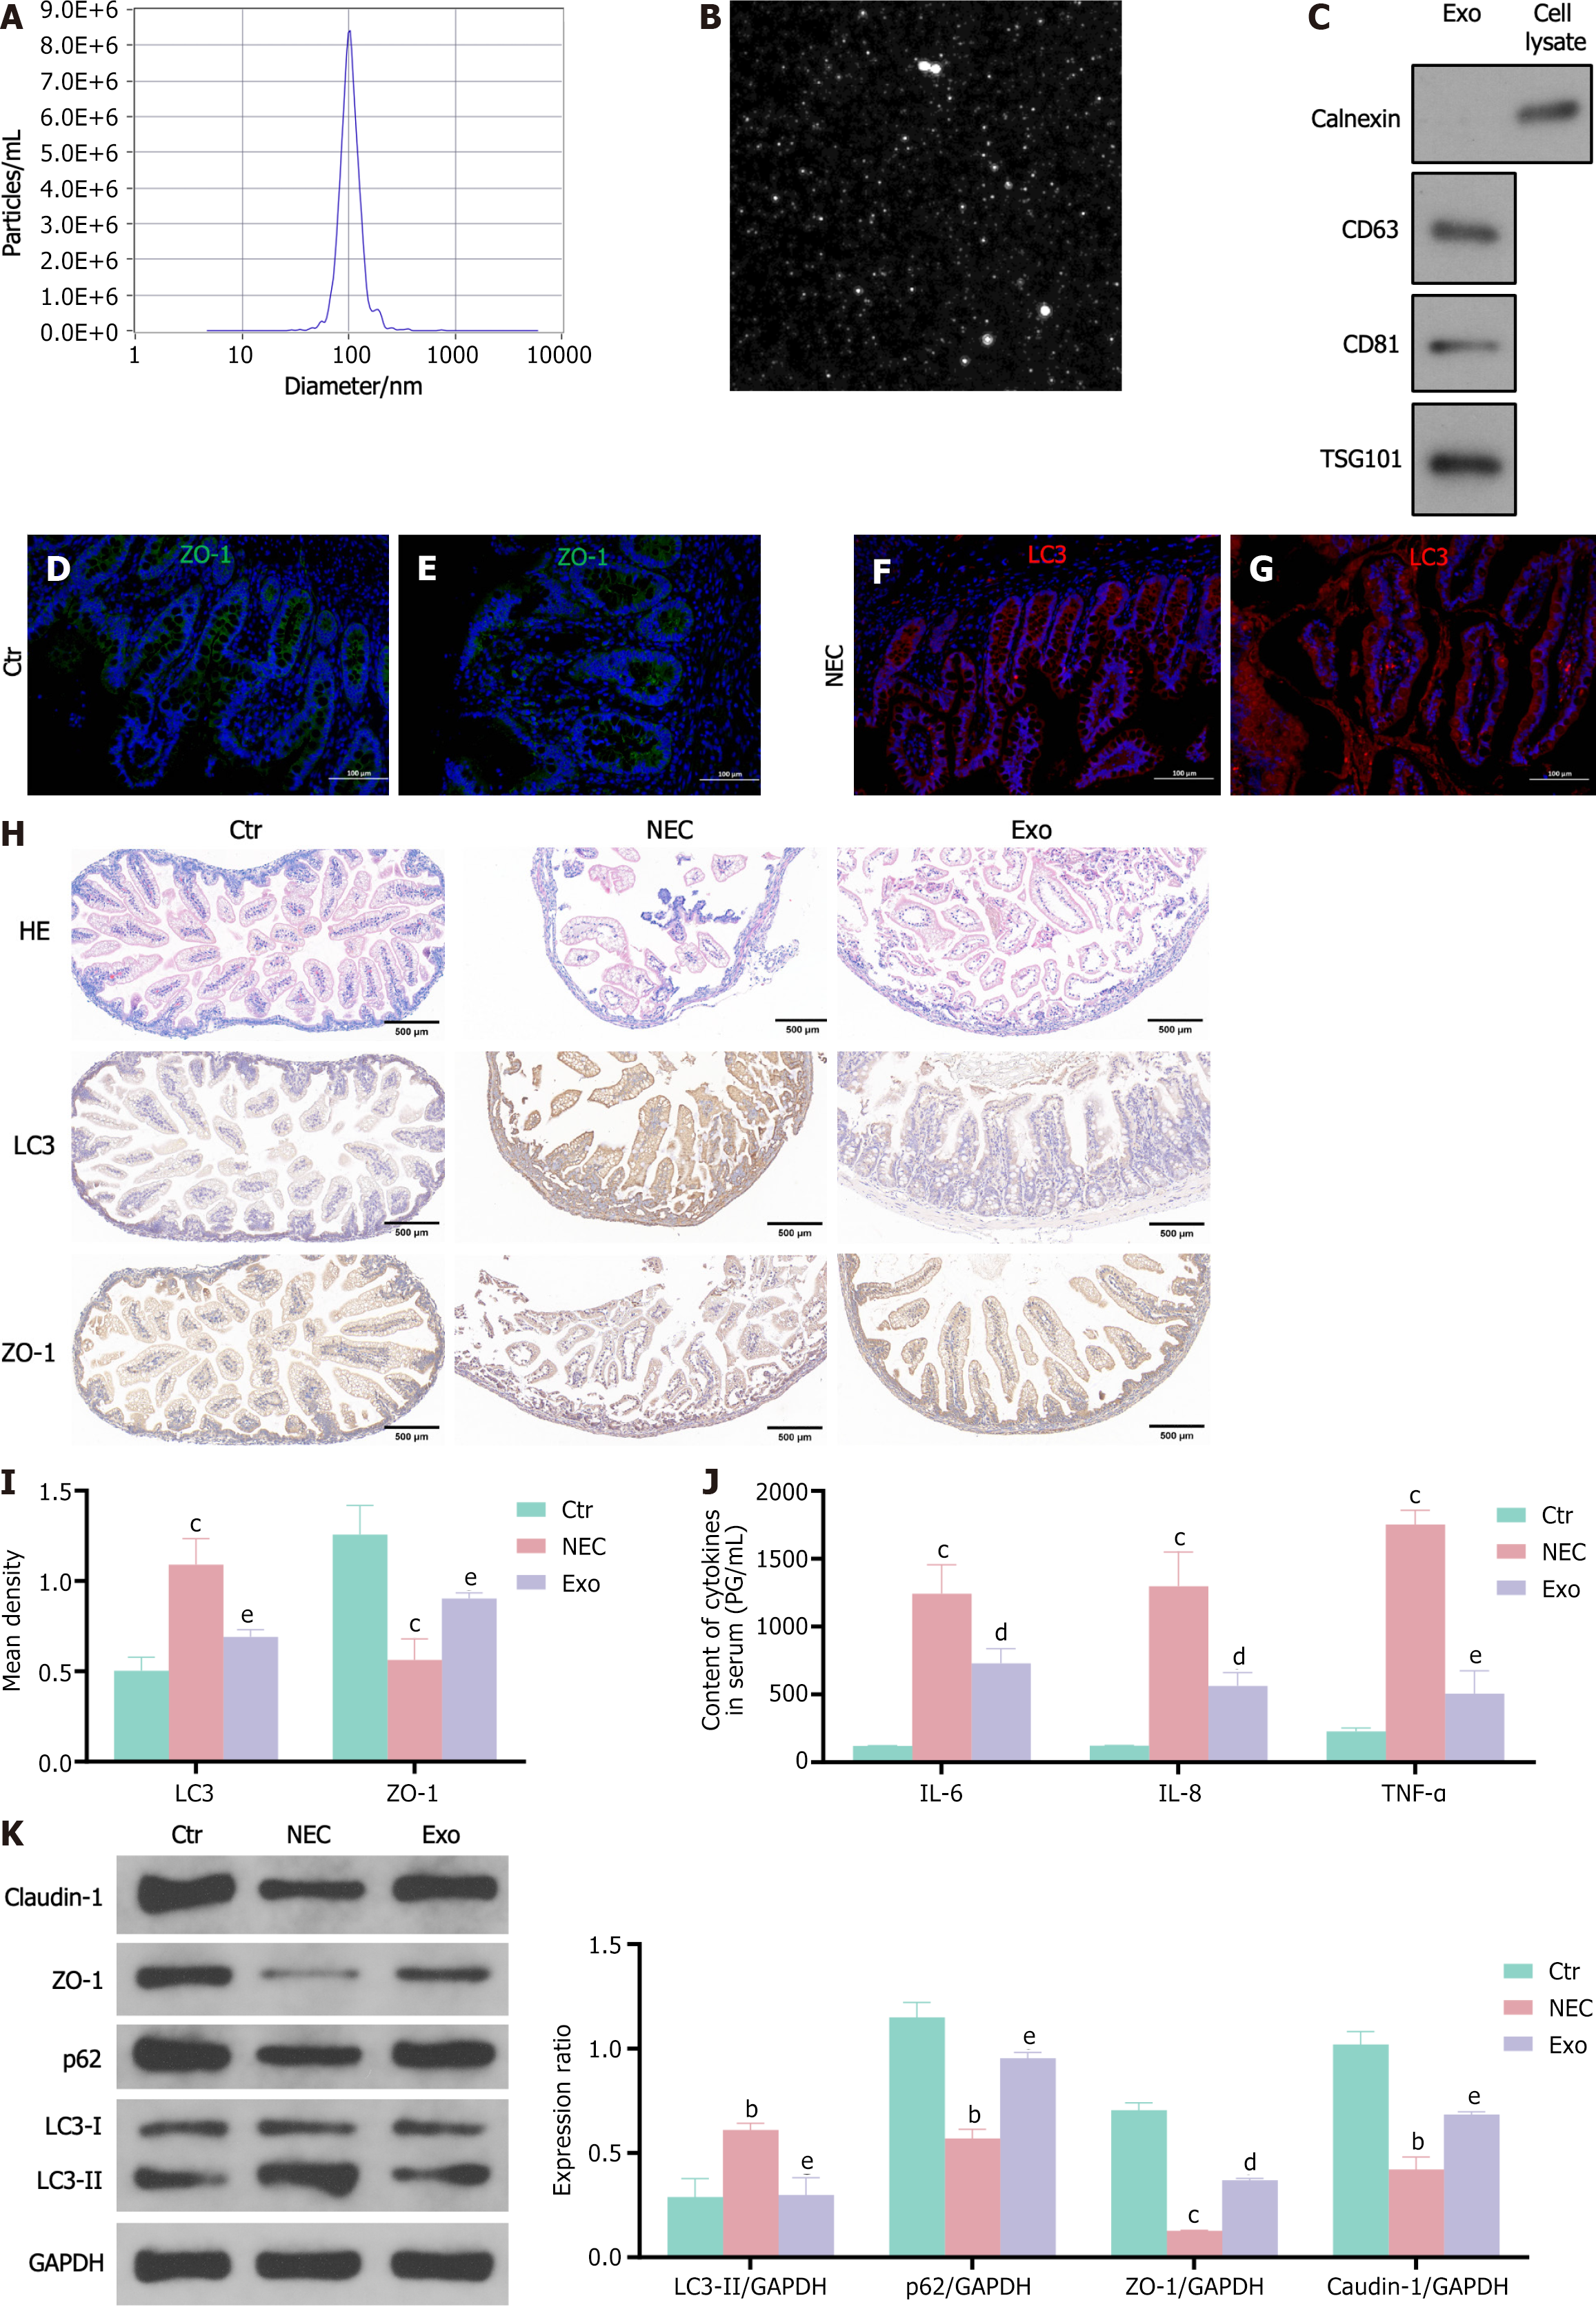
Figure 1 Intestinal epithelial cells autophagy increases and tight junction protein expression decreases in necrotizing enterocolitis neonates.
Human umbilical cord mesenchymal stem cell exosomes reduce autophagy and increase tight junction protein expression in the small intestine tissue of necrotizing enterocolitis mice. A-G: Exosomes particle size analysis (nanoparticle tracking analysis method) analyzes the size of human umbilical cord mesenchymal stem cell exosomes (hUCMSCs-exos) vesicles (A); morphology of isolated exosomes using transmission electron microscopy (B); expression levels of TSG101, CD81, CD63, and calnexin in hUCMSCs-exos were detected by western blot (C); expression of the intestinal epithelial cell-specific protein ZO-1 in neonatal colon tissue (green fluorescence) (D and E); expression of the autophagy protein LC3 in intestinal epithelial cells in neonatal colon tissue (red fluorescence), scale bar, 100 μm (F and G); H and I: Hematoxylin-eosin and immunohistochemical staining of LC3 and p62 in mouse distal ileum. Scale bar = 500 μm; J: Inflammatory factor levels in mice serum was detected by enzyme-linked immunosorbent assay; K: Western blot detects autophagy (LC3, p62) and tight junction (ZO-1, claudin-1) protein expression in mouse distal ileum tissue. Data was expressed as mean ± SEM of three or six independent experiments. bP < 0.01 vs control group, cP < 0.001 vs control group, dP < 0.05 vs necrotizing enterocolitis, eP < 0.01 vs necrotizing enterocolitis. NEC: Necrotizing enterocolitis; Ctr: Control; IL: Interleukin; TNF: Tumor necrosis factor.
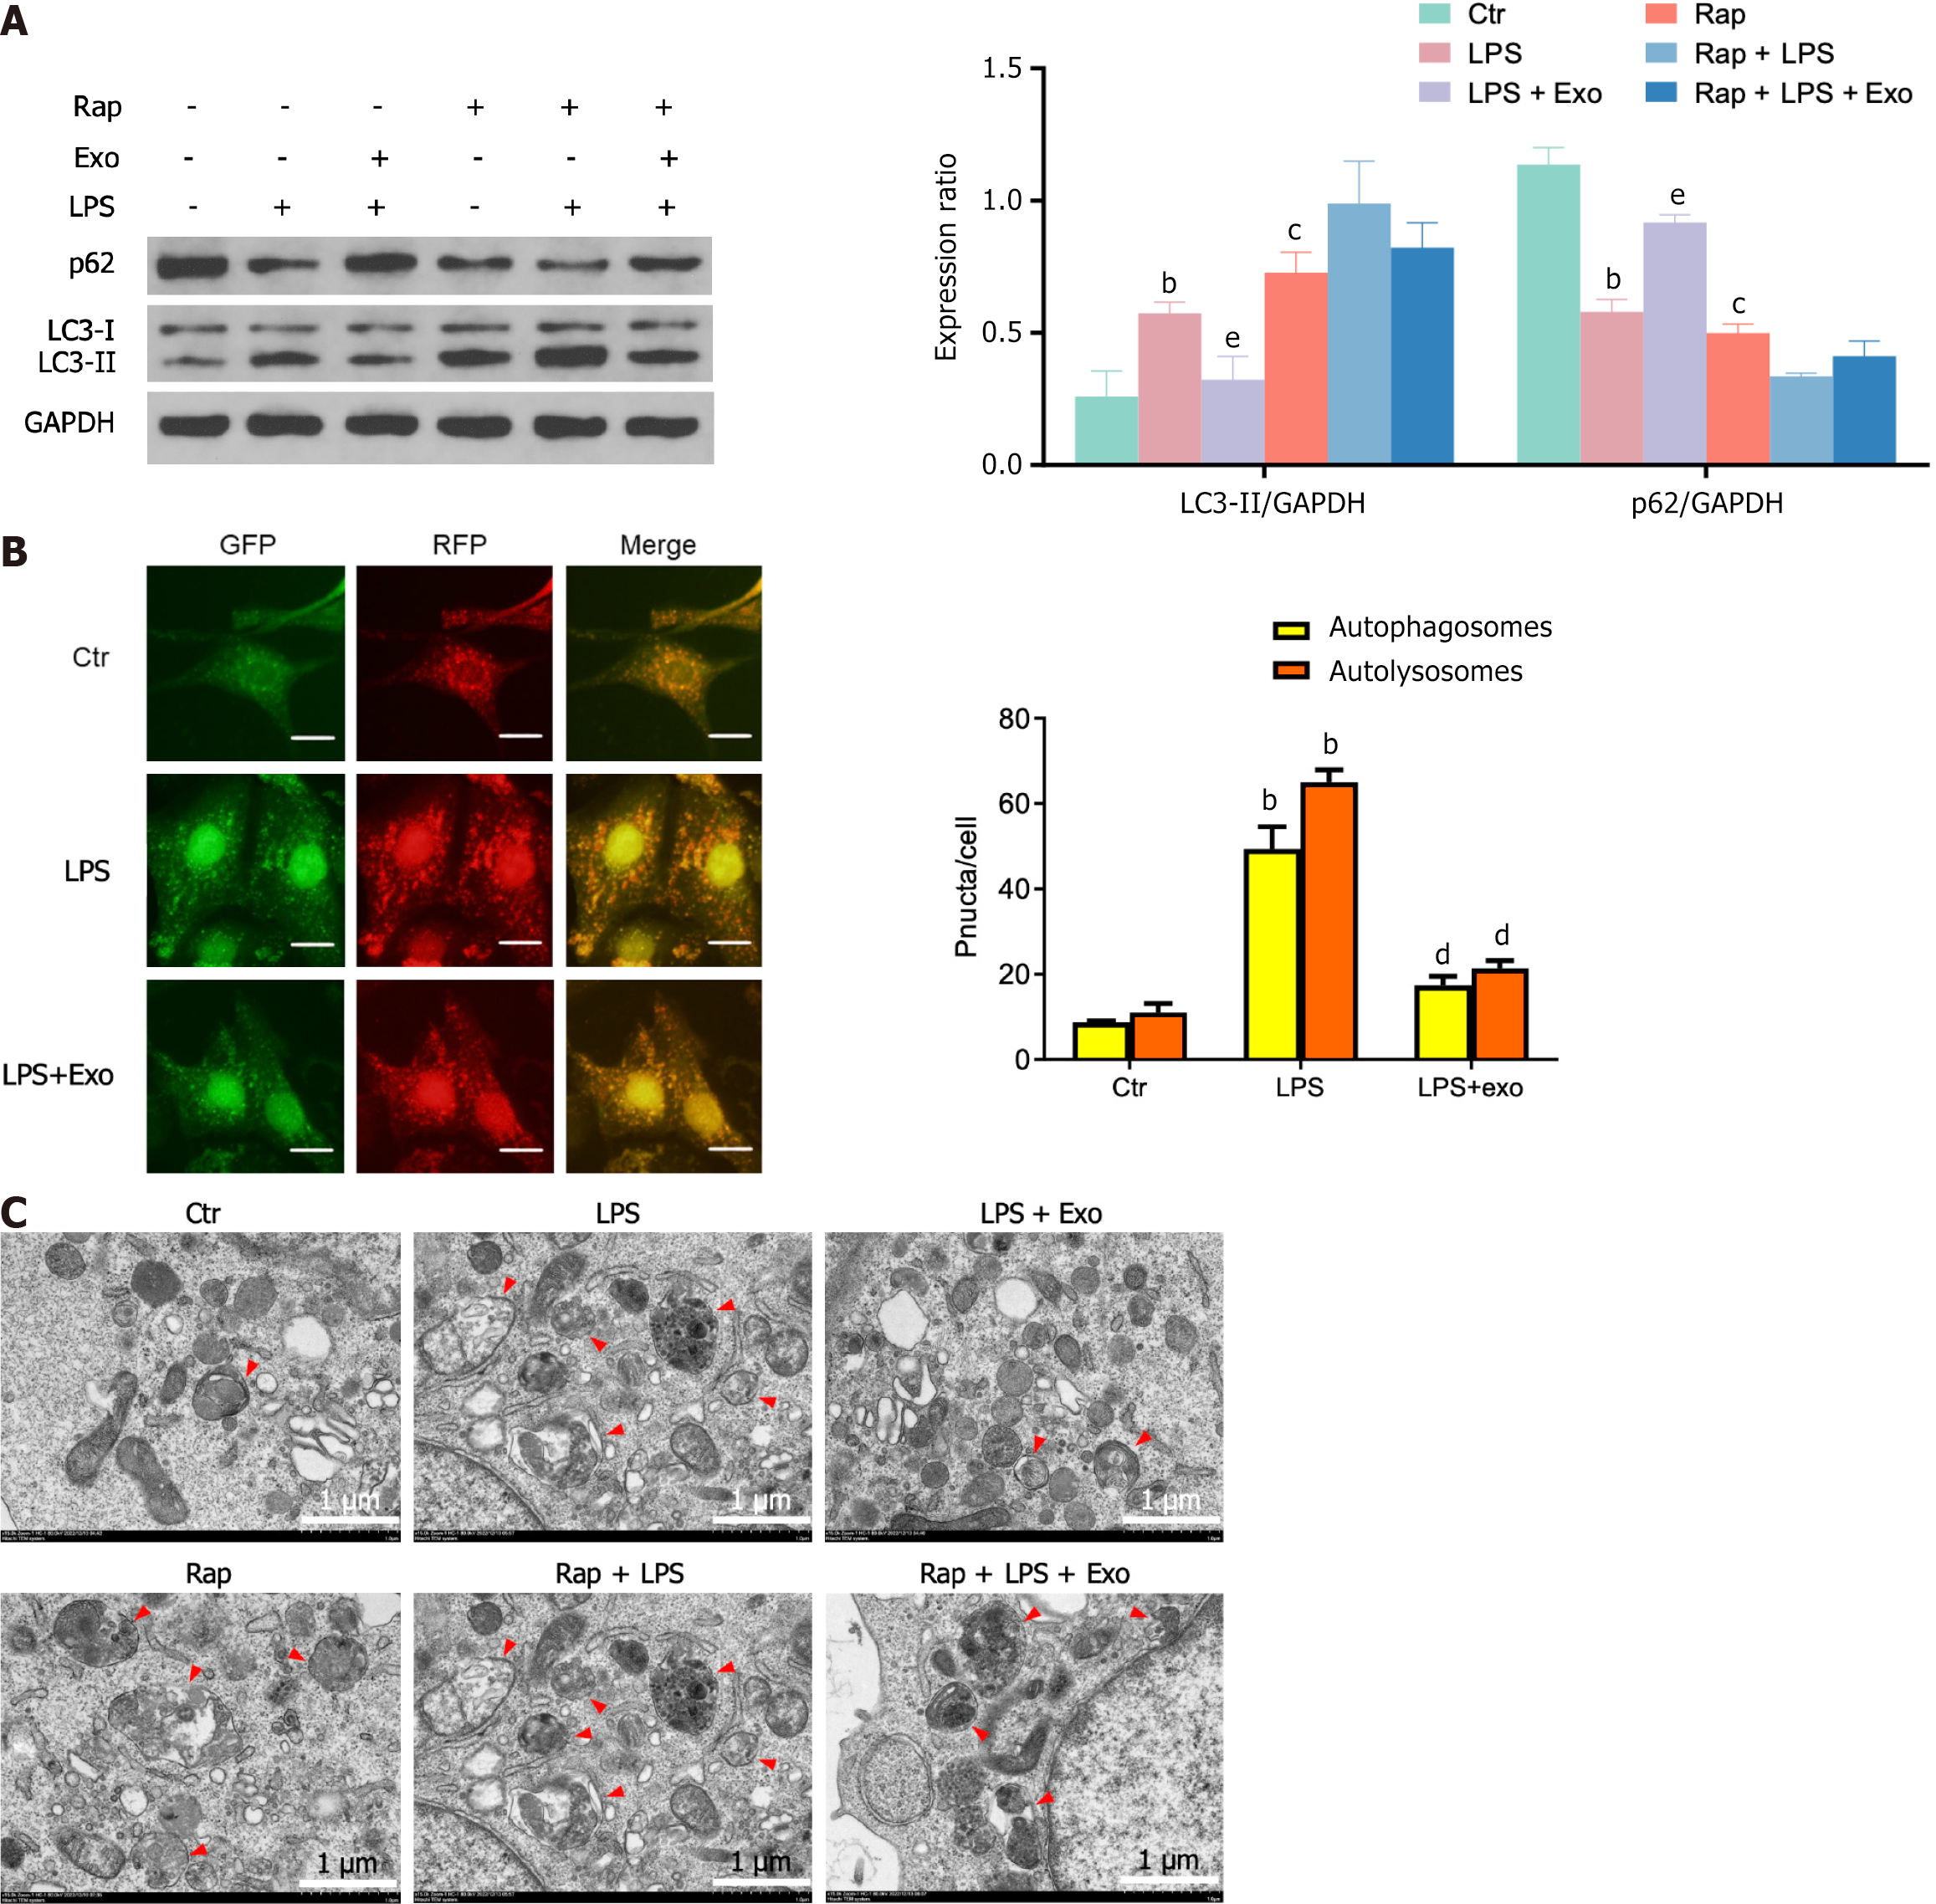
Figure 2 Human umbilical cord mesenchymal stem cell exosomes attenuate lipopolysaccharide-induced autophagy in intestinal epithelial cells.
A: The expression of p62 and LC3 in each cell group was determined by western blotting; B: IEC-18 cells were infected with Ad-mRFP-GFP-LC3 for 48 h and photographed with the confocal microscopy. Representative mRFP-LC3, GFP-LC3 and merge images were shown. The number of GFP-LC3 dots and mRFP-LC3 dots per cell were counted to quantify the number of autophagosomes (yellow dots) and autolysosomes (red dots) per cell; C: The ultrastructure of IEC-18 cells was presented by transmission electron microscopy, with red arrows indicating degradative autophagic vacuoles. The scale bar represents 1 μm. Data was expressed as mean ± SEM of three or six independent experiments. bP < 0.01 vs control group, cP < 0.001 vs control group; dP < 0.05 vs lipopolysaccharide, eP < 0.01 vs lipopolysaccharide. LPS: Lipopolysaccharide.
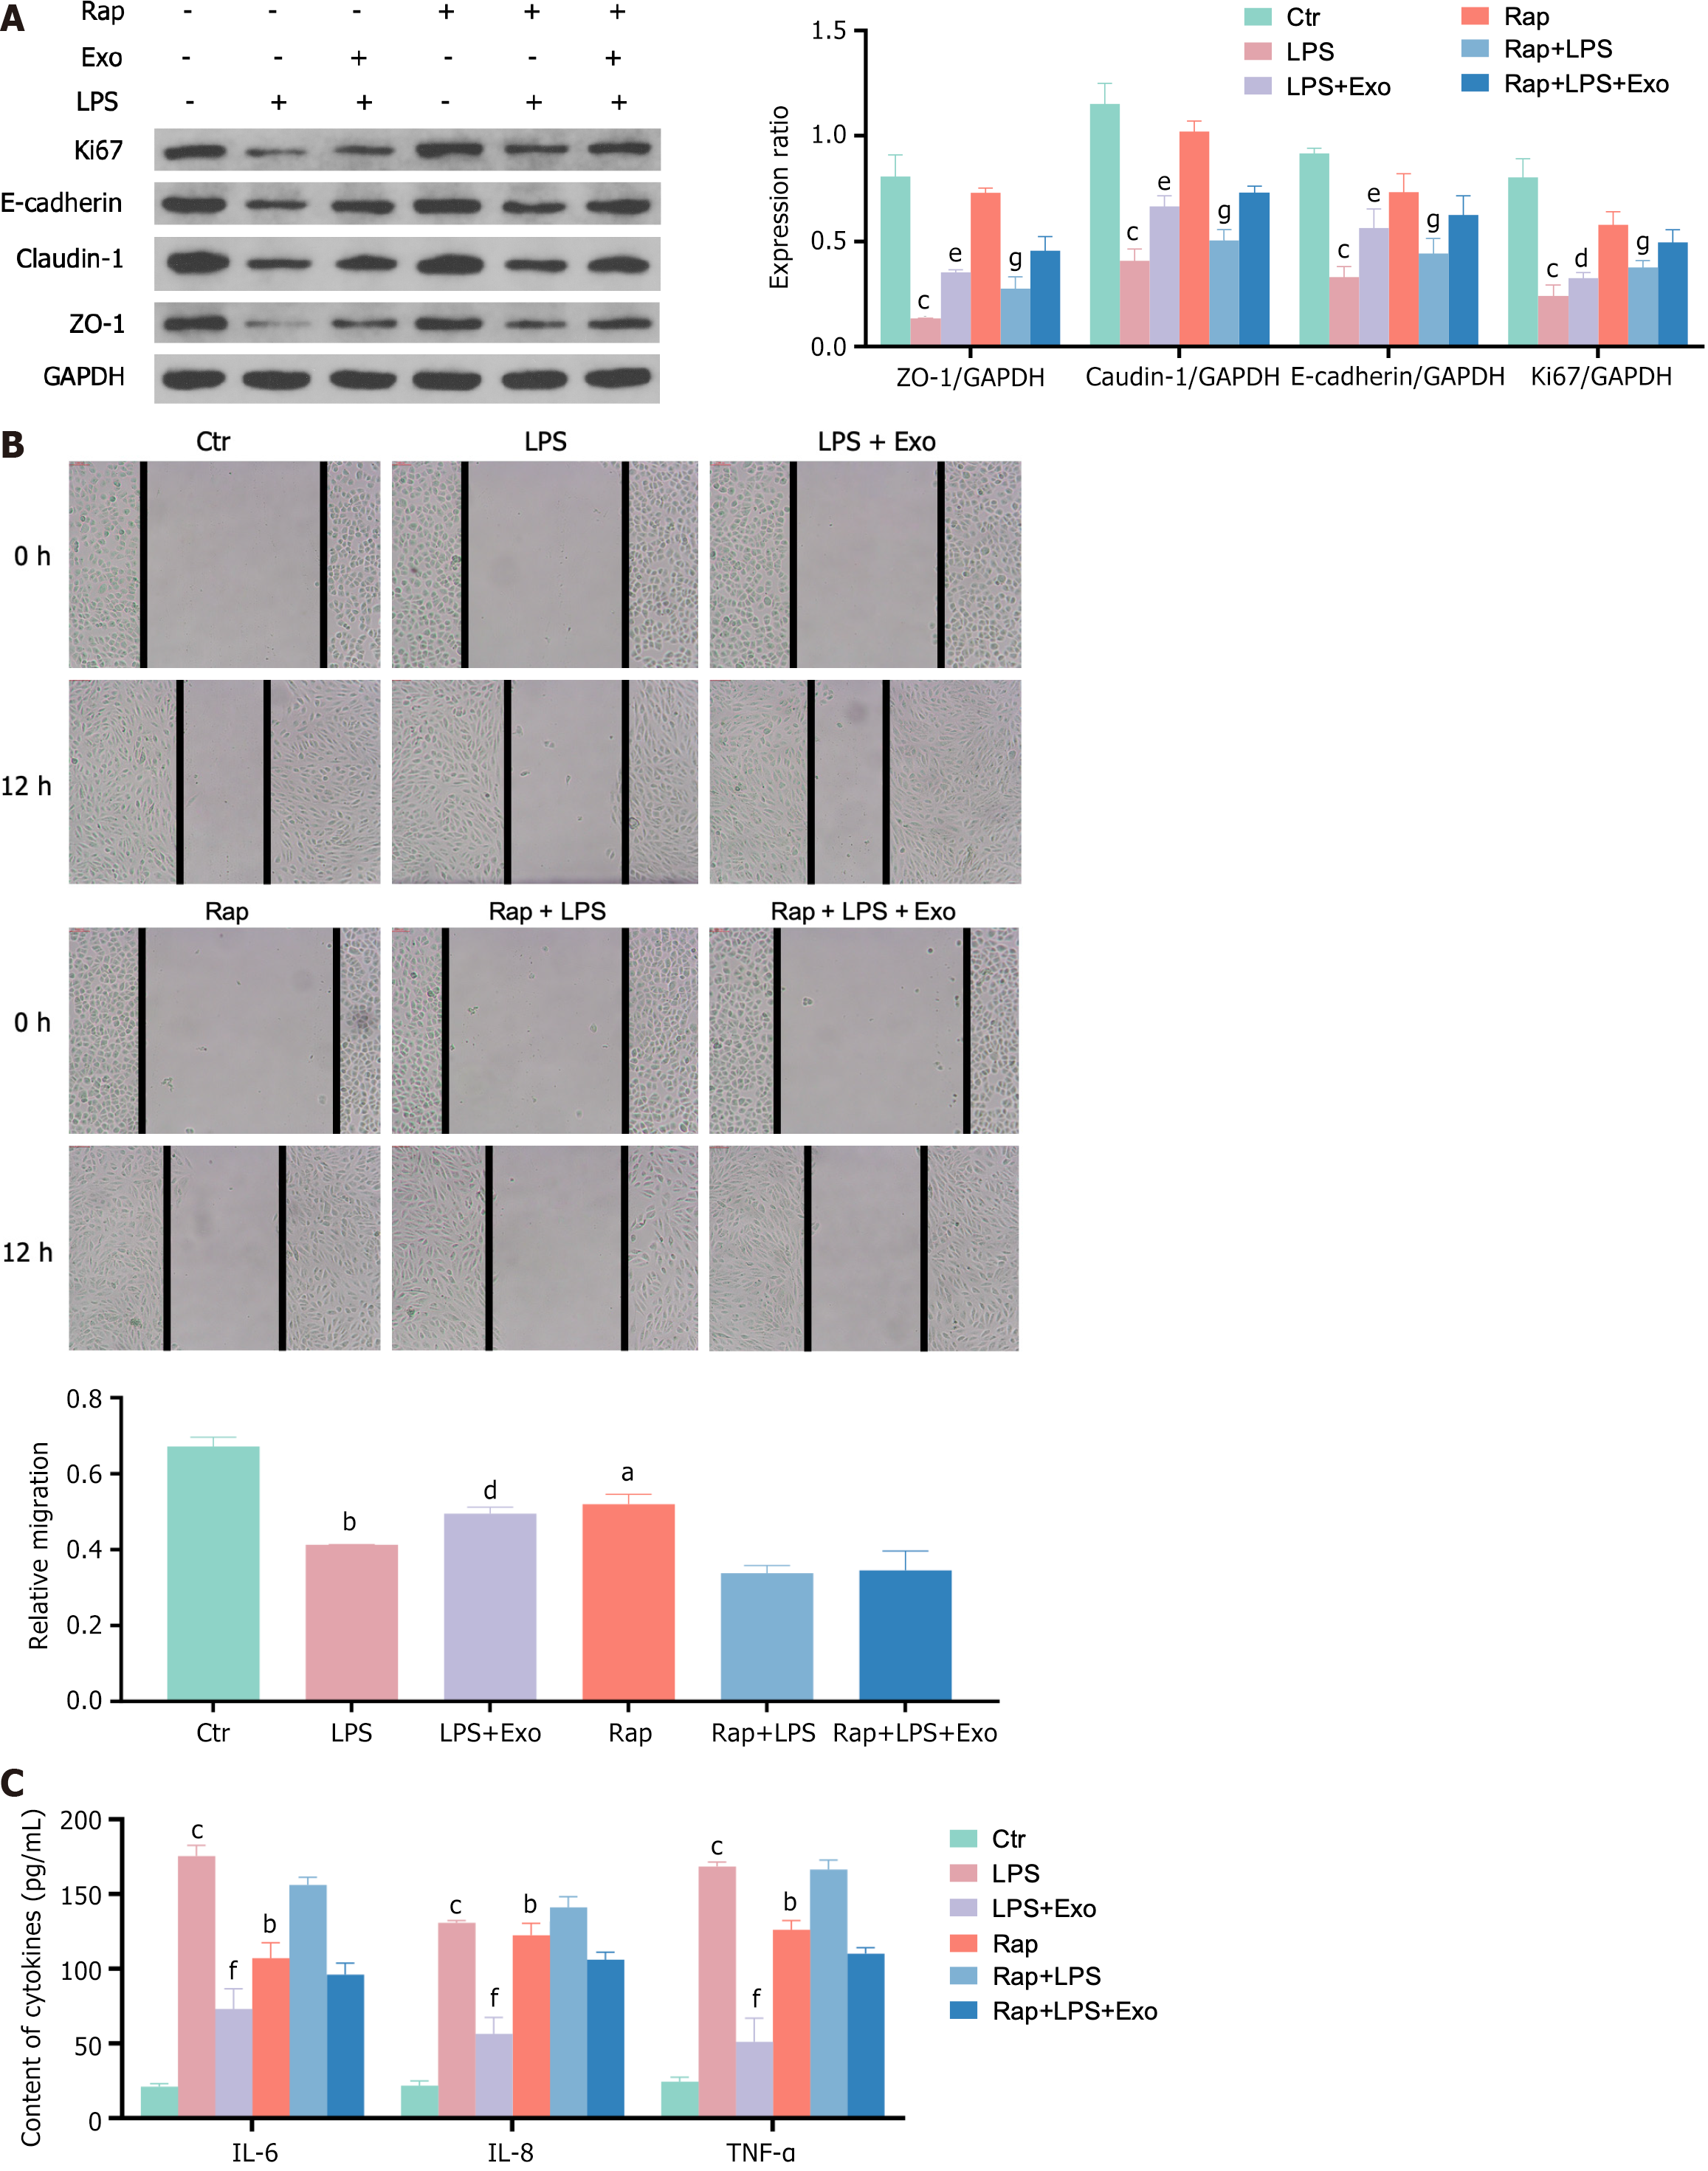
Figure 3 Human umbilical cord mesenchymal stem cell exosomes attenuate inflammation and injury induced by lipopolysaccharide and enhance the migration ability of intestinal epithelial cells by regulating autophagy.
A: The expression of tight junction proteins (ZO-1, claudin-1 and E-cadherin) and cell proliferation proteins in each cell group was determined by western blotting; B: Migration ability of IEC-18 was detected by wound healing assay; C: Inflammatory factor levels in cell supernatants were detected by enzyme-linked immunosorbent assay. Data was expressed as mean ± SEM of three or six independent experiments. aP < 0.05 vs control group, bP < 0.01 vs control group, cP < 0.001 vs control group; dP < 0.05 vs lipopolysaccharide, eP < 0.01 vs lipopolysaccharide, fP < 0.001 vs lipopolysaccharide; gP < 0.01 vs Rap. LPS: Lipopolysaccharide; Ctr: Control; IL: Interleukin; TNF: Tumor necrosis factor.
- Citation: Zhu L, He L, Duan W, Yang B, Li N. Umbilical cord mesenchymal stem cell exosomes alleviate necrotizing enterocolitis in neonatal mice by regulating intestinal epithelial cells autophagy. World J Stem Cells 2024; 16(6): 728-738
- URL: https://www.wjgnet.com/1948-0210/full/v16/i6/728.htm
- DOI: https://dx.doi.org/10.4252/wjsc.v16.i6.728


