Copyright
©The Author(s) 2024.
World J Stem Cells. Jun 26, 2024; 16(6): 690-707
Published online Jun 26, 2024. doi: 10.4252/wjsc.v16.i6.690
Published online Jun 26, 2024. doi: 10.4252/wjsc.v16.i6.690
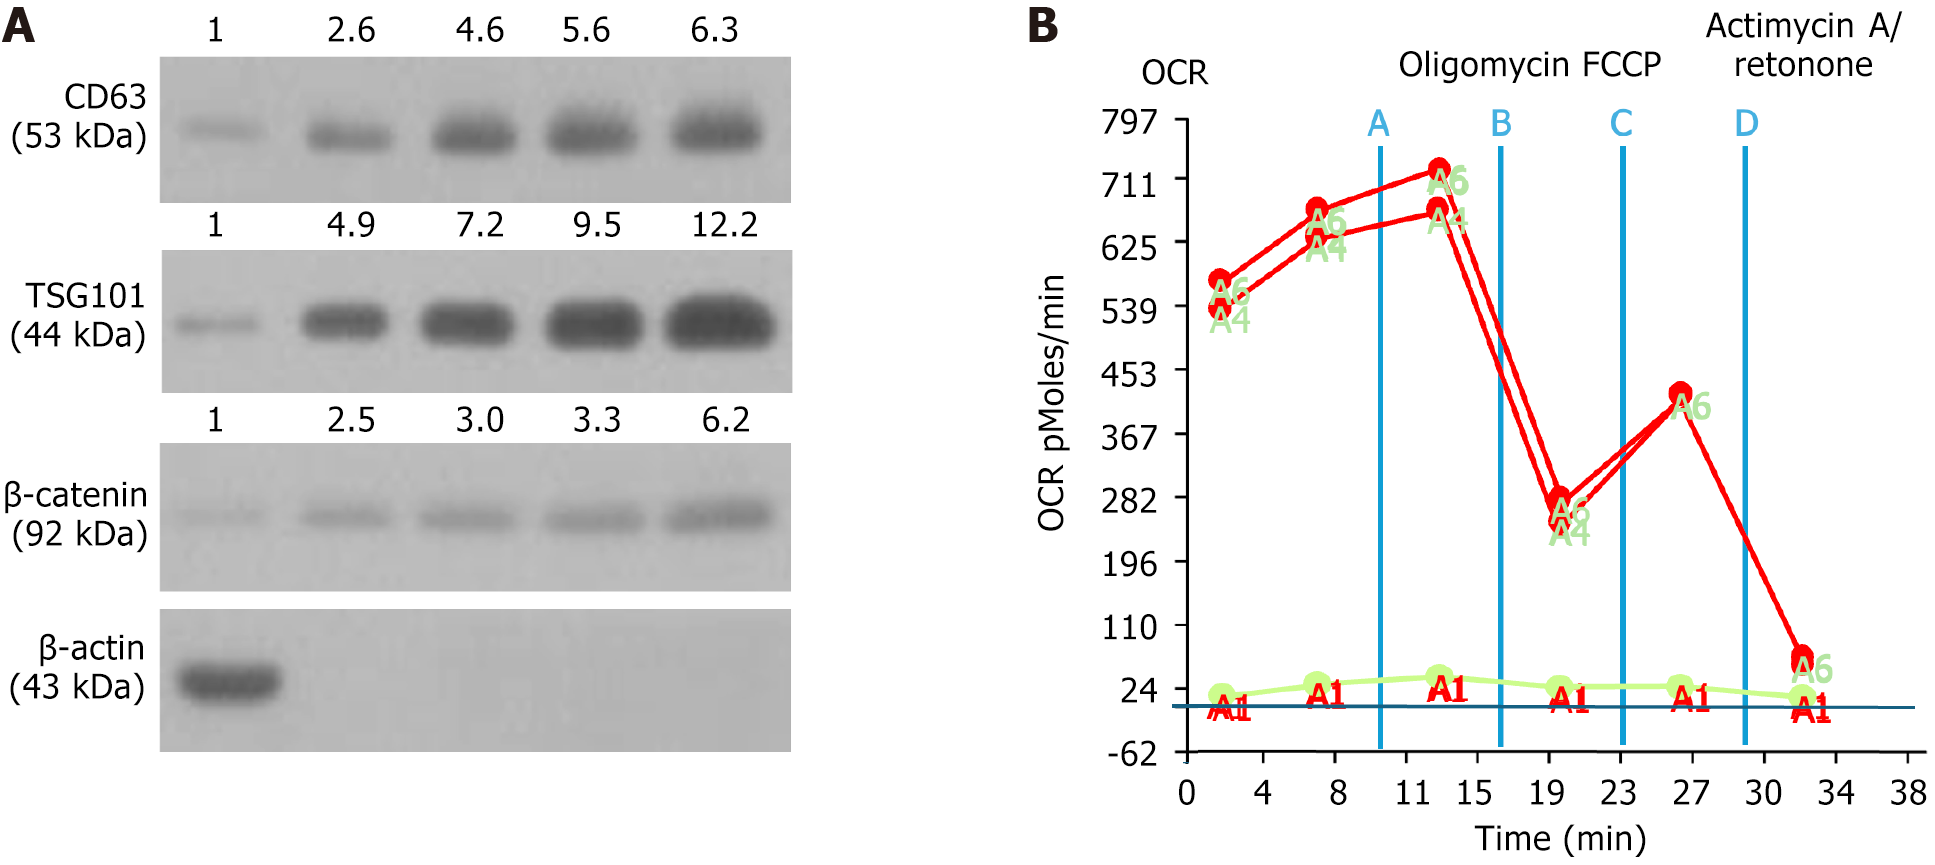
Figure 1 Qualitative exosome biomarkers and oxygen consumption rate of mitochondria.
A: Illustrating the protein expressions of CD63, TSG101 and β-catenin. The result showed that the protein expressions of these three fundamental biomarkers of exosome were notably progressively increased as the concentration of exosomes was stepwise increased from 1 μg, 2 μg, 10 μg, to 50 μg; B: Illustrating the oxygen consumption rate (OCR) curve; the result showed that the mitochondrial respiration reflected by the level of OCR was remarkably high, implicating that the isolated mitochondria had excellent functional integrity and efficacy. A: Untreated; B: Oligomycin; C: Carbonyl cyanide-p-trifluoromethoxyphenylhydrazone; D: Actinomycin A/rotenone. OCR: Oxygen consumption rate; FCCP: Carbonyl cyanide-p-trifluoromethoxyphenylhydrazone.
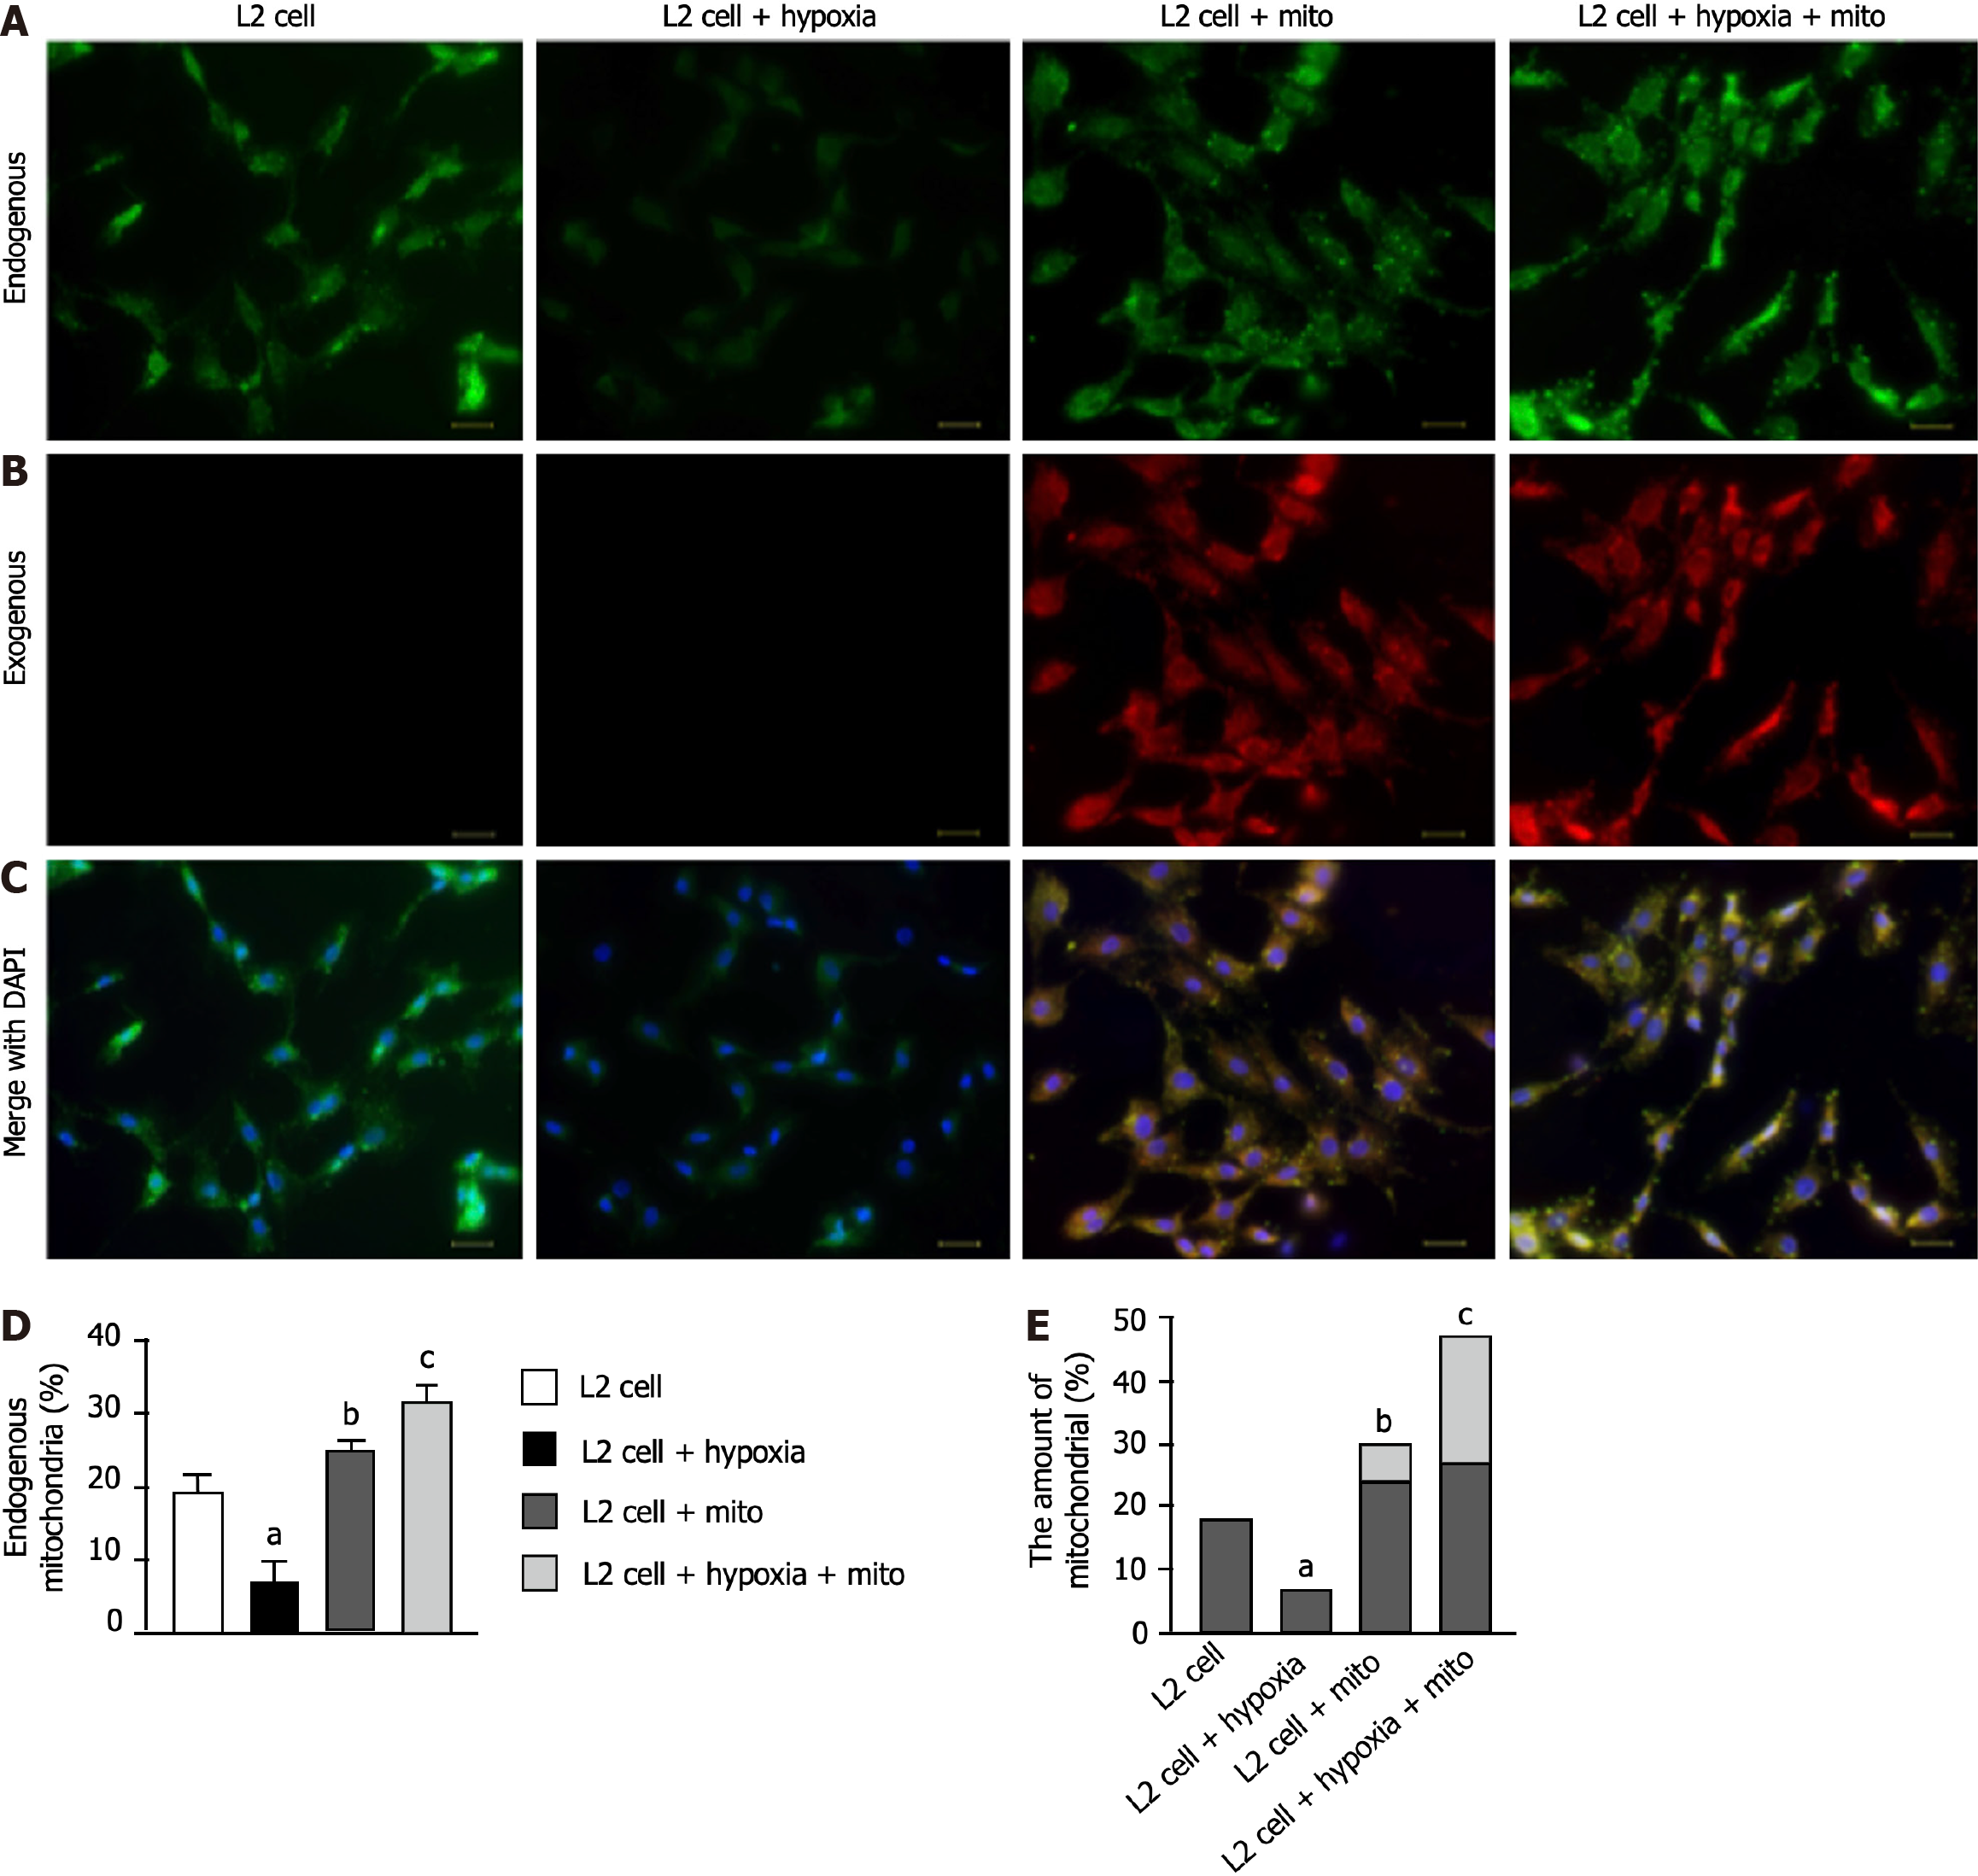
Figure 2 Immunofluorescent microscopic finding for elucidating the ability of exogenous mitochondria transfusion into the L2 cells.
A: Demonstrating MitoTracker stain (400 ×) for identifying endogenous mitochondria (green color) among four groups; B: Indicating the MitoTracker stain (400 ×) for identifying exogenous mitochondria to be transfused into the L2 cells (red color); C: Denoting the merged picture of a4 to b4 (i.e., endogenous and exogenous mitochondrial staining). Pink-yellow color indicated the endogenous and exogenous mitochondria colocalized together. Abundant mitochondria were found in c3 and c4 groups. Blue color in c1 to c4 indicated the DAPI stain (400 ×) for identifying rat lung epithelial cells (i.e., L2 cell line) in four groups. Scale bars in right lower corner represent 20 μm; D: Analytical result of endogenous mitochondrial expression (%); E: Analytical result of combined expression of endogenous and exogenous mitochondrial amount. Dark bar chart indicated percentage of endogenous mitochondria, whereas gray color indicated percentage of exogenous mitochondria. All statistical analyses were performed by one-way ANOVA, followed by Bonferroni multiple comparison post hoc test (n = 5 for each group). Control vs other groups with different letters, aP < 0.01, bP < 0.05, cP < 0.001. Grouping: L2 cells; L2 cells + hypoxia; L2 cells + mitochondria (100 μg); L2 cells + hypoxia + mitochondria (100 μg).
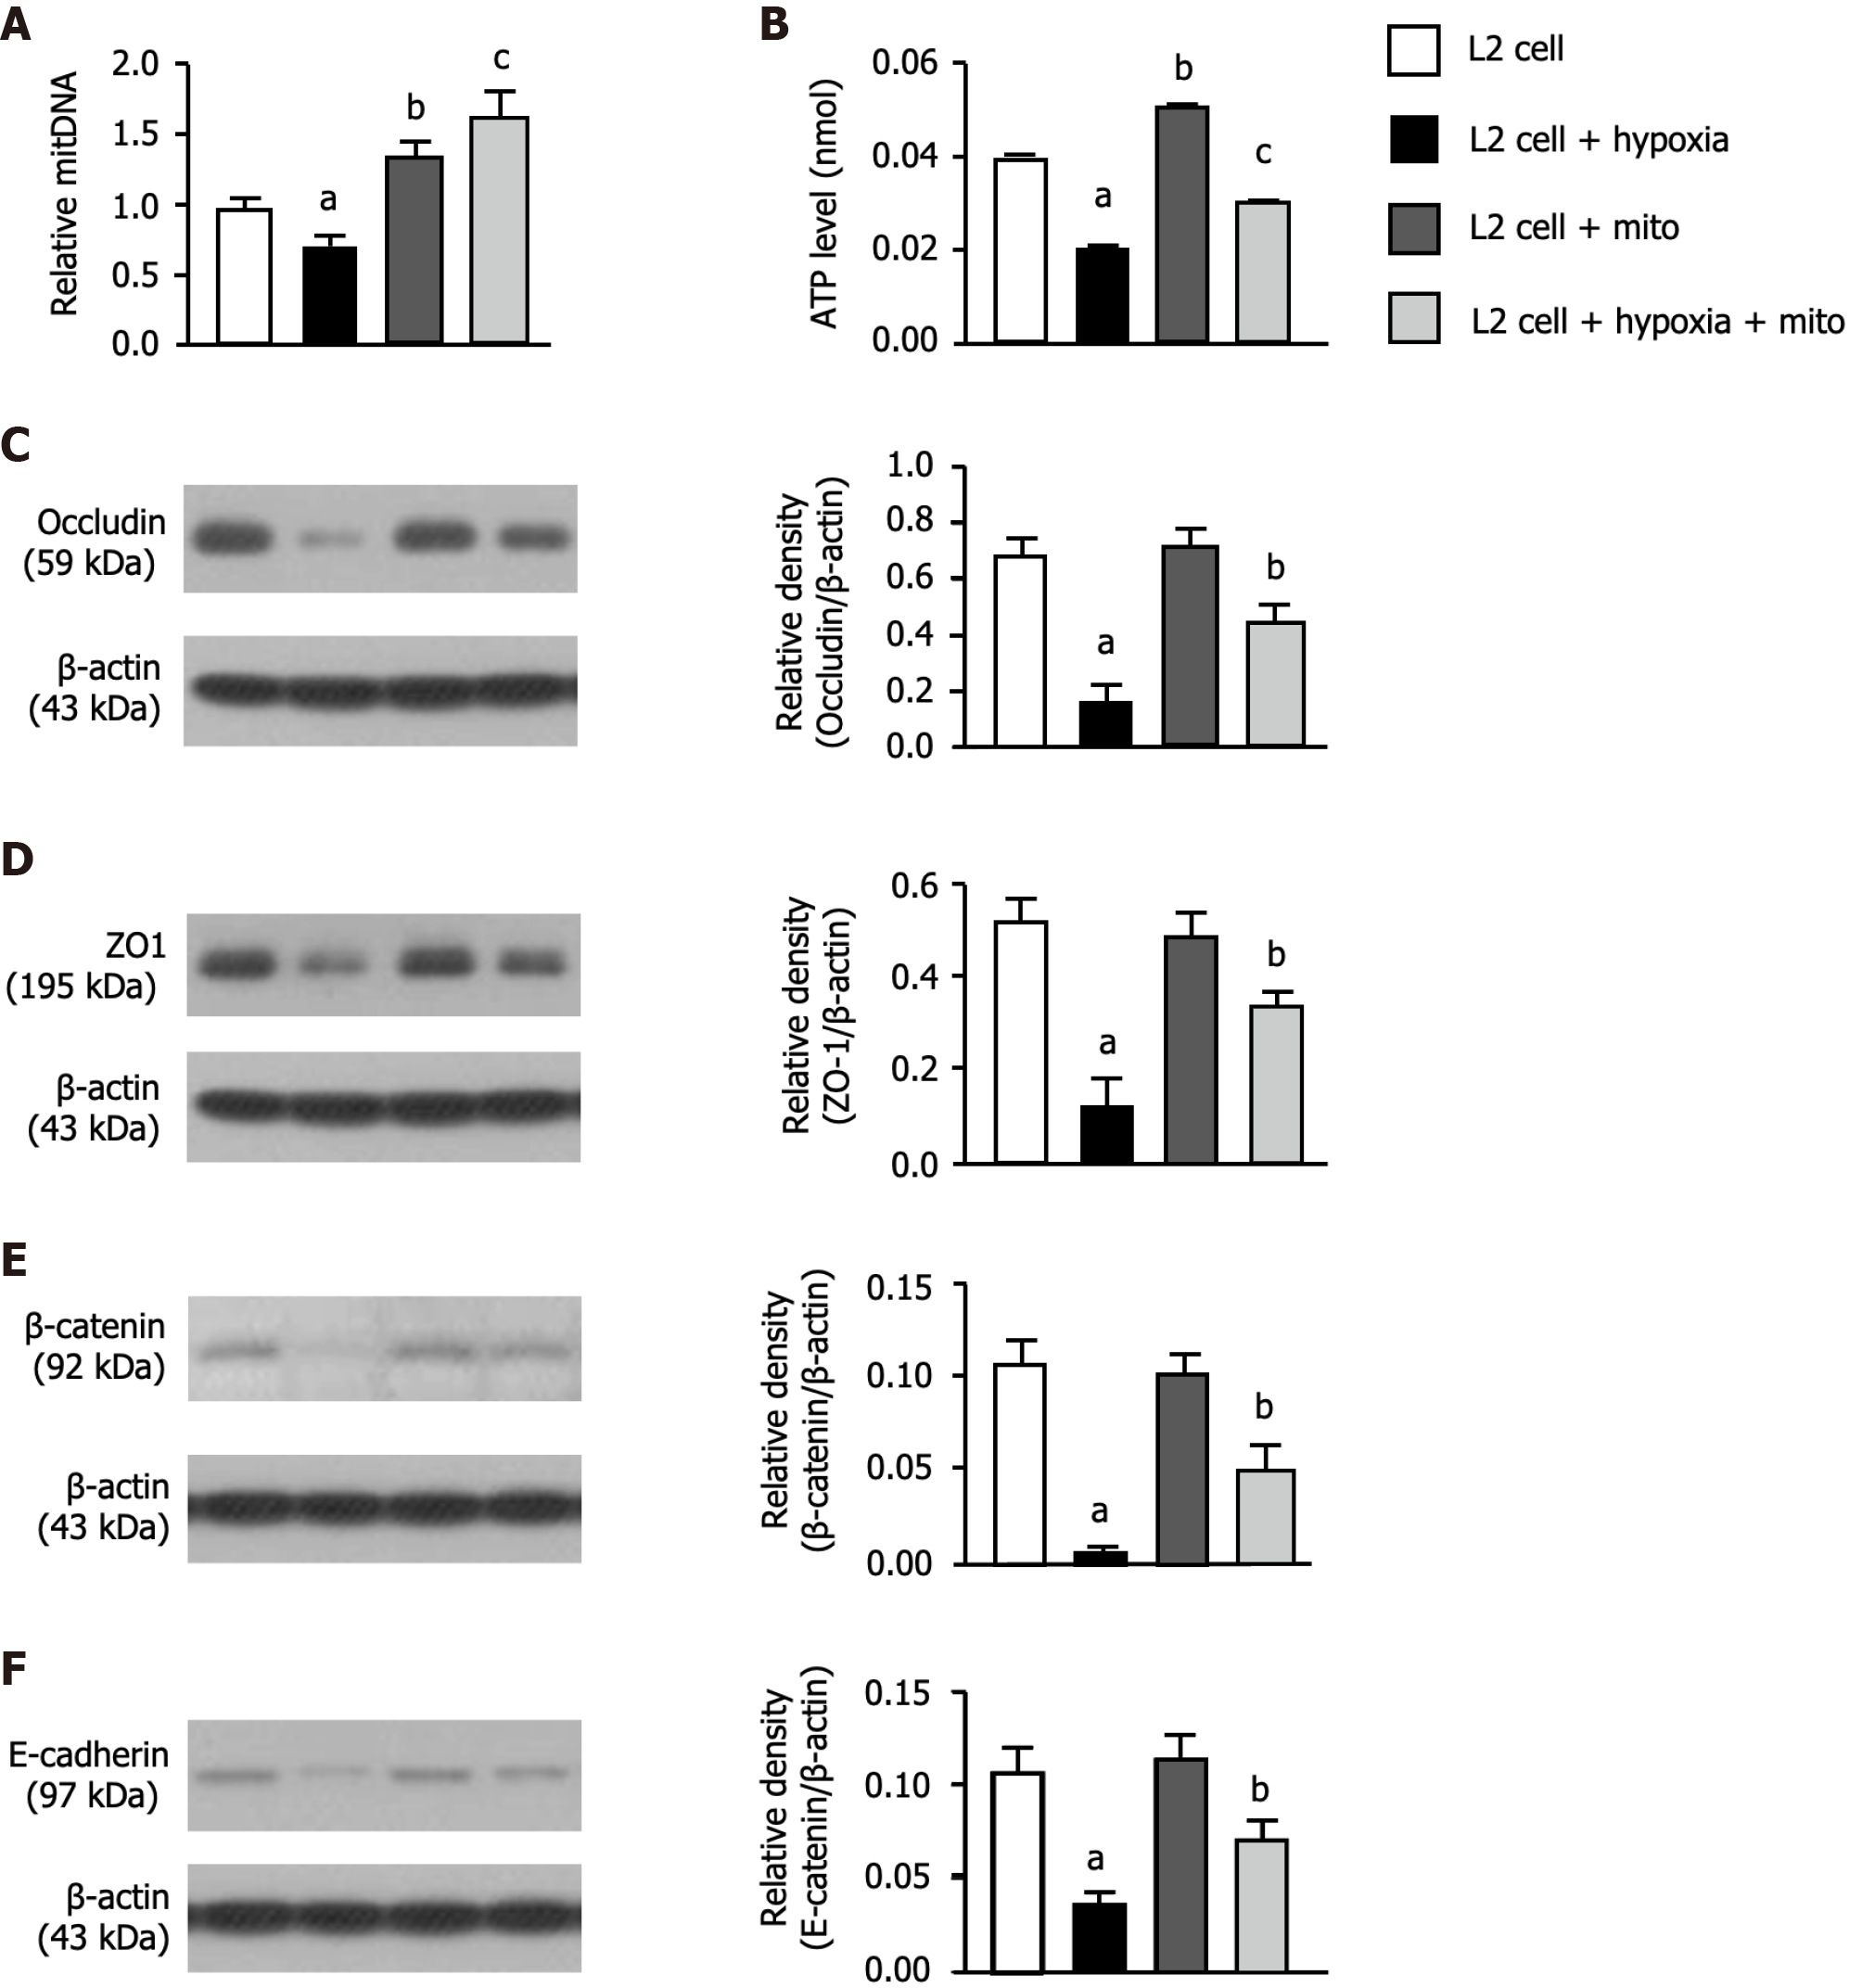
Figure 3 Protein expressions of cellular junctions, relative mitochondrial DNA expression and adenosine triphosphate concentration.
A: Relative mitochondrial DNA expression, control vs other groups with different letters, aP < 0.01, bP < 0.05, cP < 0.001 (n = 6 for each group); B: Concentration level of adenosine triphosphate, control vs other groups with different letters, aP < 0.01, bP < 0.05, cP < 0.001 (n = 6 for each group); C: Protein expression of occludin, control vs other groups with different symbols, aP < 0.001, bP < 0.01; D: Protein expression of β-catenin, control vs other groups with different letters, aP < 0.001, bP < 0.01; E: Protein expression of zonula occludens-1, control vs other groups with different letters, aP < 0.001, bP < 0.01; F: Protein expression of E-cadherin, control vs other groups with different letters, aP < 0.001, bP < 0.01 (n = 4 for each group). All statistical analyses were performed by one-way ANOVA, followed by Bonferroni multiple comparison post hoc test. Grouping: L2 cells; L2 cells + hypoxia; L2 cells + mitochondria (100 μg); L2 cells + hypoxia + mitochondria (100 μg).
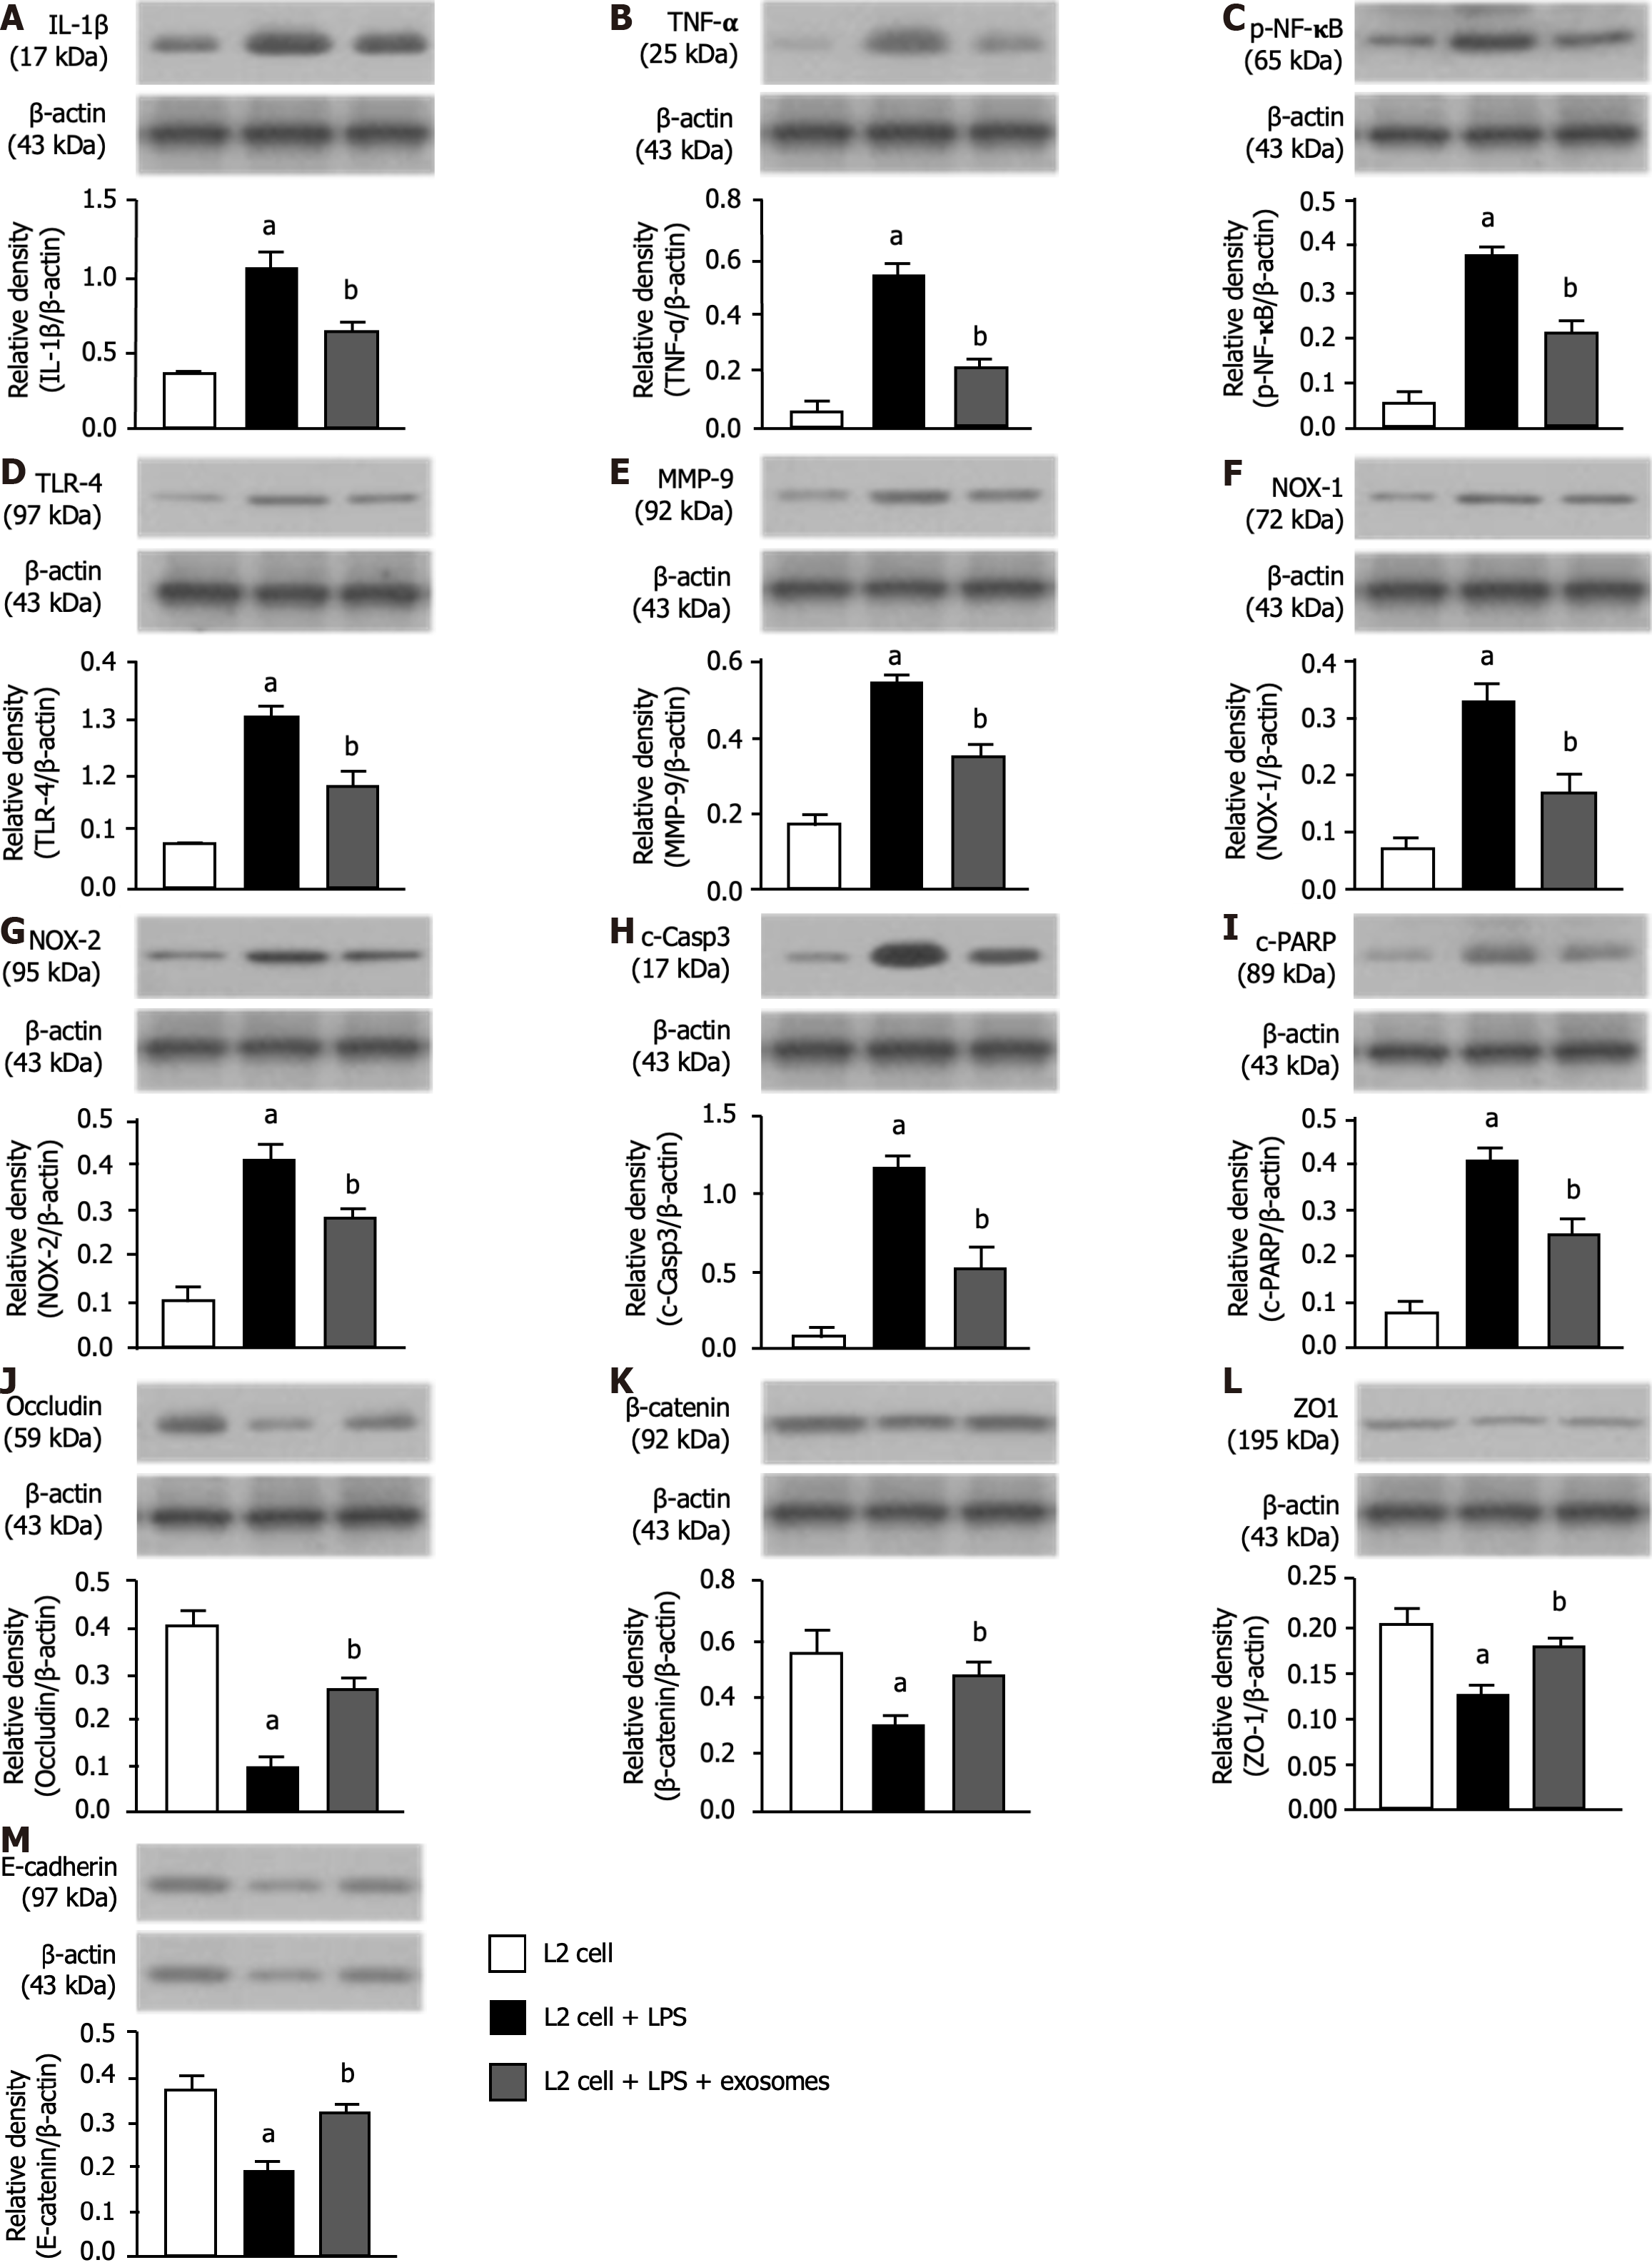
Figure 4 Exosomes therapy effectively reduced inflammation, oxidative stress and apoptosis and preserved the lung epithelial cell junctions.
A: Protein expression of interleukin-1β; B: Protein expression of tumor necrosis factor-α; C: Protein expression of nuclear factor-κB; D: Protein expression of toll-like receptor-4; E: Protein expression of matrix metalloproteinase-9; F: Protein expression of NOX-1; G: Protein expression of NOX-2; H: Protein expression of cleaved caspase 3; I: Protein expression of cleaved poly (ADP-ribose) polymerase; J: Protein expression of occludin; K: Protein expression of β-catenin; L: Protein expression of zonula occludens-1; M: Protein expression of E-cadherin. All statistical analyses were performed by one-way ANOVA, followed by Bonferroni multiple comparison post hoc test (n = 3 for each group). Control vs other groups with different letters, aP < 0.001, bP < 0.01. B1: L2 cells only; B2: L2 cells + lipopolysaccharide (LPS) (1.0 μg/mL); B3: L2 cells + LPS (1.0 μg/mL) + exosomes (10 μg). IL: Interleukin; TNF: Tumor necrosis factor; NF-κB: Nuclear factor NF-κB; TLR: Toll-like receptor; MMP: Matrix metalloproteinase; c-Casp3: Cleaved caspase 3; ZO-1: Zonula occludens-1; PARP: Poly (ADP-ribose) polymerase; LPS: lipopolysaccharide.
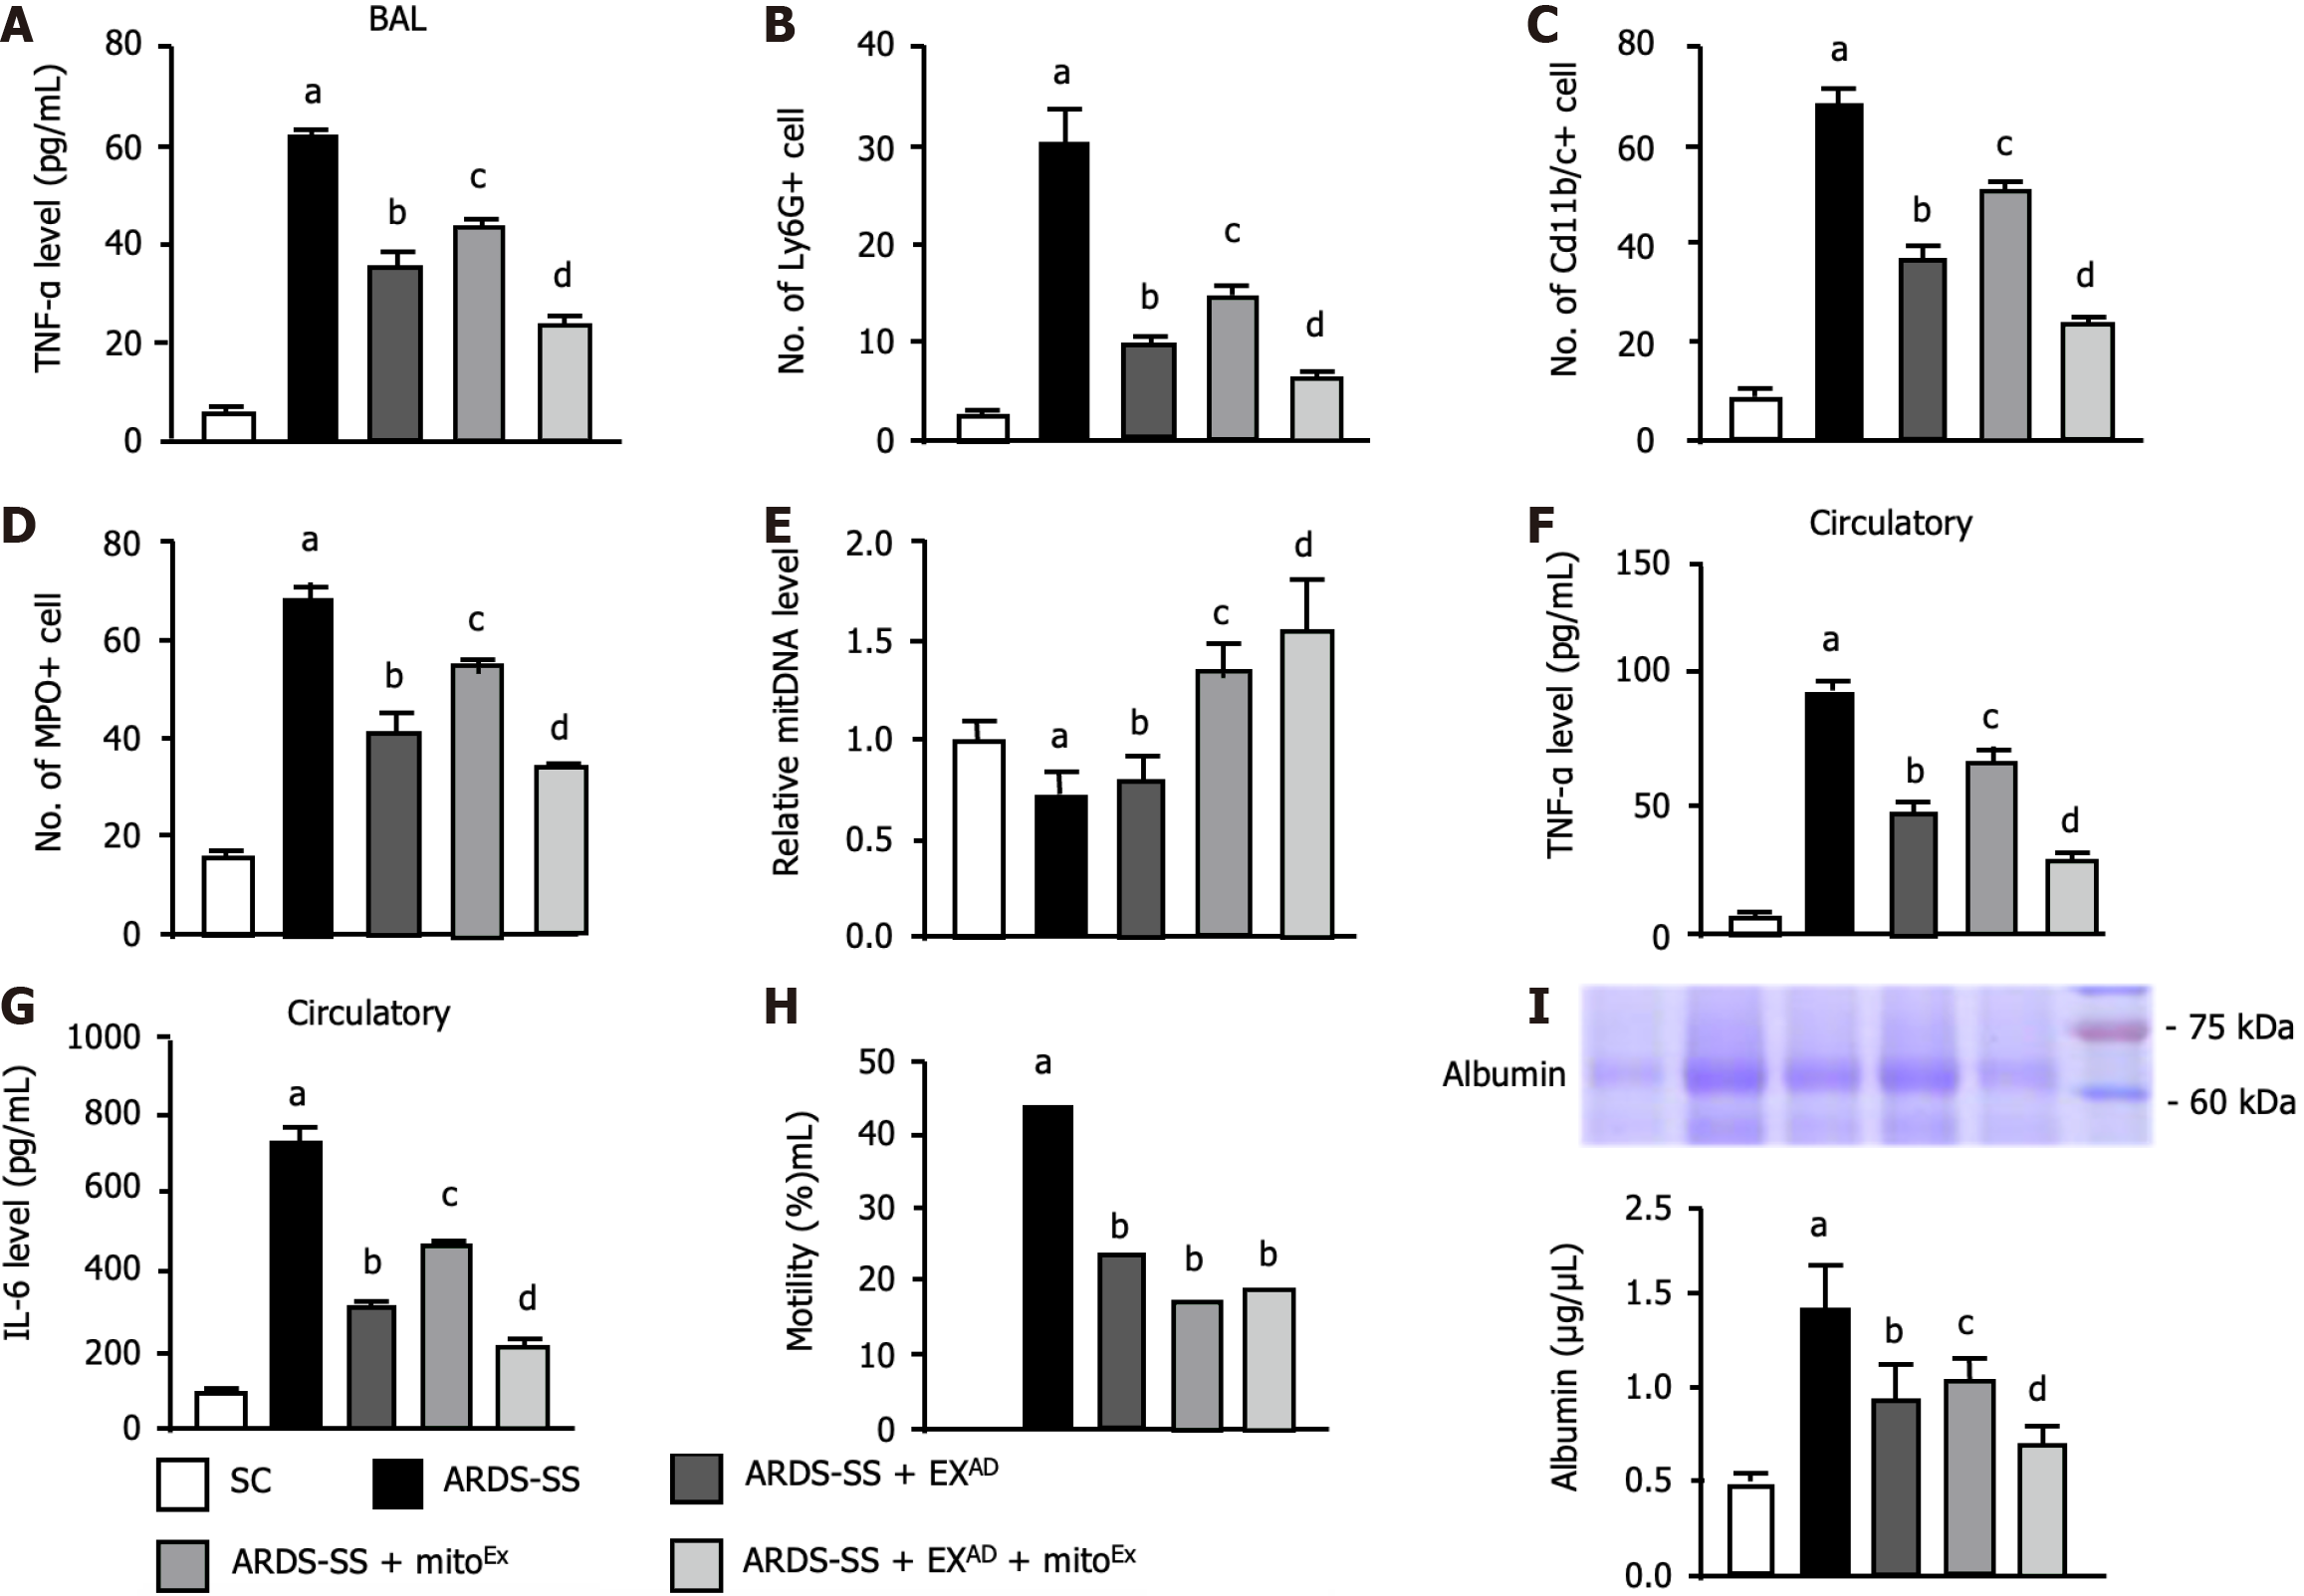
Figure 5 Levels of inflammatory cells and albumin in bronchoalveolar lavage fluid and circulatory proinflammatory cytokine by day 5 after acute respiratory distress syndrome induction.
A: Enzyme-linked immunosorbent assay analysis of tumor necrosis factor (TNF)-α level in bronchoalveolar lavage (BAL), control vs other groups with different letters, aP < 0.0001, bP < 0.01, cP < 0.05, dP < 0.001; B: Flow cytometric analysis of number of Ly6G+ cells, control vs other groups with different letters, aP < 0.0001, bP < 0.01, cP < 0.05, dP < 0.001; C: Flow cytometric analysis of number of CD11b/c+ cells, control vs other groups with different letters, aP < 0.0001, bP < 0.01, cP < 0.05, dP < 0.001; D: Flow cytometric analysis of number of myeloperoxidase+ cells, control vs other groups with different letters, aP < 0.0001, bP < 0.01, cP < 0.05, dP < 0.001; E: Relative mitochondrial DNA level, control vs other groups with different letters, aP < 0.01, bP < 0.05, cP < 0.001, dP < 0.0001; F: Circulatory level of TNF-α, control vs other groups with different letters, aP < 0.0001, bP < 0.05, cP < 0.01, dP < 0.001; G: Circulatory level of interleukin-6, control vs other groups with different letters, aP < 0.0001, bP < 0.05, cP < 0.01, dP < 0.001; H: The mortality rate by day 5 after acute respiratory distress syndrome induction, control vsaP < 0.05, control vsbP > 0.05; I: Analytical result of BAL albumin concentration, control vs other groups with different letters, aP < 0.0001, bP < 0.01, cP < 0.05, dP < 0.001. All statistical analyses were performed by one-way ANOVA, followed by Bonferroni multiple comparison post hoc test (n = 6 for each group). IL: Interleukin; TNF: Tumor necrosis factor; MPO: Myeloperoxidase; SC: Sham-operated control; ARDS: Acute respiratory distress syndrome; SS: Sepsis syndrome; mitoEx: Exogenous mitochondria; EXAD: Adipose-derived mesenchymal stem cells-derived exosomes; BAL: Bronchoalveolar lavage.
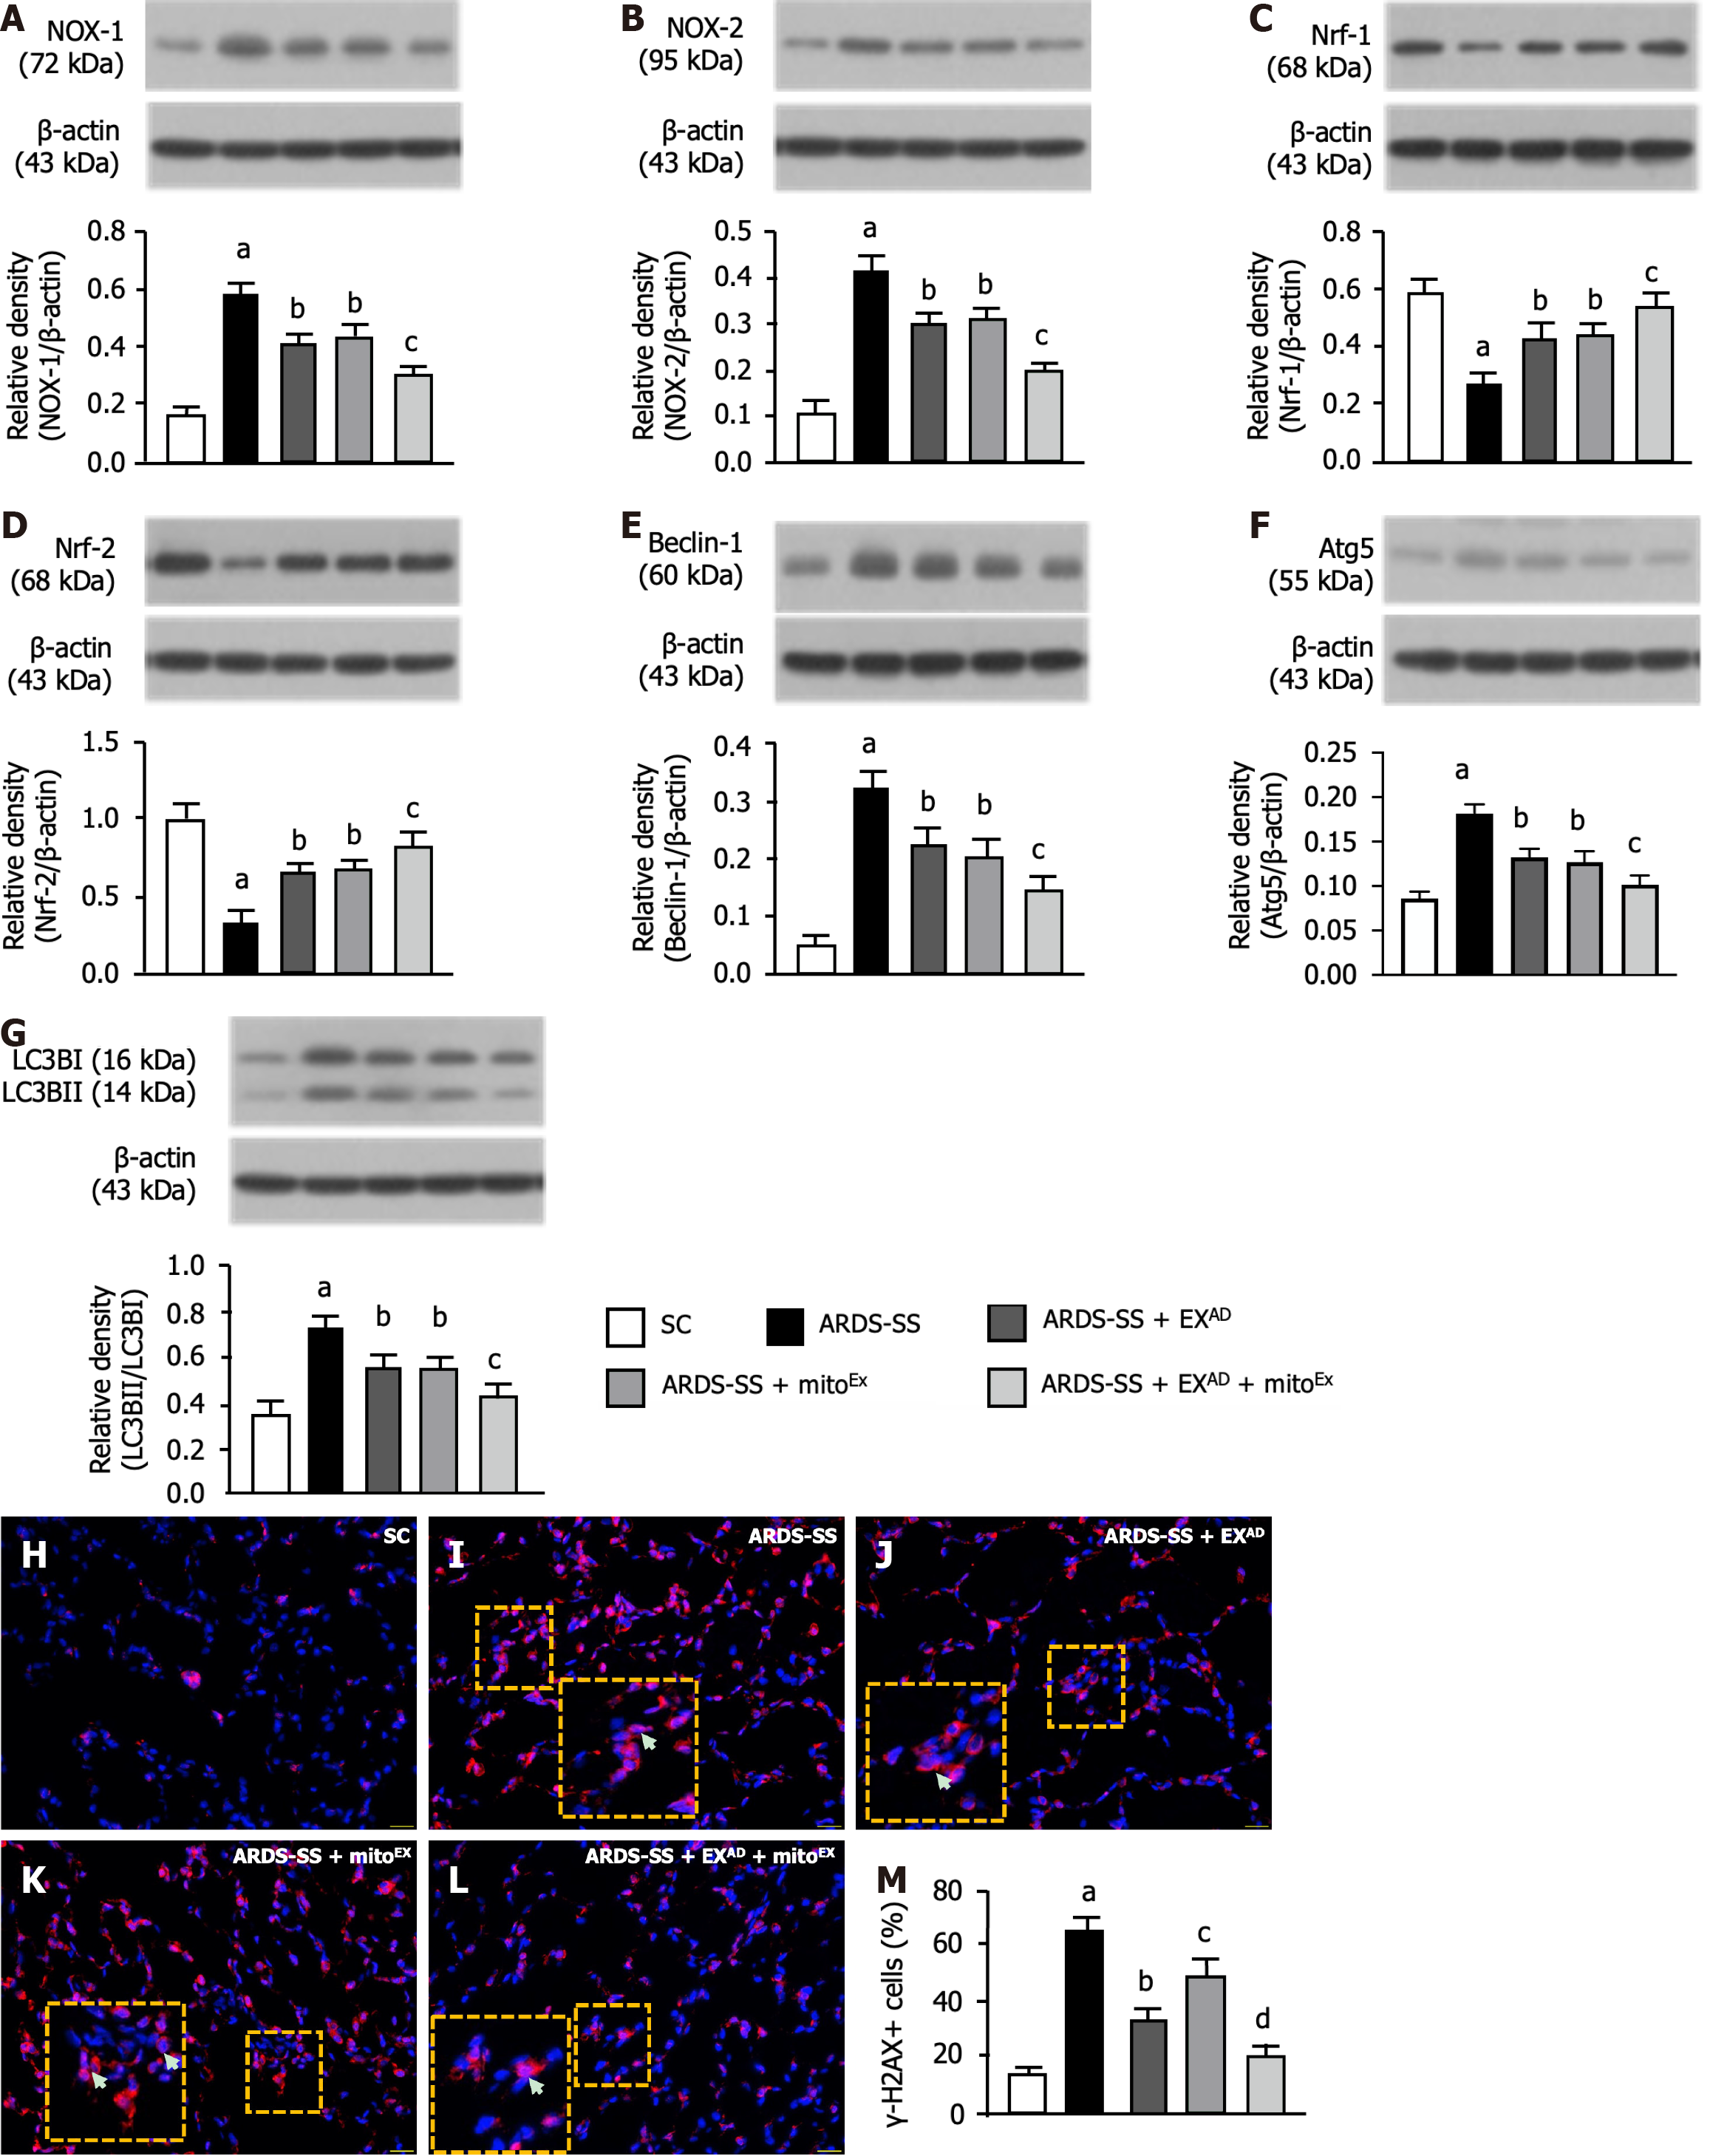
Figure 6 Protein expressions of oxidative stress and autophagy, and cellular level of DNA damage by day 5 after acute respiratory distress syndrome induction.
A: Protein expression of NOX-1, control vs other groups with different letters, aP < 0.0001, bP < 0.05, cP < 0.01; B: Protein expression of NOX-2, control vs other groups with different letters, aP < 0.0001, bP < 0.05, cP < 0.01; C: Protein expression of nuclear respiratory factor 1 (Nrf1), control vs other groups with different letters, aP < 0.0001, bP < 0.05, cP < 0.01; D: Protein expression of Nrf2, control vs other groups with different letters, aP < 0.0001, bP < 0.05, cP < 0.01; E: Protein expression of beclin-1, control vs other groups with different letters, aP < 0.0001, bP < 0.05, cP < 0.01; F: Protein expression of autophagy related 5, control vs other groups with different letters, aP < 0.0001, bP < 0.05, cP < 0.01; G: Protein expression of the ratio of LC3B-II to LC3B-I, control vs other groups with different letters, aP < 0.0001, bP < 0.05, cP < 0.01; H-L: Illustrating the immunofluorescent microscopic finding (400 ×) for identification of γ-H2AX+ cells (red color). Yellow dotted line large square box was the manifestation of yellow dotted line small square box for more clear identification of double stained (i.e., DAPI stain for nuclei+ γ-H2AX) γ-H2AX+ cells (white arrows). The scale bars in right lower corner represent 20 μm; M: Analytical result of number of γ-H2AX+ cells, control vs other groups with different letters, aP < 0.0001, bP < 0.01, cP < 0.05, dP < 0.001. All statistical analyses were performed by one-way ANOVA, followed by Bonferroni multiple comparison post hoc test (n = 6 for each group). Nrf1: Nuclear respiratory factor 1; Atg5: Autophagy related 5; SC: Sham-operated control; ARDS: Acute respiratory distress syndrome; SS: Sepsis syndrome; mitoEx: Exogenous mitochondria; EXAD: Adipose-derived mesenchymal stem cells-derived exosomes.
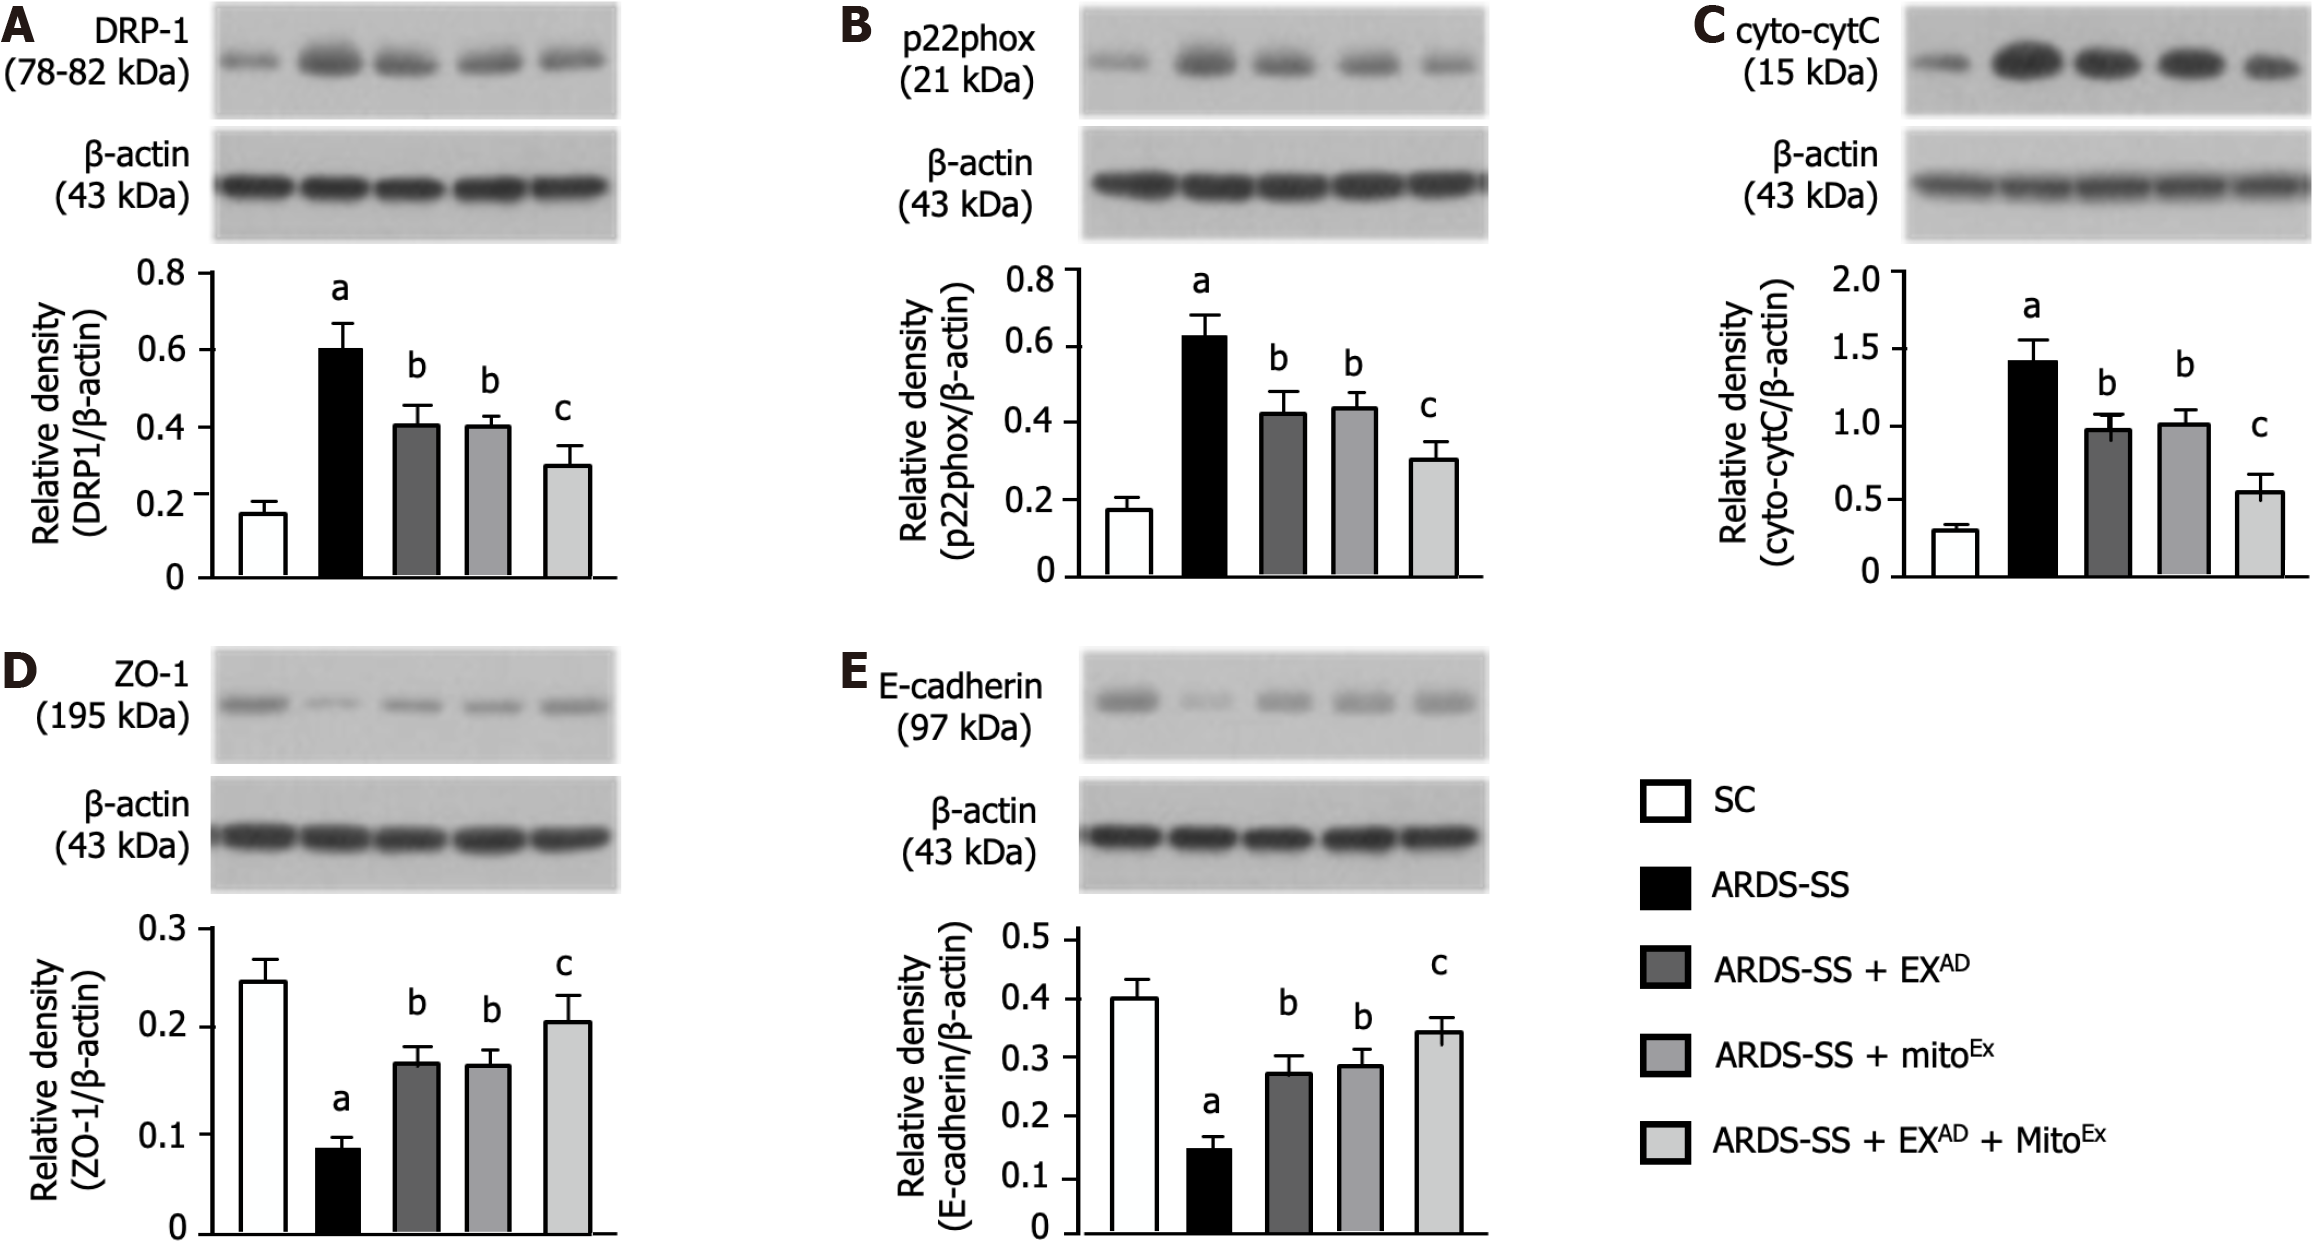
Figure 7 Protein expressions of mitochondrial damaged markers and cellular junctions by day 5 after acute respiratory distress syndrome induction.
A: Protein expression of dynamin- related protein 1, control vs other groups with different letters, aP < 0.0001, bP < 0.05, cP < 0.01; B: Protein expression of p22phox, control vs other groups with different letters, aP < 0.0001, bP < 0.05, cP < 0.01; C: Protein expression of cytosolic cytochrome C, control vs other groups with different letters, aP < 0.0001, bP < 0.05, cP < 0.01; D: Protein expression of zonula occludens-1, control vs other groups with different letters, aP < 0.0001, bP < 0.05, cP < 0.01; E: Protein expression of E-cadherin, control vs other groups with different letters, aP < 0.0001, bP < 0.05, cP < 0.01. All statistical analyses were performed by one-way ANOVA, followed by Bonferroni multiple comparison post hoc test (n = 6 for each group). Drp1: Dynamin-related protein 1; cyto-CytC: Cytosolic cytochrome C; ZO-1: Zonula occludens-1; SC: Sham-operated control; ARDS: Acute respiratory distress syndrome; SS: Sepsis syndrome; mitoEx: Exogenous mitochondria; EXAD: Adipose-derived mesenchymal stem cells-derived exosomes.
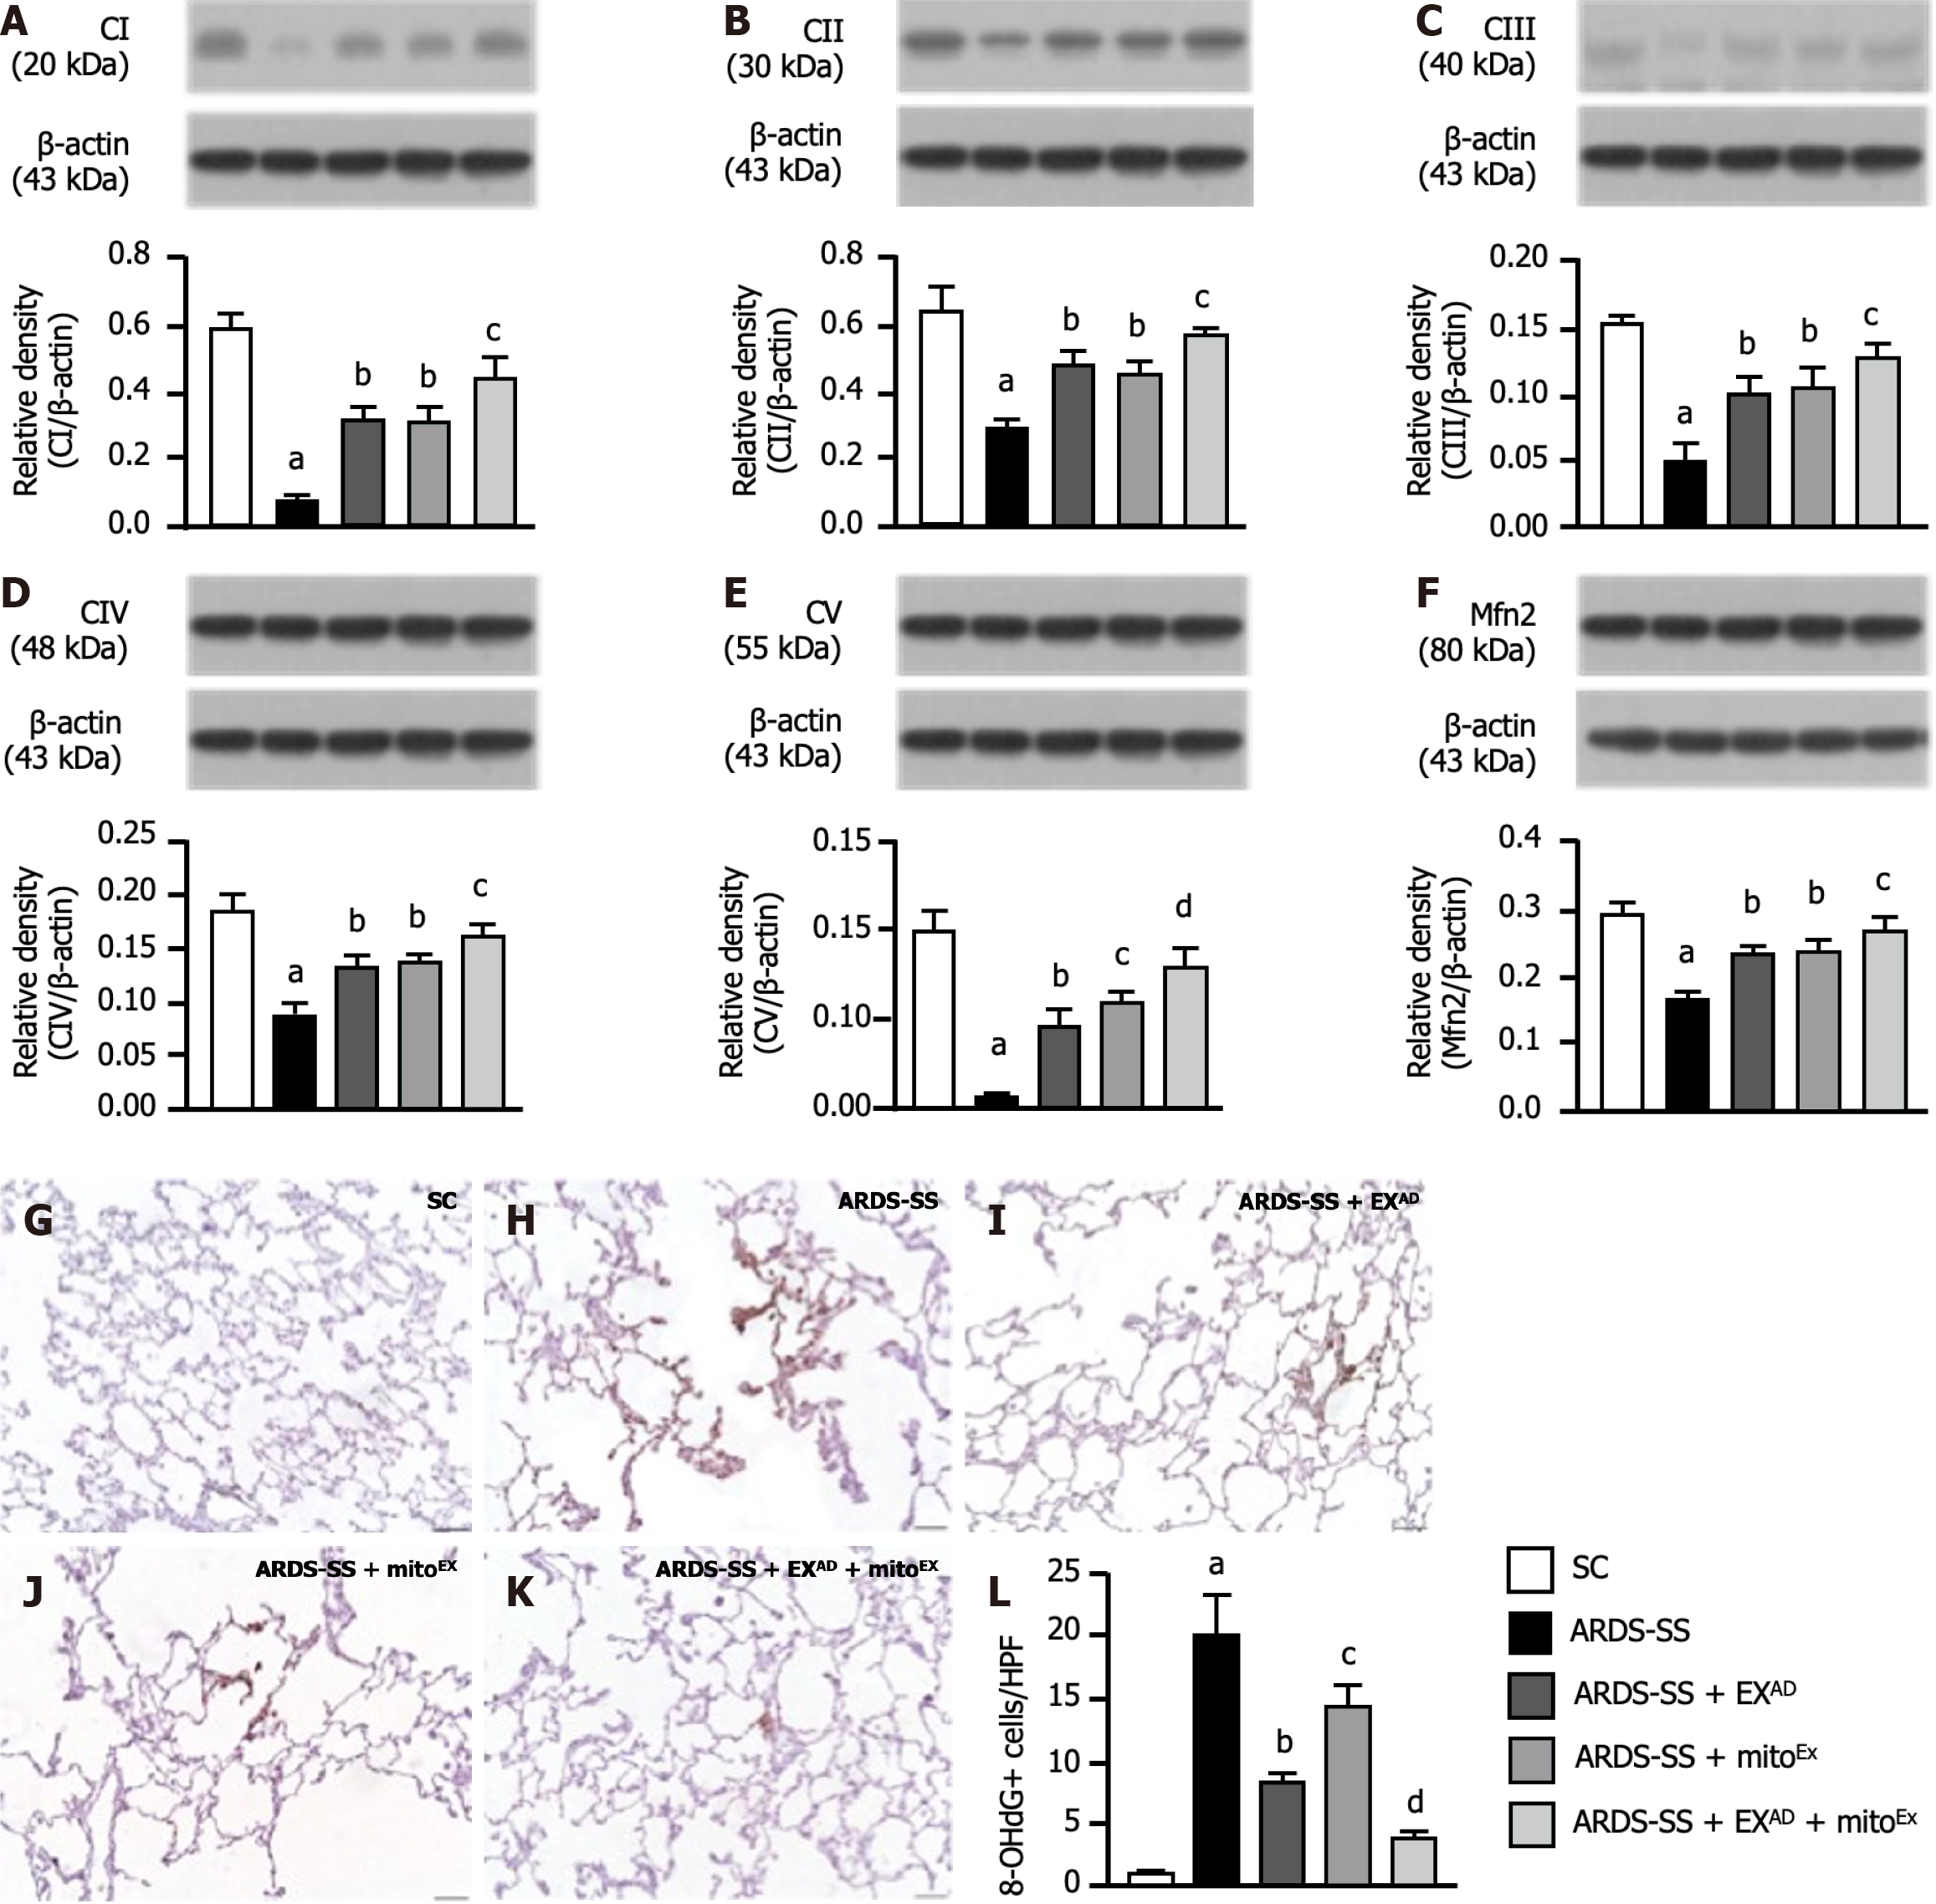
Figure 8 Protein expressions of mitochondrial electron transport chain complexes and mitofusin 2 by day 5 after acute respiratory distress syndrome induction.
A: Protein expression of complex I, control vs other groups with different letters, aP < 0.0001, bP < 0.001, cP < 0.01; B: Protein expression of complex II, control vs other groups with different letters, aP < 0.0001, bP < 0.001, cP < 0.01; C: Protein expression of complex III, control vs other groups with different letters, aP < 0.0001, bP < 0.001, cP < 0.01; D: Protein expression of complex IV, control vs other groups with different letters, aP < 0.0001, bP < 0.001, cP < 0.01; E: Protein expression of complex V, control vs other groups with different letters, aP < 0.0001, bP < 0.01, cP < 0.001, dP < 0.05; F: Protein expression of mitofusin 2, control vs other groups with different letters, aP < 0.0001, bP < 0.01, cP < 0.05; G-K: Illustrating the microscopic finding (400 ×) of immunohistochemical stain for identification of 8-hydroxy-2’-deoxyguanosine (8-OHdG)+ cells (gray color). The scale bars in right lower corner represent 20 μm; L: Analytical result of number of 8-OHdG+ cells, control vs other groups with different letters, aP < 0.0001, bP < 0.005, cP < 0.01, dP < 0.001. All statistical analyses were performed by one-way ANOVA, followed by Bonferroni multiple comparison post hoc test (n = 6 for each group). CI: Complex I; CII: Complex II; CIII: Complex III; CIV: Complex IV; CV: Complex V; Mfn2: Mitofusin 2; 8-OHdG: 8-hydroxy-2’-deoxyguanosine; SC: Sham-operated control; ARDS: Acute respiratory distress syndrome; SS: Sepsis syndrome; mitoEx: Exogenous mitochondria; EXAD: Adipose-derived mesenchymal stem cells-derived exosomes.
Figure 9 Adipose-derived mesenchymal stem cells-derived exosomes-exogenous mitochondria were identified in the lung parenchyma of acute respiratory distress syndrome rat by day 5 after acute respiratory distress syndrome induction.
A and B: Illustrating the immuno
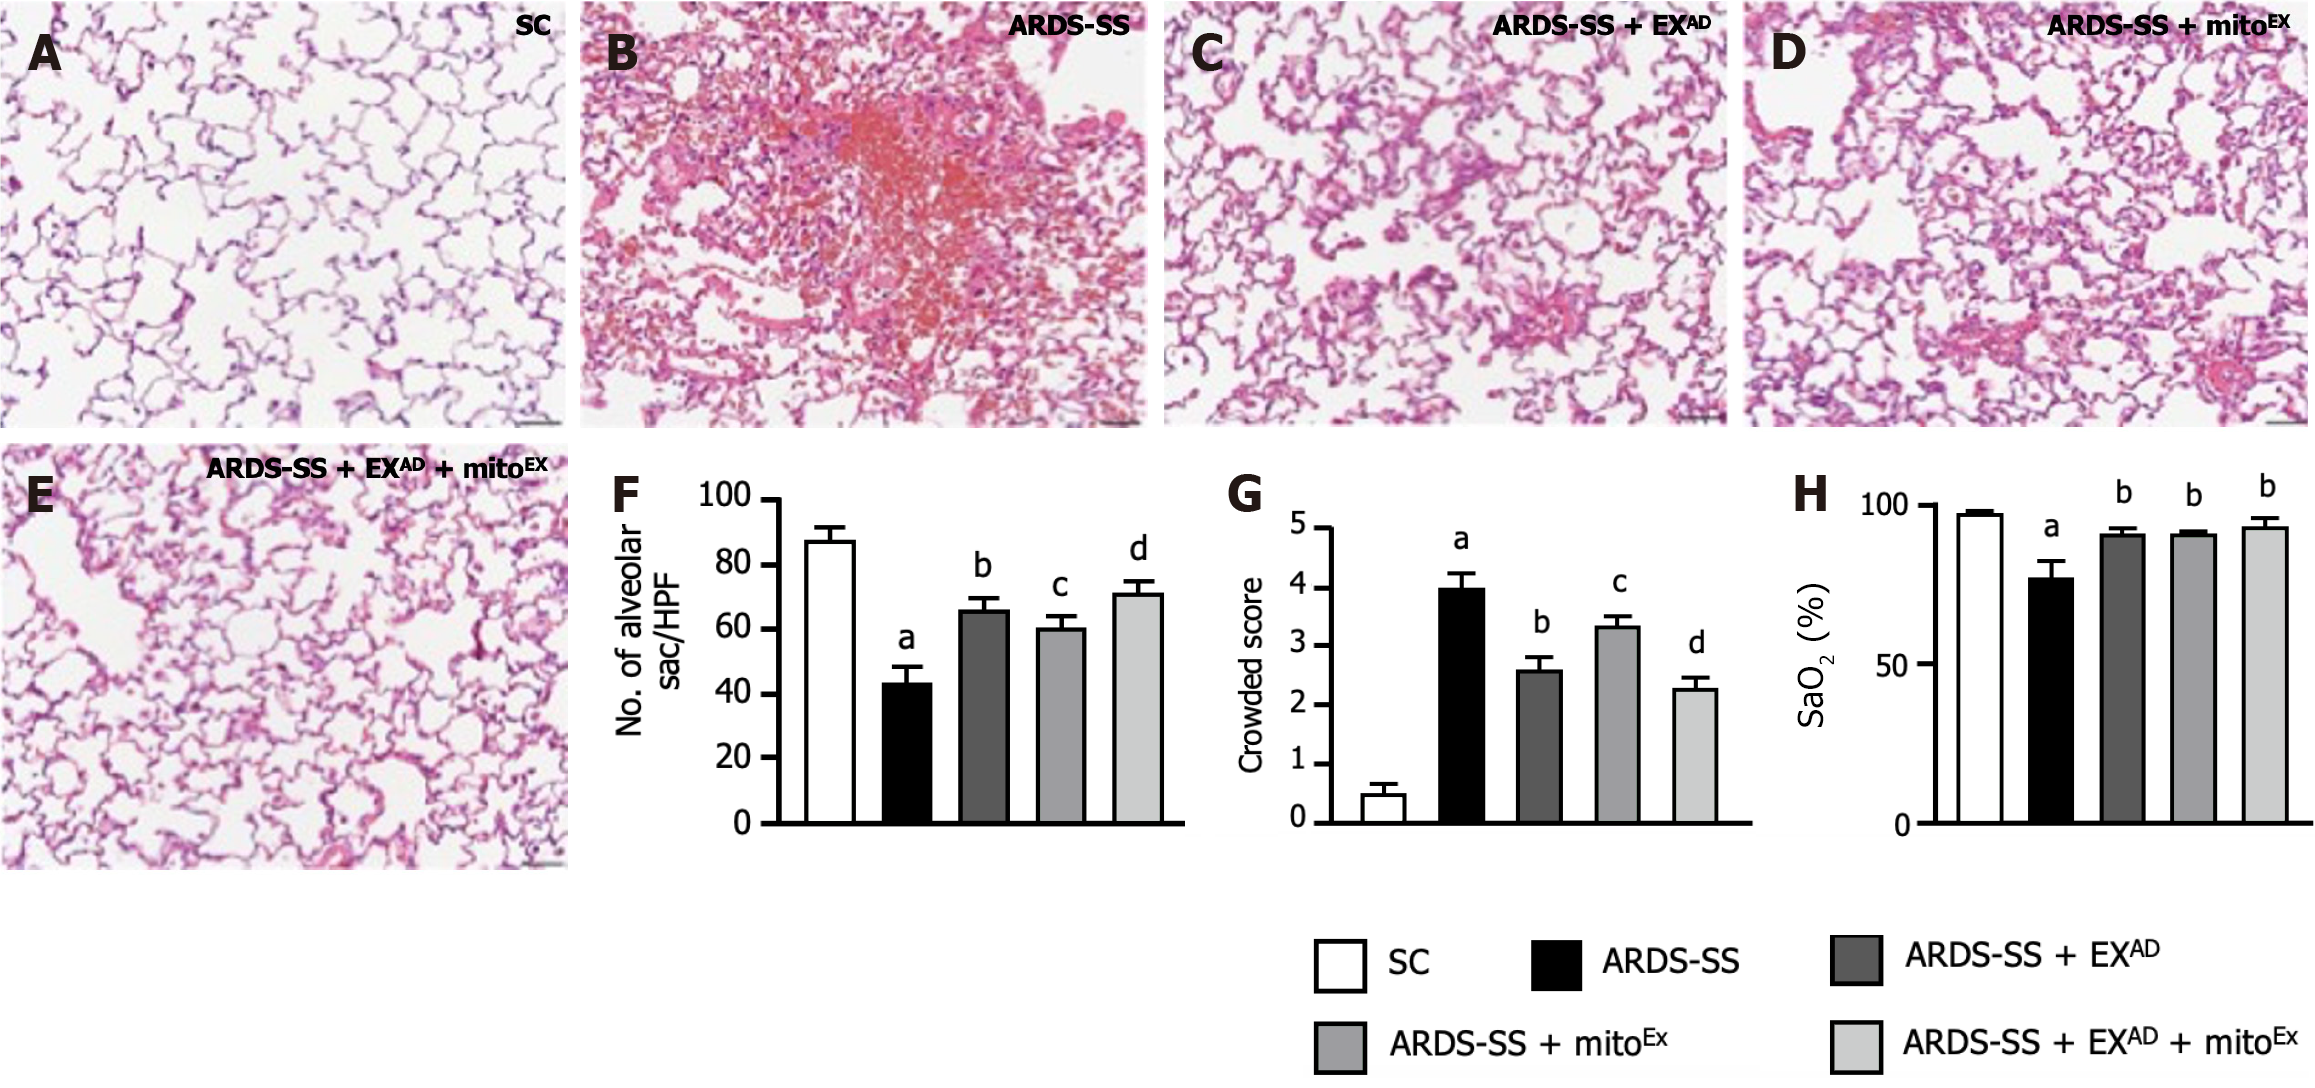
Figure 10 Histopathological findings of lung injury and arterial oxygen saturation by day 5 after acute respiratory distress syndrome induction.
A-E: Illustrating the histopathological findings (i.e., hematoxylin and eosin stain) of lung parenchyma by microscope (200 ×) for verifying the lung injury scores (i.e., including variables of alveoli and lung crowding) among the five groups of animals; F: The number of alveolar sacs among five groups. control vs other groups with different letters, aP < 0.0001, bP < 0.01, cP < 0.001, dP < 0.05; G: Crowded scores of lung parenchyma. control vs other groups with different letters, aP < 0.0001, bP < 0.05, cP < 0.01, dP < 0.001. The scale bars in right lower corner represent 50 μm; H: Arterial oxygen saturation (SaO2%), control vs other groups with different letters, aP < 0.001, bP < 0.05. All statistical analyses were performed by one-way ANOVA, followed by Bonferroni multiple comparison post hoc test (n = 6 for each group). SC: Sham-operated control; ARDS: Acute respiratory distress syndrome; SS: Sepsis syndrome; mitoEx: Exogenous mitochondria; EXAD: Adipose-derived mesenchymal stem cells-derived exosomes.
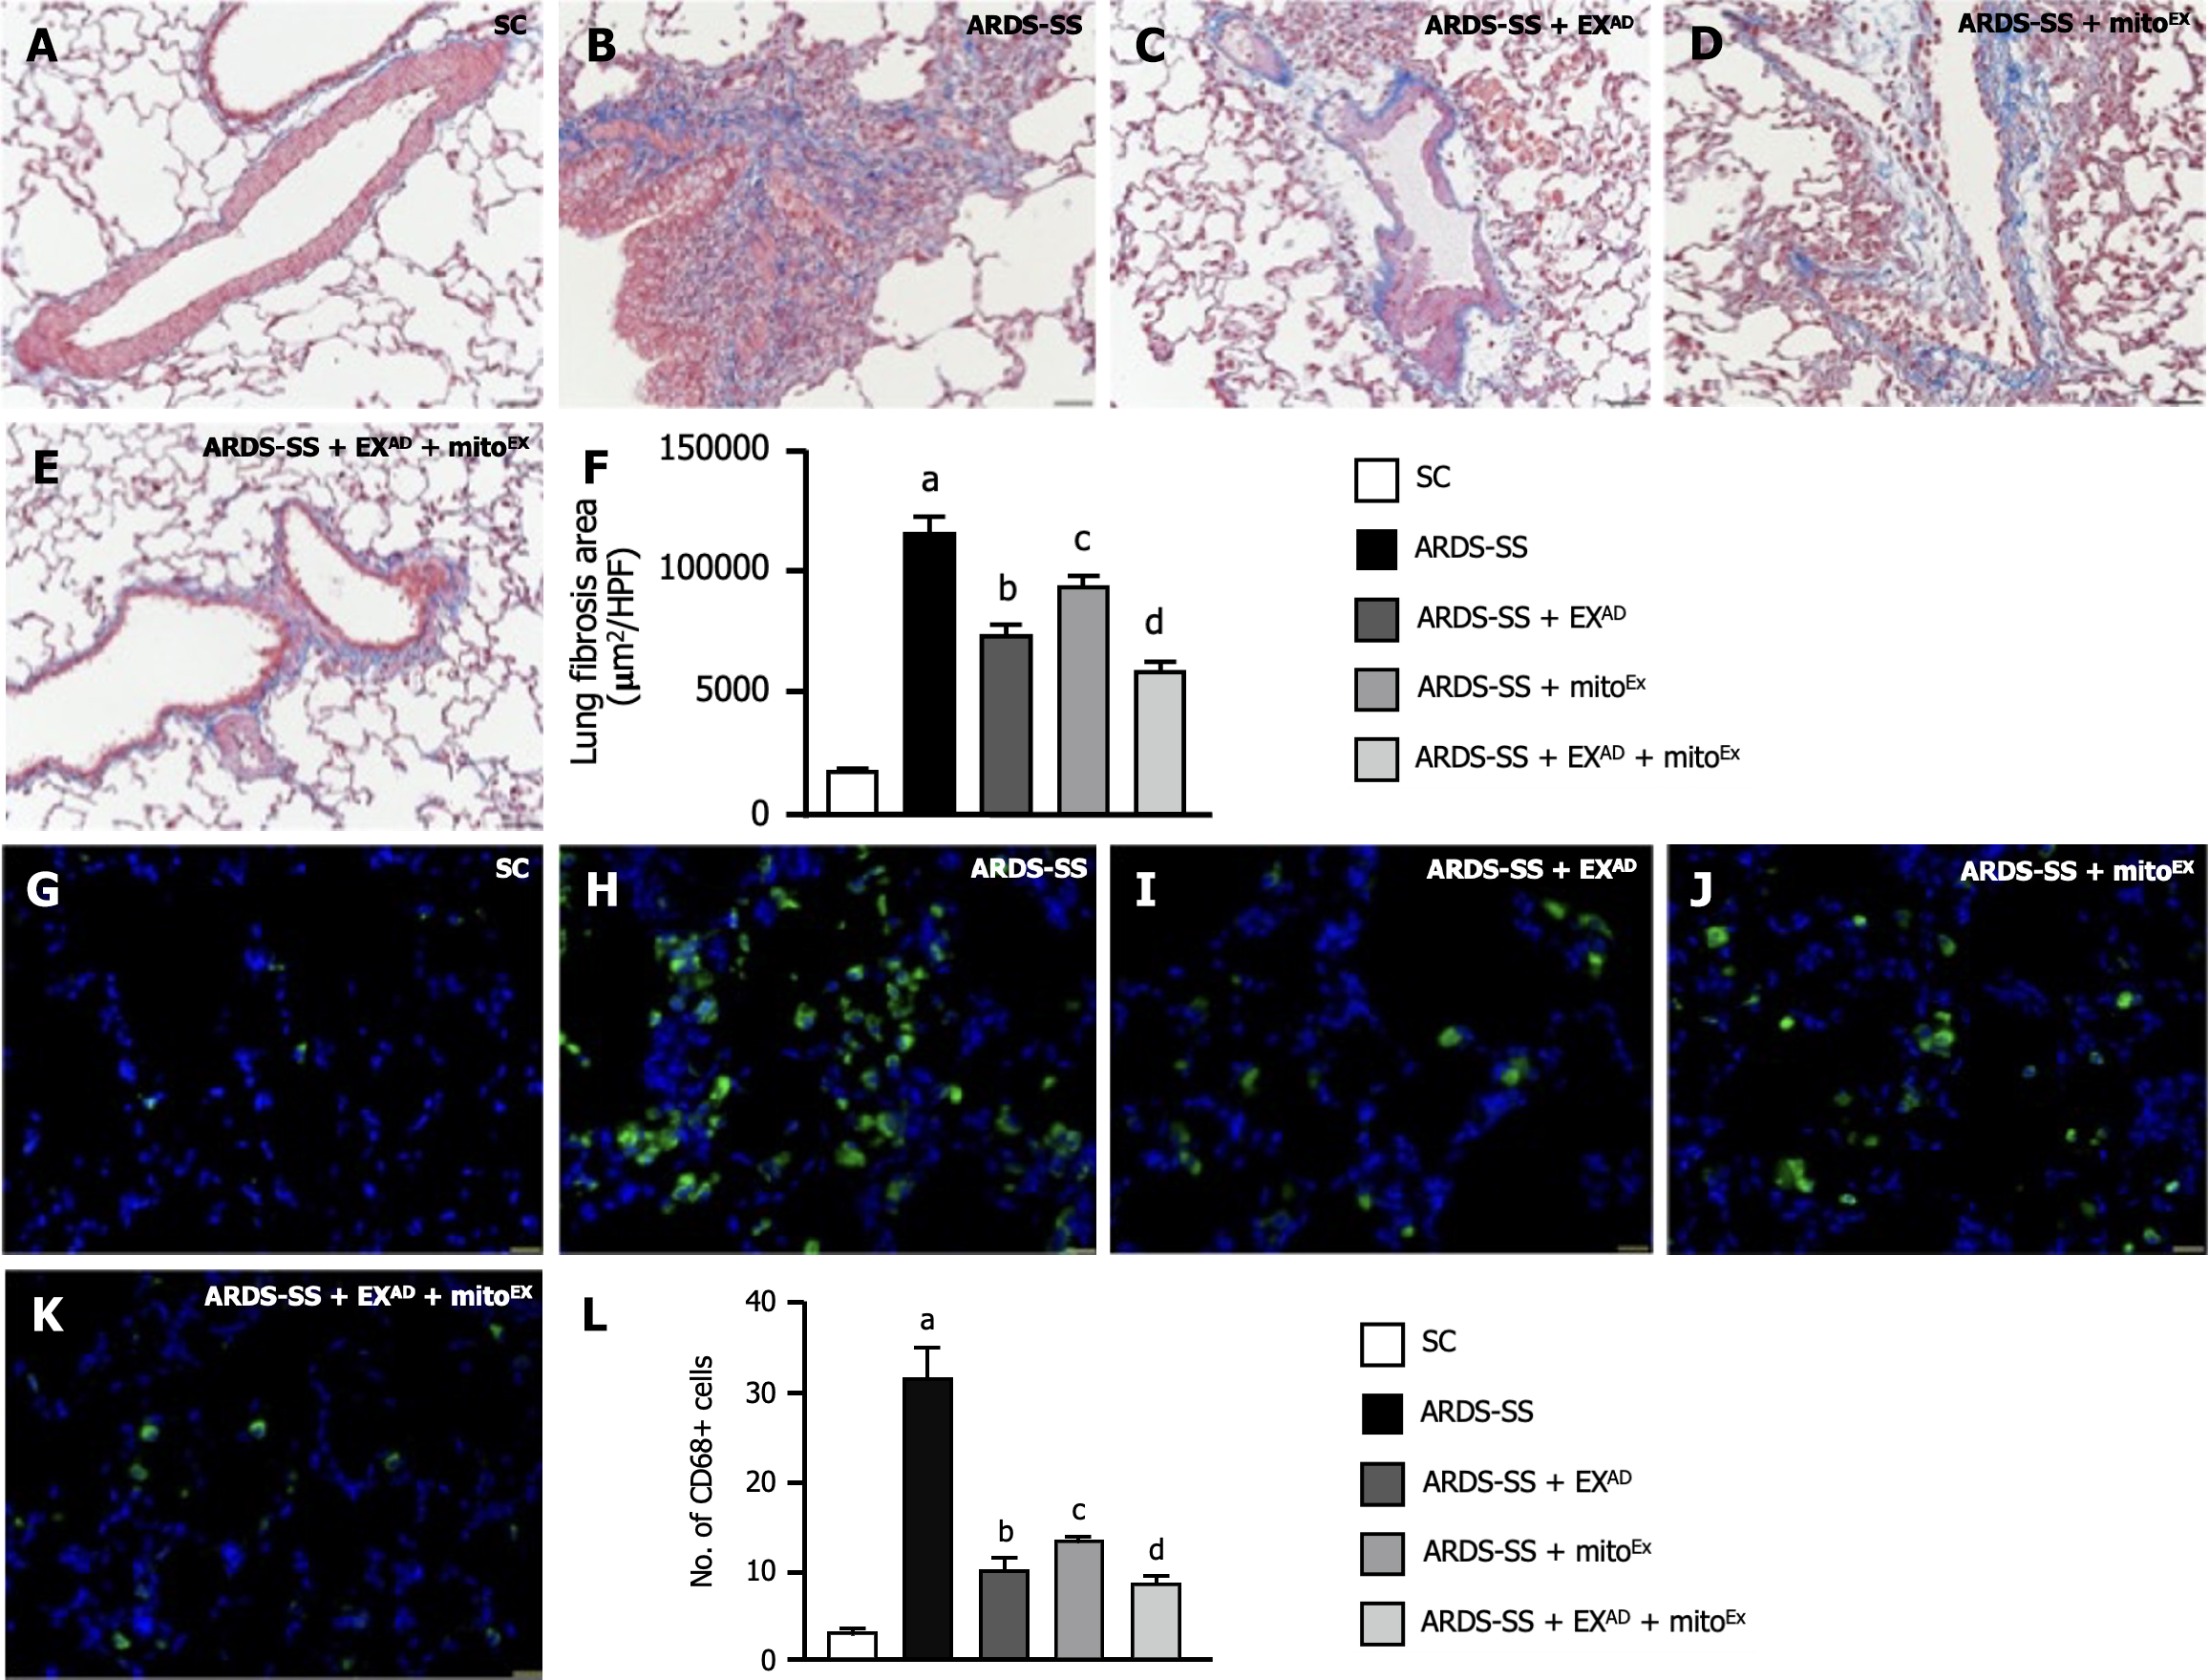
Figure 11 Cellular levels of fibrosis and inflammation by day 5 after acute respiratory distress syndrome induction.
A-E: Showing the microscopic finding (200 ×) of Masson’s trichome stain for identification of fibrosis in lung fibrosis (blue color); F: Analytical result of fibrotic area, control vs other groups with different letters, aP < 0.0001, bP < 0.05, cP < 0.01, dP < 0.001. The scale bars in right lower corner represent 50 μm; G-K: Illustrating the immunofluorescent microscopic finding (400 ×) for identification of cellular expression of CD68 (green color); L: Analytical result of number of CD68+ cells, control vs other groups with different letters, aP < 0.0001, bP < 0.05, cP < 0.01, dP < 0.001. The scale bars in right lower corner represent 20 μm. All statistical analyses were performed by one-way ANOVA, followed by Bonferroni multiple comparison post hoc test (n = 6 for each group). SC: Sham-operated control; ARDS: Acute respiratory distress syndrome; SS: Sepsis syndrome; mitoEx: Exogenous mitochondria; EXAD: Adipose-derived mesenchymal stem cells-derived exosomes.
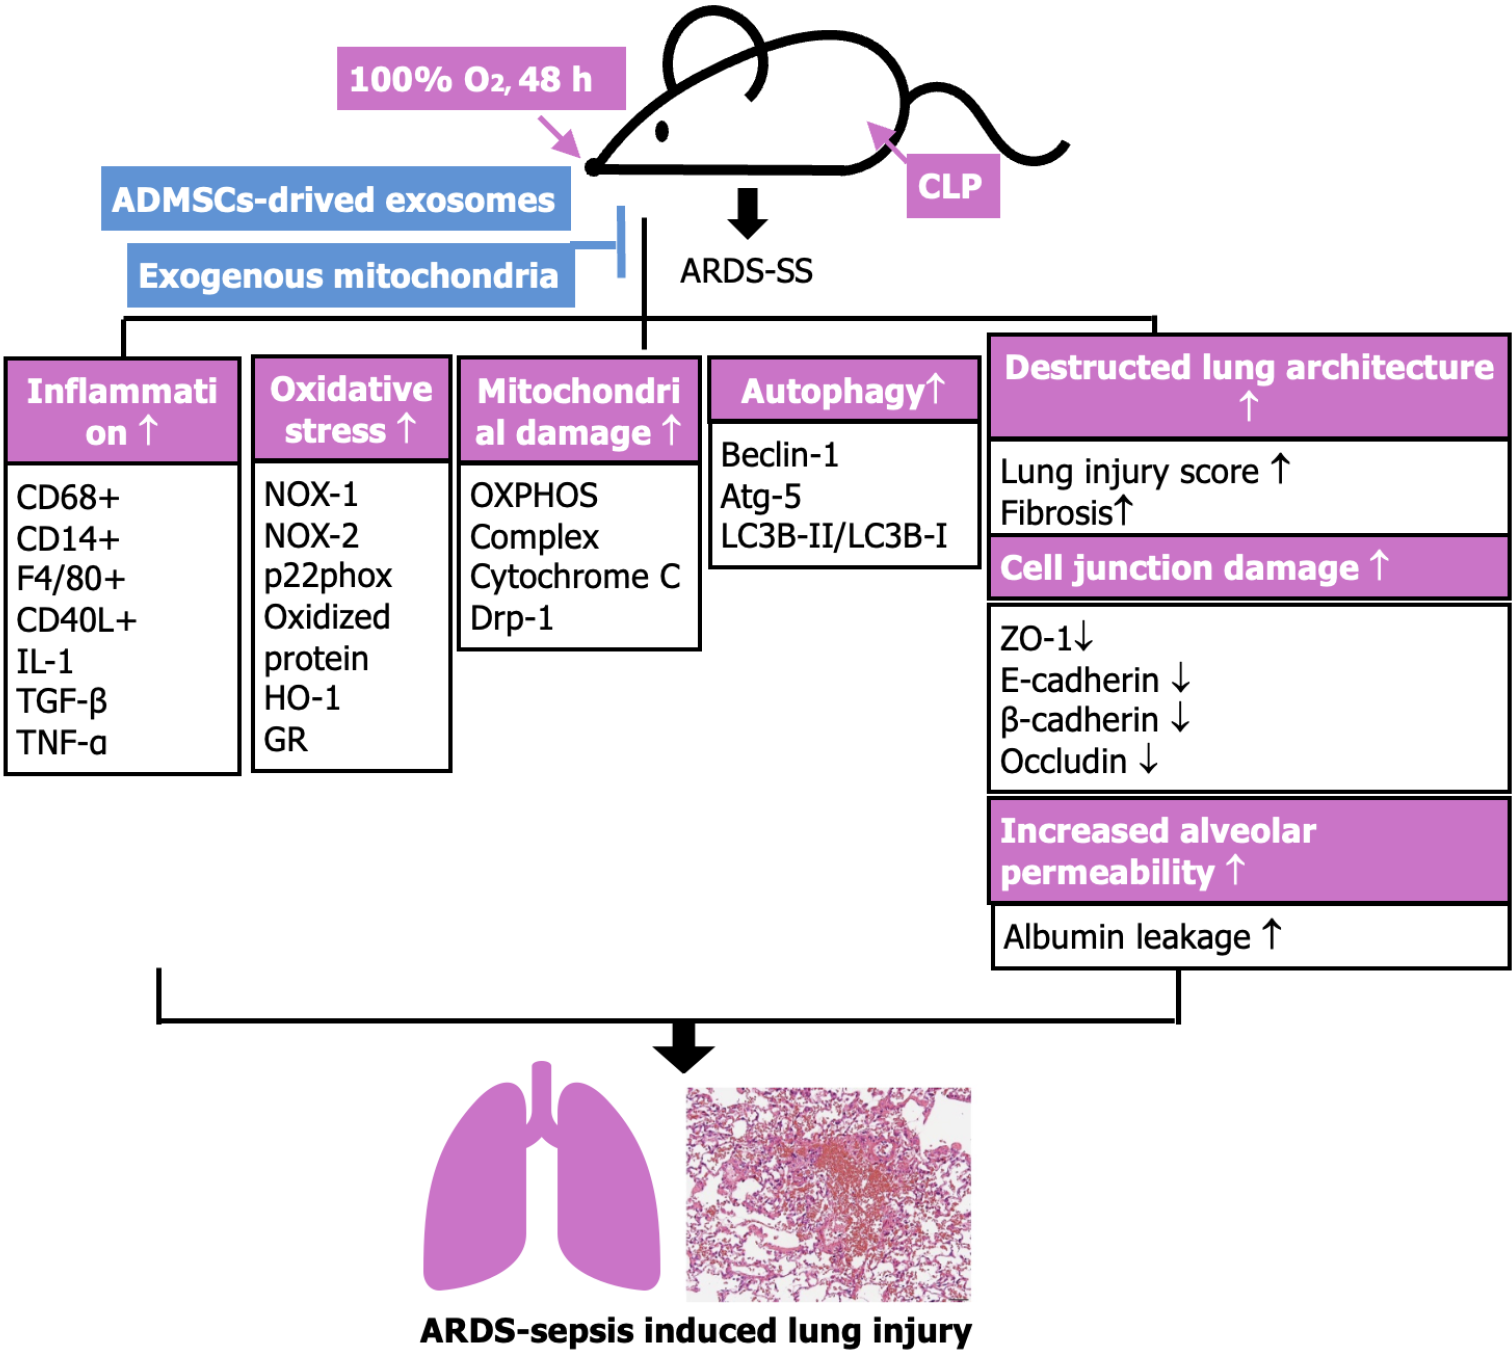
Figure 12 Illustrating the underlying mechanism of combined exogenous mitochondria and adipose-derived mesenchymal stem cells-derived exosomes therapy on protecting the lung parenchyma against acute respiratory distress syndrome-sepsis syndrome induced injury mainly through suppressing inflammation and oxidative stress and refreshing the adenosine triphosphate/mitochondria.
ARDS: Acute respiratory distress syndrome; SS: Sepsis syndrome; ADMSC: Adipose-derived mesenchymal stem cell; CLP: Cecal ligation and puncture; IL: Interleukin; TNF: Tumor necrosis factor; TGF: Transforming growth factor; Drp1: Dynamin-related protein 1; Atg5: Autophagy related 5; ZO-1: Zonula occludens-1; HO-1: Heme oxygenase-1; GR: Glutathione reductase; OXPHOS: Oxidative phosphorylation.
- Citation: Lin KC, Fang WF, Yeh JN, Chiang JY, Chiang HJ, Shao PL, Sung PH, Yip HK. Outcomes of combined mitochondria and mesenchymal stem cells-derived exosome therapy in rat acute respiratory distress syndrome and sepsis. World J Stem Cells 2024; 16(6): 690-707
- URL: https://www.wjgnet.com/1948-0210/full/v16/i6/690.htm
- DOI: https://dx.doi.org/10.4252/wjsc.v16.i6.690


