Copyright
©The Author(s) 2024.
World J Stem Cells. Jun 26, 2024; 16(6): 670-689
Published online Jun 26, 2024. doi: 10.4252/wjsc.v16.i6.670
Published online Jun 26, 2024. doi: 10.4252/wjsc.v16.i6.670
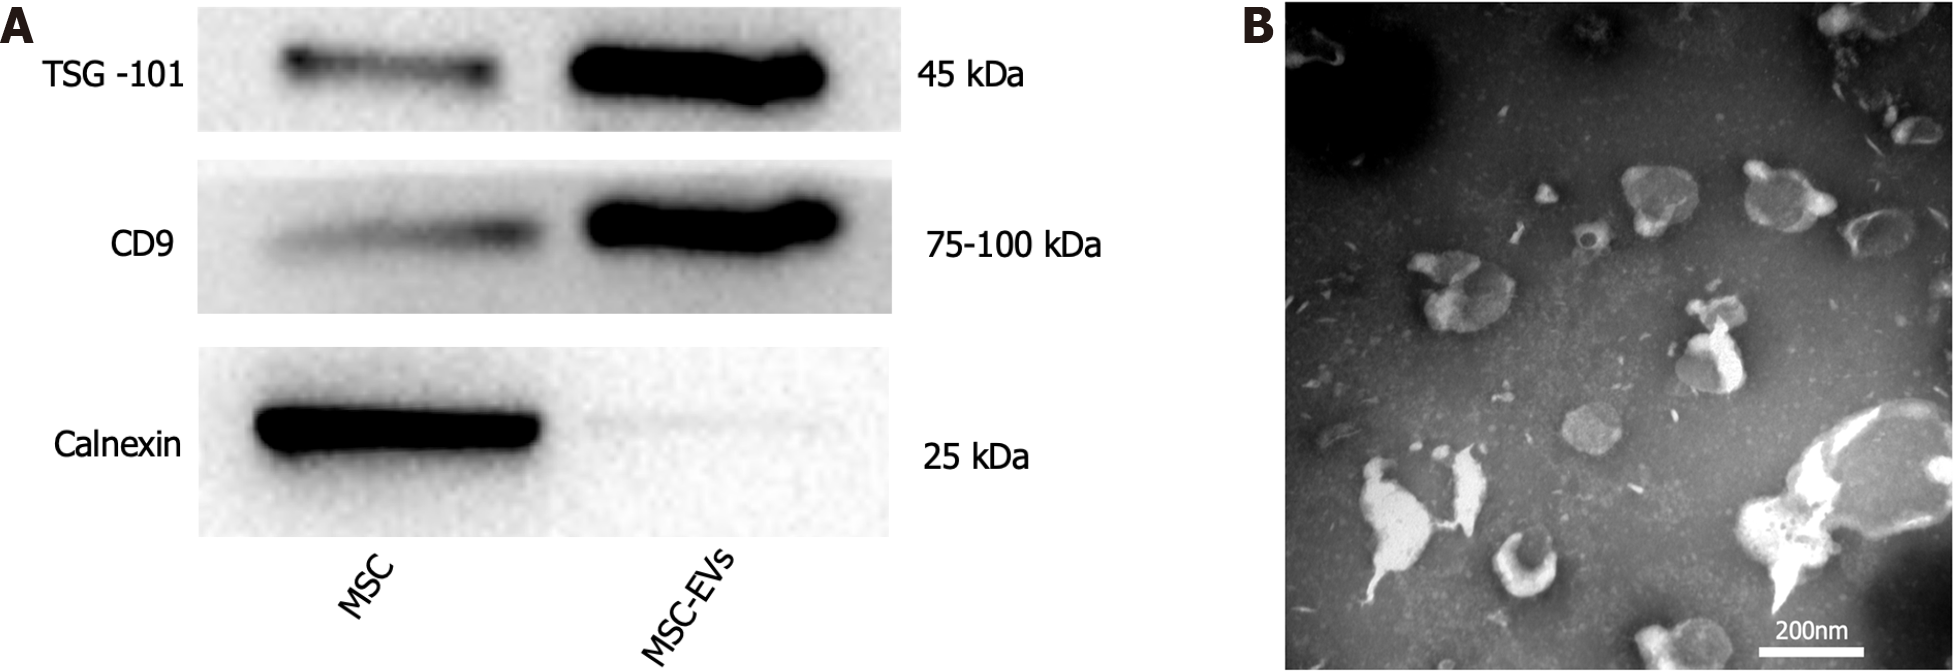
Figure 1 Extraction and identification of mesenchymal stem cells-extracellular vesicles.
A: Expression of mesenchymal stem cell (MSC) and MSC-extracellular vesicles (EVs) related proteins (calnexin is the signature protein of MSC, CD9, and TSG101 are the signature proteins of MSC-EVs. The expression level of calnexin in MSC is more obvious than that in MSC-EVs, while the expression level of TSG-101 and CD9 in MSC-EVs is more obvious than that in MSC; B: Morphology of MSC-EVs under electron microscope. MSC: Mesenchymal stem cell; EV: Extracellular vesicle.
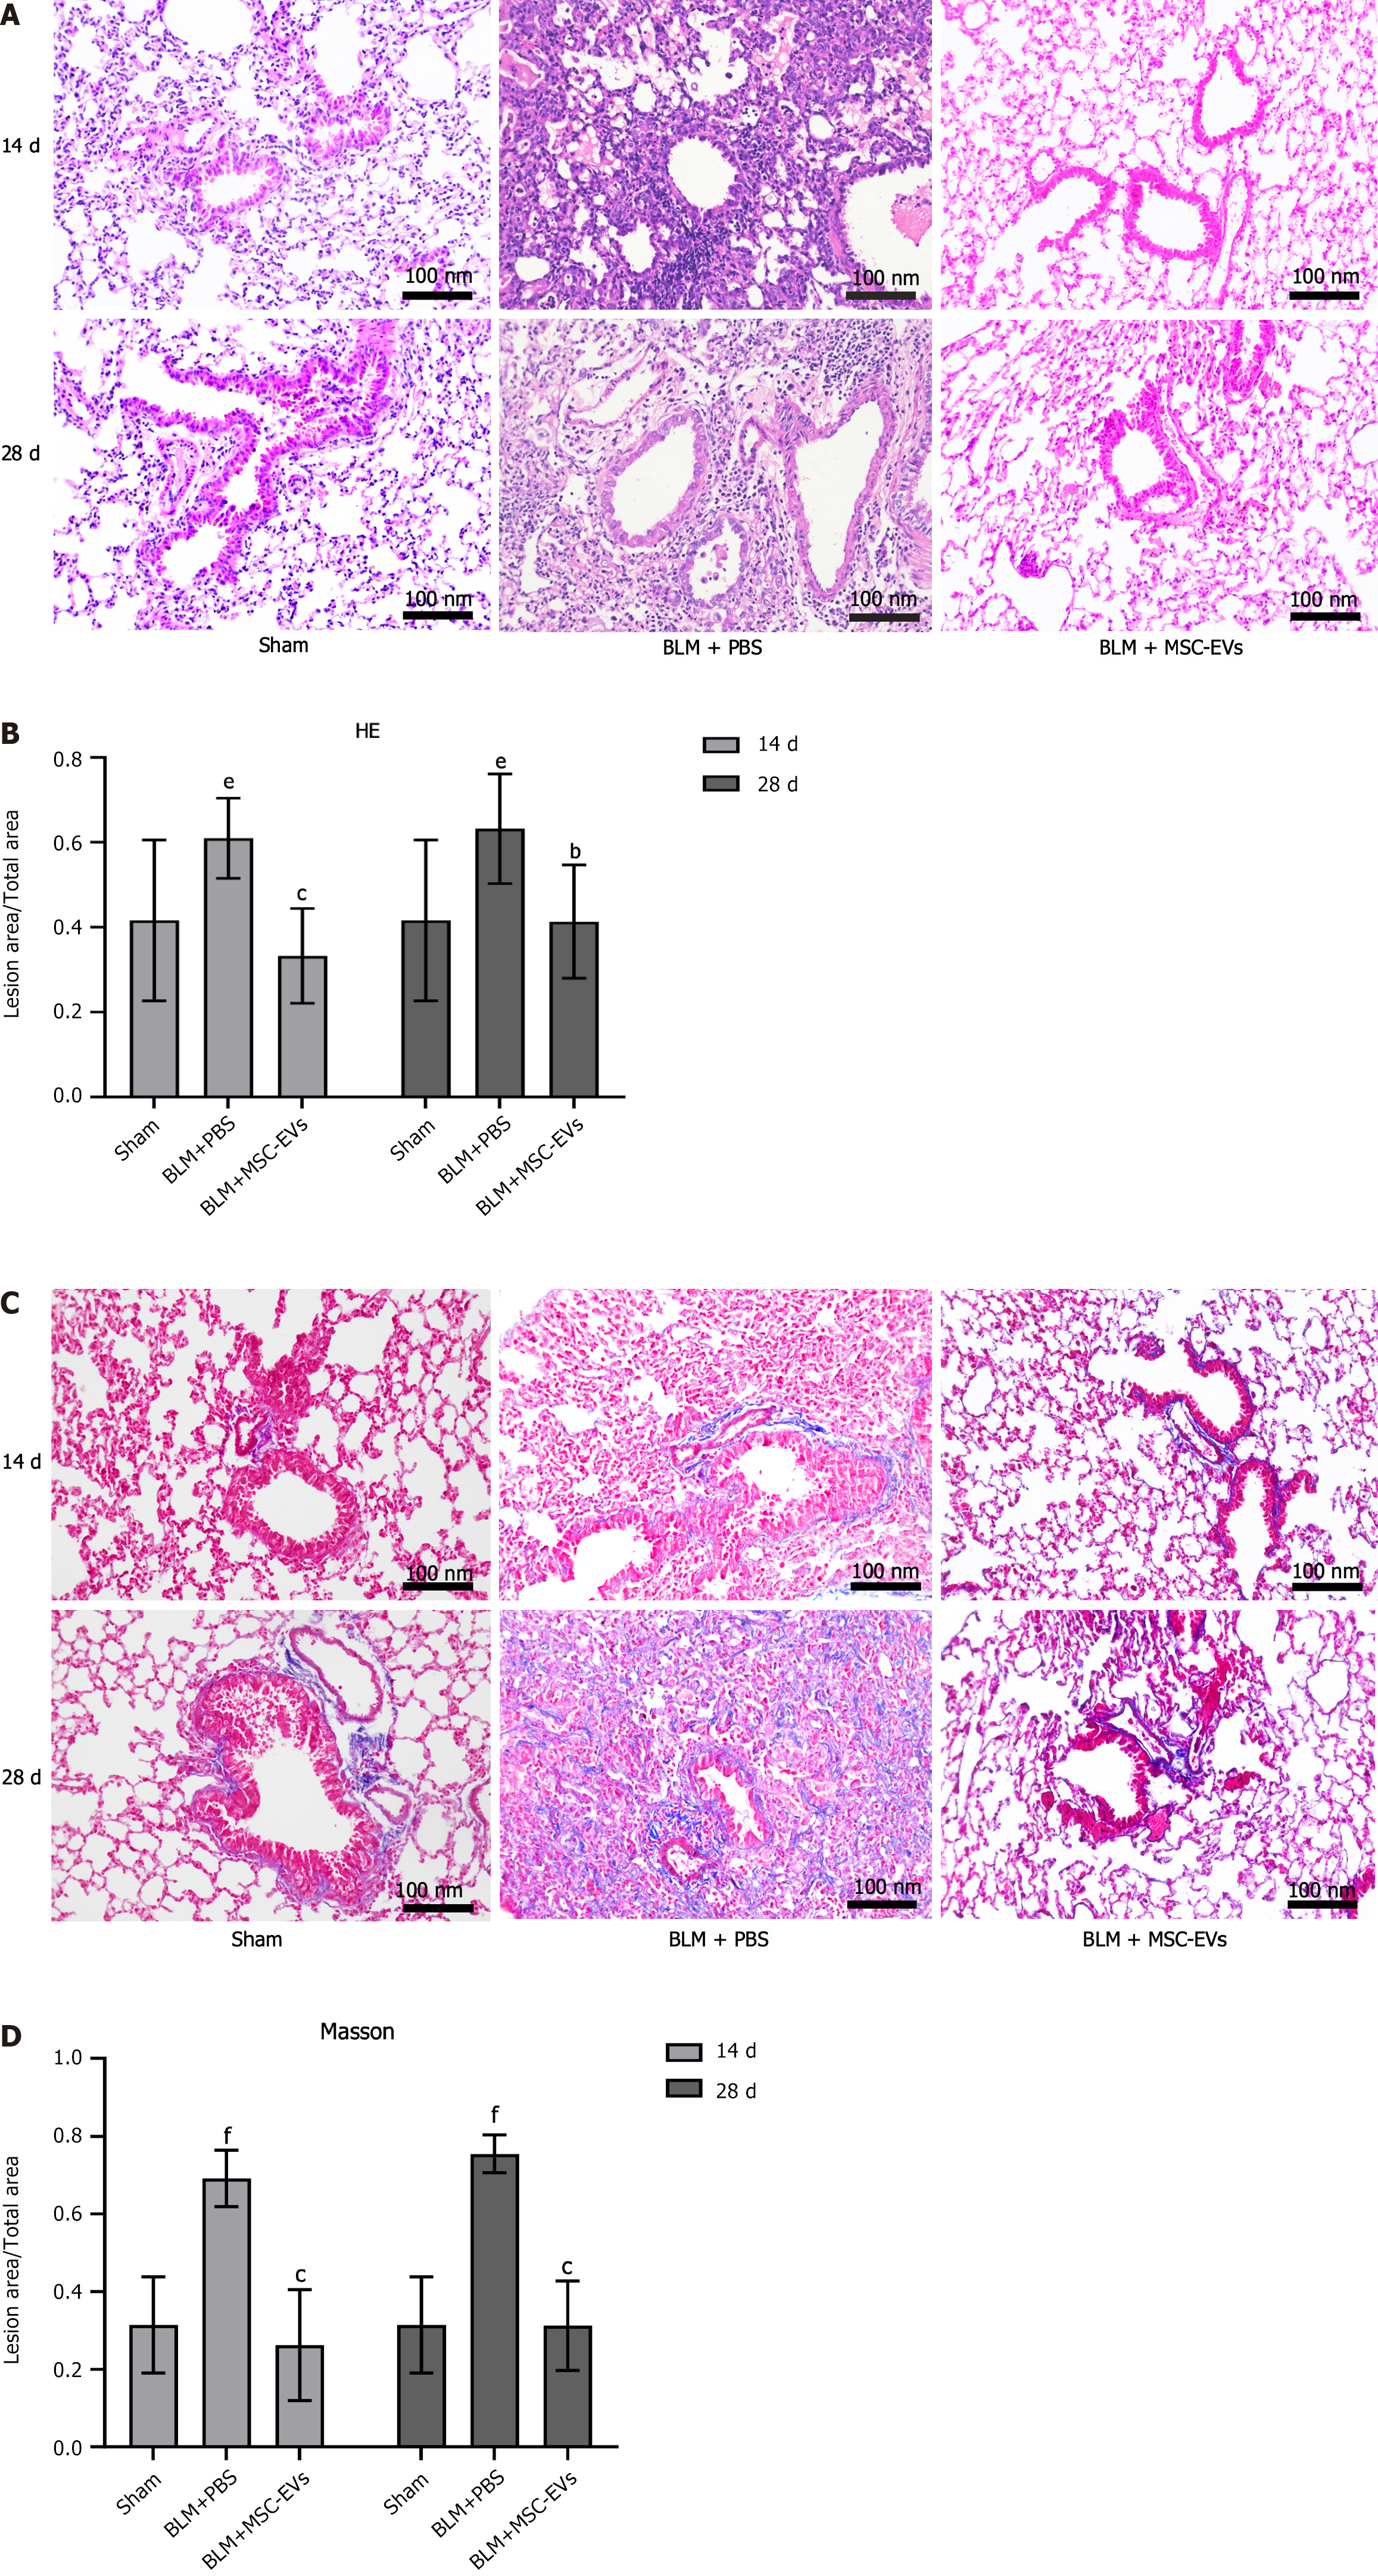
Figure 2 Bleomycin can induce pulmonary fibrosis and inflammatory infiltration in mice.
A: Hematoxylin and eosin (HE) staining of lung tissue of mice in each group on days 14 and 28 after administration. Inflammatory cells are basophilic (blue-purple granules), and their number represents the severity of inflammation in the lung tissue of mice; B: The quantitative statistical analysis of HE staining on days 14 and 28 among the three groups. The ordinate represents the percentage of the inflammatory area in the total area, and the abscissa represents the grouping. In the bleomycin group, there were significant inflammatory reactions on day 14 (eP < 0.01 vs sham group) and day 28 (eP < 0.01 vs sham group). After exosome treatment, the inflammatory reactions were significantly improved on day 14 (cP < 0.001) and day 28 (bP < 0.01); C: Masson staining of lung tissue of mice in each group on days 14 and 28 after administration. Collagen fibers appear blue, and their number represents the severity of collagen deposition in the lungs of mice; D: The quantitative statistical analysis of Masson staining. The ordinate represents the percentage of collagen fiber deposition area in the total area, and the abscissa represents the grouping. In the bleomycin group, significant collagen deposition occurred on day 14 (fP < 0.001 vs sham group) and day 28 (fP < 0.001 vs sham group). After exosome treatment, the collagen deposition decreased on day 14 (cP < 0.001) and day 28 (cP < 0.001). MSC: Mesenchymal stem cell; EV: Extracellular vesicle; BLM: Bleomycin; PBS: Phosphate buffered saline.
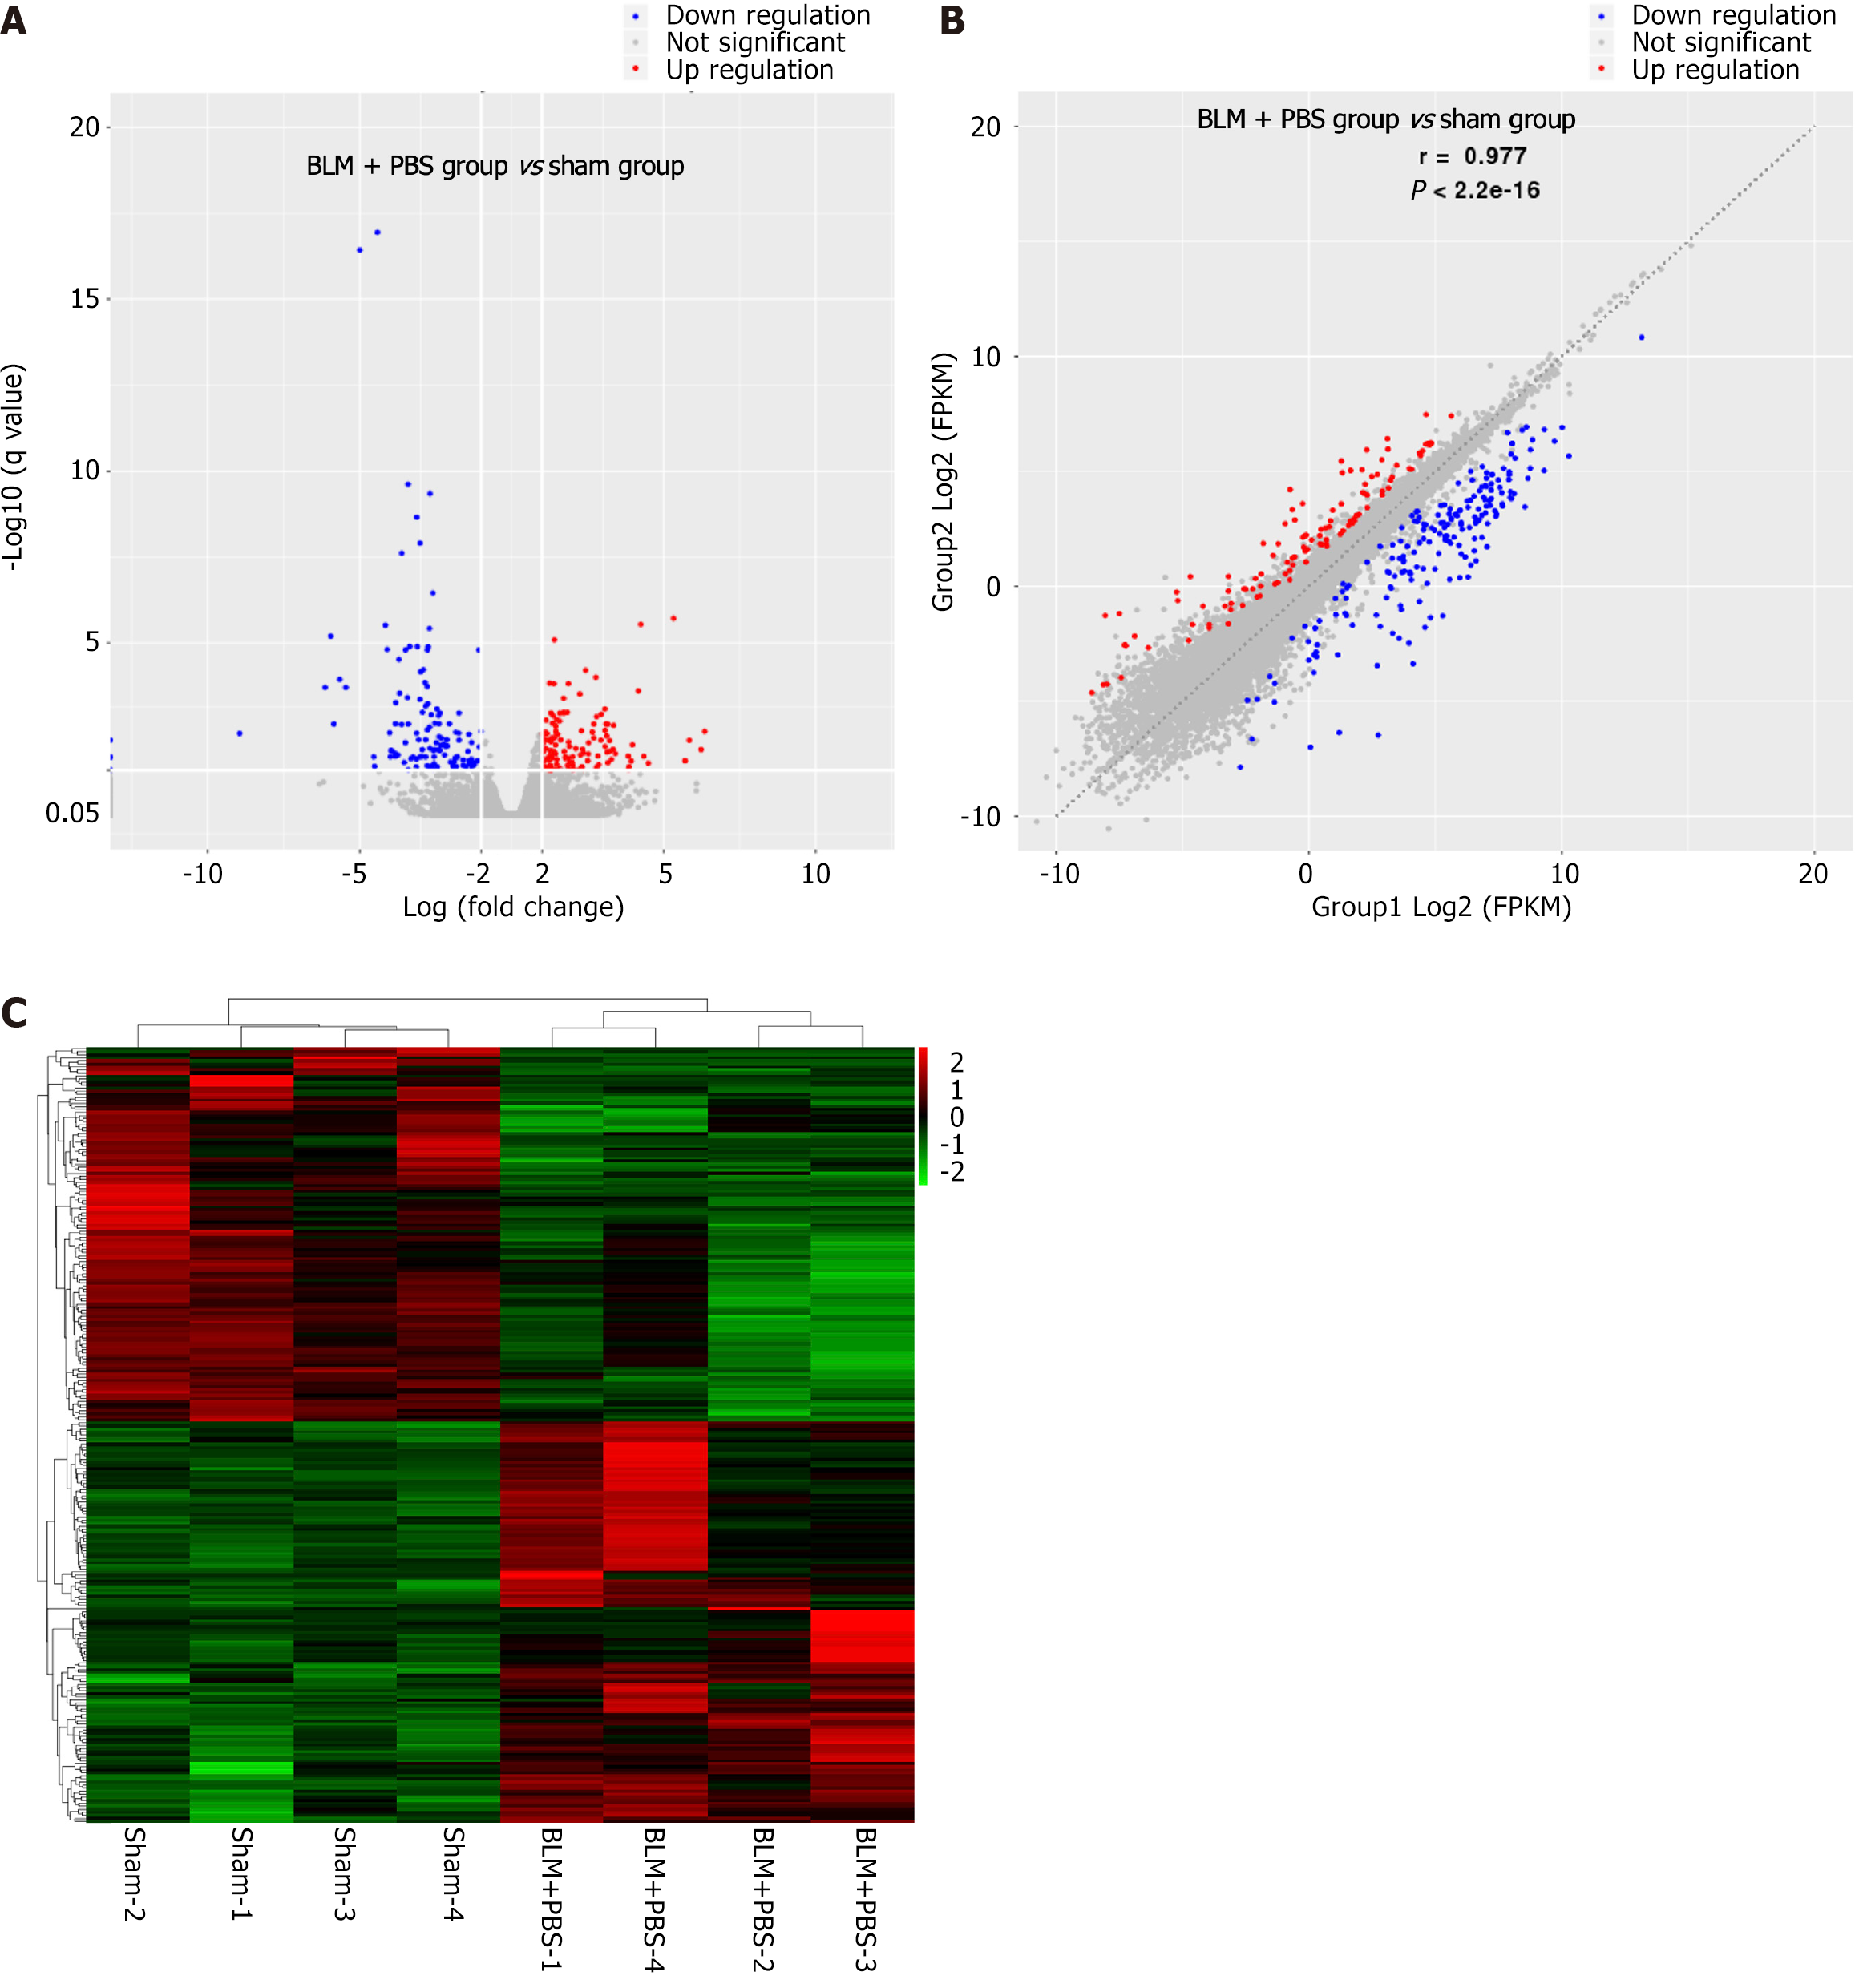
Figure 3 The pathogenesis of pulmonary fibrosis may be related to collagen deposition, oxidative stress, and immunoinflammatory response.
A: Volcano map of differentially expressed genes between sham group and bleomycin (BLM) + PBS group; B: Scatter plot of differentially expressed genes between the sham and BLM + PBS groups; C: Heat map of differentially expressed genes between the sham and BLM + PBS groups. BLM: Bleomycin; PBS: Phosphate buffered saline.
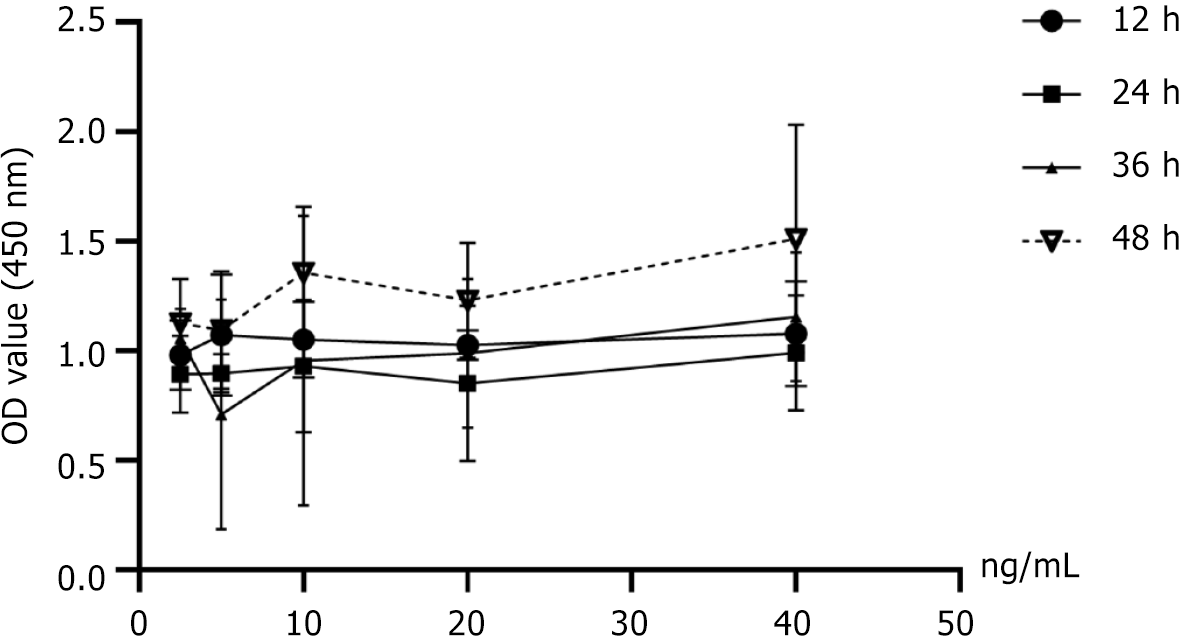
Figure 4 The optimum concentration and time were screened using the cell counting kit-8 method.
Figure 5 Mesenchymal stem cells-extracellular vesicles may alleviate pulmonary fibrosis by inhibiting epithelial-mesenchymal transformation.
A: The expressions of collagen I and α-smooth muscle actin (α-SMA) in A549 cells of each group were verified by western blot; B and C: The statistical analysis of the expression levels of each protein. Mesenchymal stem cells-extracellular vesicles (MSC-EVs) did not affect normal cell proliferation and differentiation (P > 0.05). Transforming growth factor (TGF)-β can induce epithelial-mesenchymal transformation of cells (collagen I: dP < 0.05 vs control group; α-SMA: fP < 0.001 vs control group). However, MSC-EVs can reverse the epithelial-mesenchymal transformation process caused by TGF-β (collagen I: aP < 0.05; α-SMA: cP < 0.001); D-I: The expression of TGF-β1, collagen I, and α-SMA in lung tissue was observed by immunohistochemical (IHC) staining (D, F, and H). The statistical analysis of the expression level of TGF-β, collagen I, and α-SMA in IHC staining (E, G, and I). On day 14 and day 28, TGF-β1 (14 d: fP < 0.001 vs sham group; 28 d: fP < 0.001 vs sham group), collagen I (14 d: fP < 0.001 vs sham group; 28 d: fP < 0.001 vs sham group) and α-SMA (14 d: dP < 0.05 vs sham group; 28 d: eP < 0.01 vs sham group) deposition were observed in the bleomycin + phosphate buffered saline group, and the above pathological changes could be reversed after MSC-EVs treatment [TGF-β1 (14 d: cP < 0.001; 28 d: cP < 0.001)], collagen I (14 d: cP < 0.001; 28 d: cP < 0.001) and α-SMA (14 d: bP < 0.01; 28 d: cP < 0.001); J: The western blot results of each protein’s expression in mice’s lung tissue in each group; K and L: The statistical analysis of western blot results of each protein in mouse lung tissue. No matter whether on day 7, 14, or 28, the expression of epithelial-mesenchymal transformation gene-related collagen I (7 d: eP < 0.01 vs sham group; 14 d: eP < 0.01 vs sham group; 28 d: eP < 0.01 vs sham group) and α-SMA (7 d: eP < 0.01 vs sham group; 14 d: eP < 0.01 vs sham group; 28 d: dP < 0.05 vs sham group) in lung tissue of mice was significantly higher than that in the sham group. After MSC-EVs treatment, the expression of collagen I and α-SMA decreased significantly at 7 d (collagen I: aP < 0.05; α-SMA: bP < 0.01) in the acute phase, 14 d in the subacute phase (collagen I: bP < 0.01; α-SMA: bP < 0.01) and 28 d in chronic phase (collagen I: aP < 0.05; α-SMA: bP < 0.01). These results indicate that the development of pulmonary fibrosis is long-term, and the anti-epithelial mesenchymal transformation of MSC-EVs is stable and long-lasting. MSC: Mesenchymal stem cell; EV: Extracellular vesicle; BLM: Bleomycin; PBS: Phosphate buffered saline; TGF: Transforming growth factor; α-SMA: Alpha smooth muscle actin.
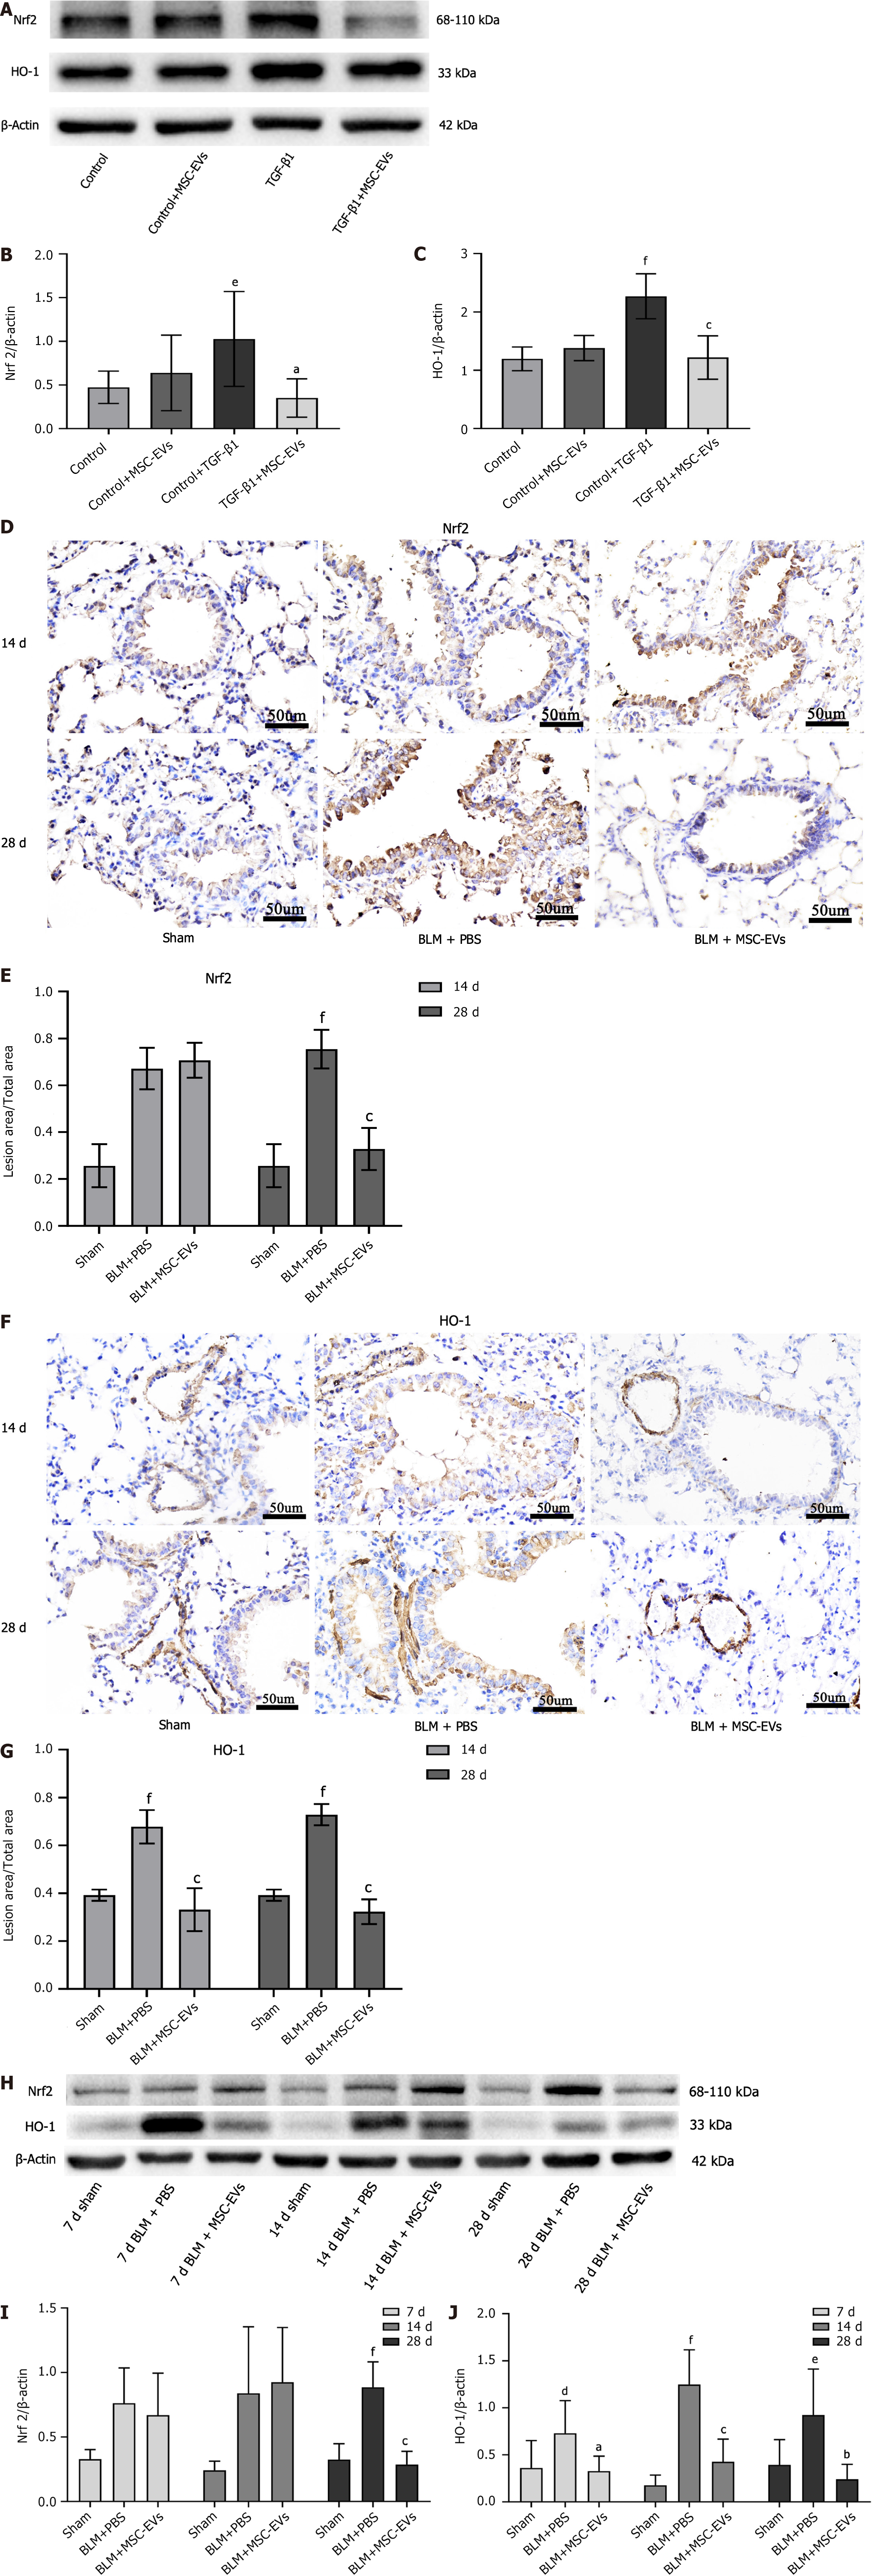
Figure 6 Mesenchymal stem cells-extracellular vesicles may alleviate pulmonary fibrosis in mice by regulating oxidative stress response in lung tissue.
A: The expressions of nuclear factor E2-related factor 2 (Nrf2) and heme oxygenase-1 (HO-1) in A549 cells of each group were verified by western blot; B and C: The statistical analysis of the expression levels of each protein. Mesenchymal stem cells-extracellular vesicles (MSC-EVs) can’t cause oxidative stress in cells (P > 0.05), and transforming growth factor (TGF)-β can cause obvious oxidative stress in A549 (Nrf2: eP < 0.01 vs control group; HO-1: fP < 0.001 vs control group), while MSC-EVs can reverse the above pathological process brought about by TGF-β (Nrf2: aP < 0.05; HO-1: cP < 0.001); D-G: The expression of Nrf2 and HO-1 in lung tissue was observed by immunohistochemical (IHC) staining (D and F). The statistical analysis of the expression level of each protein in IHC staining (E and G). On day 14 and day 28, Nrf2 (14 d: P > 0.05; 28 d: fP < 0.001 vs sham group), HO-1 (14 d: fP < 0.001 vs sham group; 28 d: fP < 0.001 vs sham group) deposition was observed in the bleomycin + phosphate buffered saline group, and the above pathological changes could be reversed after MSC-EVs treatment [Nrf2 (14 d: P > 0.05; 28 d: cP < 0.001), HO-1 (14 d: cP < 0.001; 28 d: cP < 0.001)]; H: The western blot results of the expression of Nrf2 and HO-1 in lung tissue of mice in each group; I and J: The statistical analysis of western blot results of each protein in mouse lung tissue. There were no significant changes in Nrf2 expression on day 7 (P > 0.05) and day 14 (P > 0.05) of pulmonary fibrosis development, but an increase in Nrf2 expression could be detected on day 28 (fP < 0.001 vs sham group). No matter whether on day 7, 14, or 28, the expression of HO-1 (7 d: dP < 0.05 vs sham group; 14 d: fP < 0.001 vs sham group; 28 d: eP < 0.01 vs sham group) in lung tissue of mice was significantly higher than that in the sham group. After MSC-EVs treatment, the expression of HO-1 decreased significantly at 7 d (aP < 0.05) in the acute phase, 14 d in the subacute phase (cP < 0.001), and 28 d in the chronic phase (bP < 0.01). However, the expression of Nrf2 decreased significantly only on day 28 (cP < 0.001). MSC: Mesenchymal stem cell; EV: Extracellular vesicle; BLM: Bleomycin; PBS: Phosphate buffered saline; Nrf2: Nuclear factor E2-related factor 2; HO-1: Heme oxygenase-1.
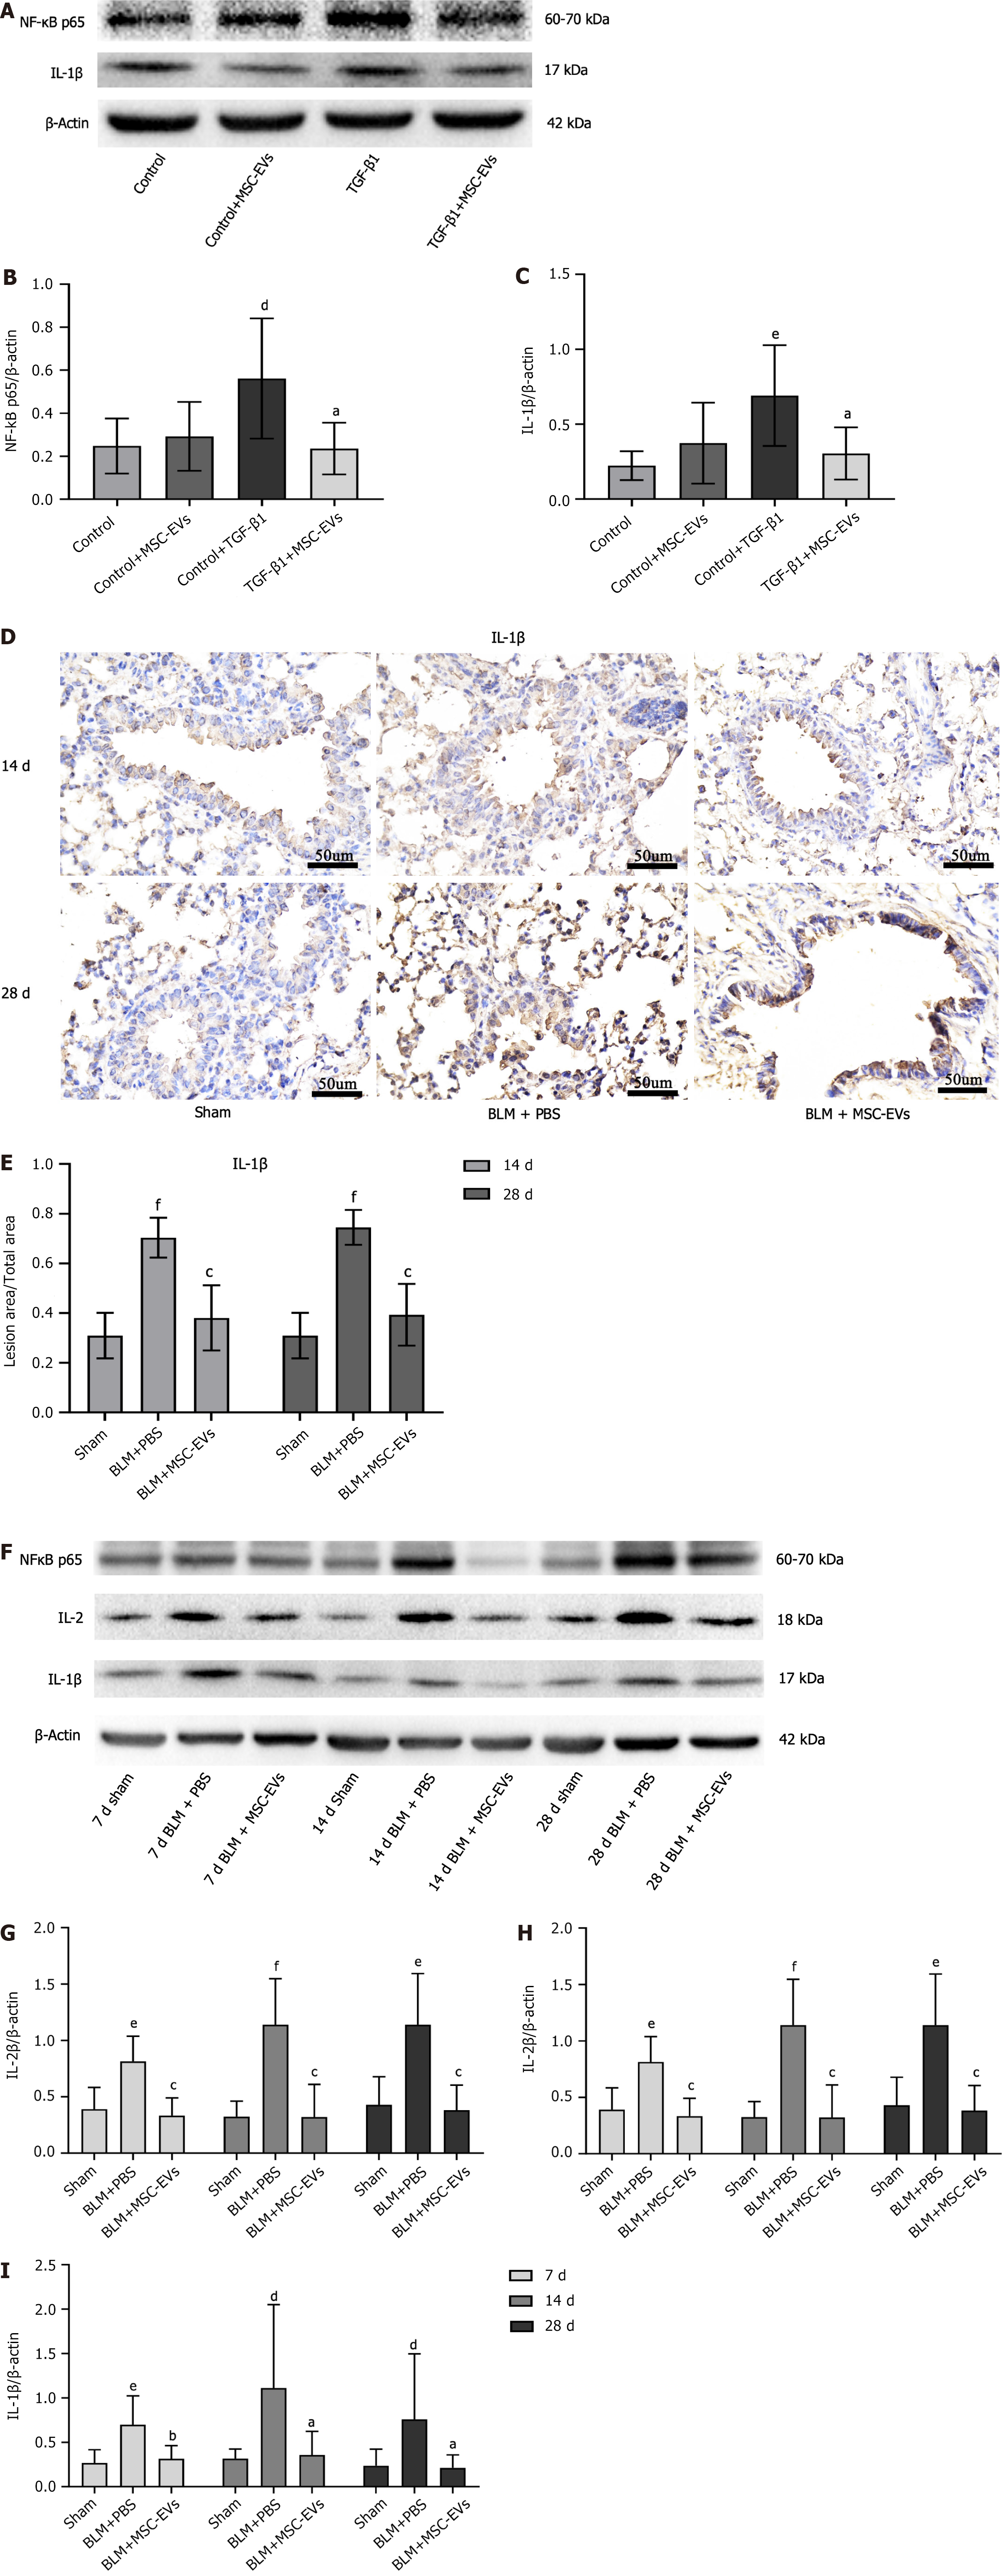
Figure 7 Mesenchymal stem cells-extracellular vesicles can inhibit the inflammatory response in the process of pulmonary fibrosis.
A: The expressions of nuclear factor-kappaB (NF-κB) p65 and interleukin (IL)-1β in A549 cells of each group were verified by western blot; B and C: The statistical analysis of the expression levels of each protein. MSV-EVs can’t induce an immune inflammatory response (P > 0.05). Transforming growth factor (TGF)-β can induce the immune inflammatory response of cells (NF-κB p65: dP < 0.05 vs control group; IL-1β: eP < 0.01 vs control group). However, mesenchymal stem cells-extracellular vesicles (MSC-EVs) can reverse the immune inflammatory response caused by TGF-β (NF-κB p65: aP < 0.05; IL-1β: aP < 0.05); D: The expression of IL-1β in lung tissue was observed by immunohistochemical (IHC) staining; E: The statistical analysis of the expression level of IL-1β in IHC staining. On day 14 and day 28, IL-1β (14 d: fP < 0.001 vs sham group; 28 d: fP < 0.001 vs sham group) deposition was observed in the bleomycin + phosphate buffered saline group, and the above pathological changes could be reversed after MSC-EVs treatment (14 d: cP < 0.001; 28 d: cP < 0.001); F: The western blot results of each protein’s expression in mice’s lung tissue in each group; G-I: The statistical analysis of western blot results of each protein in mouse lung tissue. No matter whether on day 7, 14, or 28, the expression of immune inflammatory response gene-related nuclear factor-kappaB (NF-κB) p65 (7 d: dP < 0.05 vs sham group; 14 d: eP < 0.01 vs sham group; 28 d: dP < 0.05 vs sham group), IL-2 (7 d: eP < 0.01 vs sham group; 14 d: fP < 0.001 vs sham group; 28 d: eP < 0.01 vs sham group) and IL-1β (7 d: eP < 0.01 vs sham group; 14 d: dP < 0.05 vs sham group; 28 d: dP < 0.05 vs sham group) in lung tissue of mice was significantly higher than that in the sham group. After MSC-EVs treatment, the expression of NF-κB p65, IL-2, and IL-1β decreased significantly at 7 d (NF-κB p65: aP < 0.05; IL-2: cP < 0.001; IL-1β: bP < 0.01) in the acute phase, 14 d in subacute phase (NF-κB p65: bP < 0.01; IL-2: cP < 0.001; IL-1β: aP < 0.05) and 28 d in chronic phase (NF-κB p65: aP < 0.05; IL-2: cP < 0.001; IL-1β: aP < 0.05). MSC: Mesenchymal stem cell; EV: Extracellular vesicle; BLM: Bleomycin; PBS: Phosphate buffered saline; TGF: Transforming growth factor; NF-κB: Nuclear factor-kappaB; IL: Interleukin.
- Citation: Gao Y, Liu MF, Li Y, Liu X, Cao YJ, Long QF, Yu J, Li JY. Mesenchymal stem cells-extracellular vesicles alleviate pulmonary fibrosis by regulating immunomodulators. World J Stem Cells 2024; 16(6): 670-689
- URL: https://www.wjgnet.com/1948-0210/full/v16/i6/670.htm
- DOI: https://dx.doi.org/10.4252/wjsc.v16.i6.670


