Copyright
©The Author(s) 2024.
World J Stem Cells. May 26, 2024; 16(5): 538-550
Published online May 26, 2024. doi: 10.4252/wjsc.v16.i5.538
Published online May 26, 2024. doi: 10.4252/wjsc.v16.i5.538
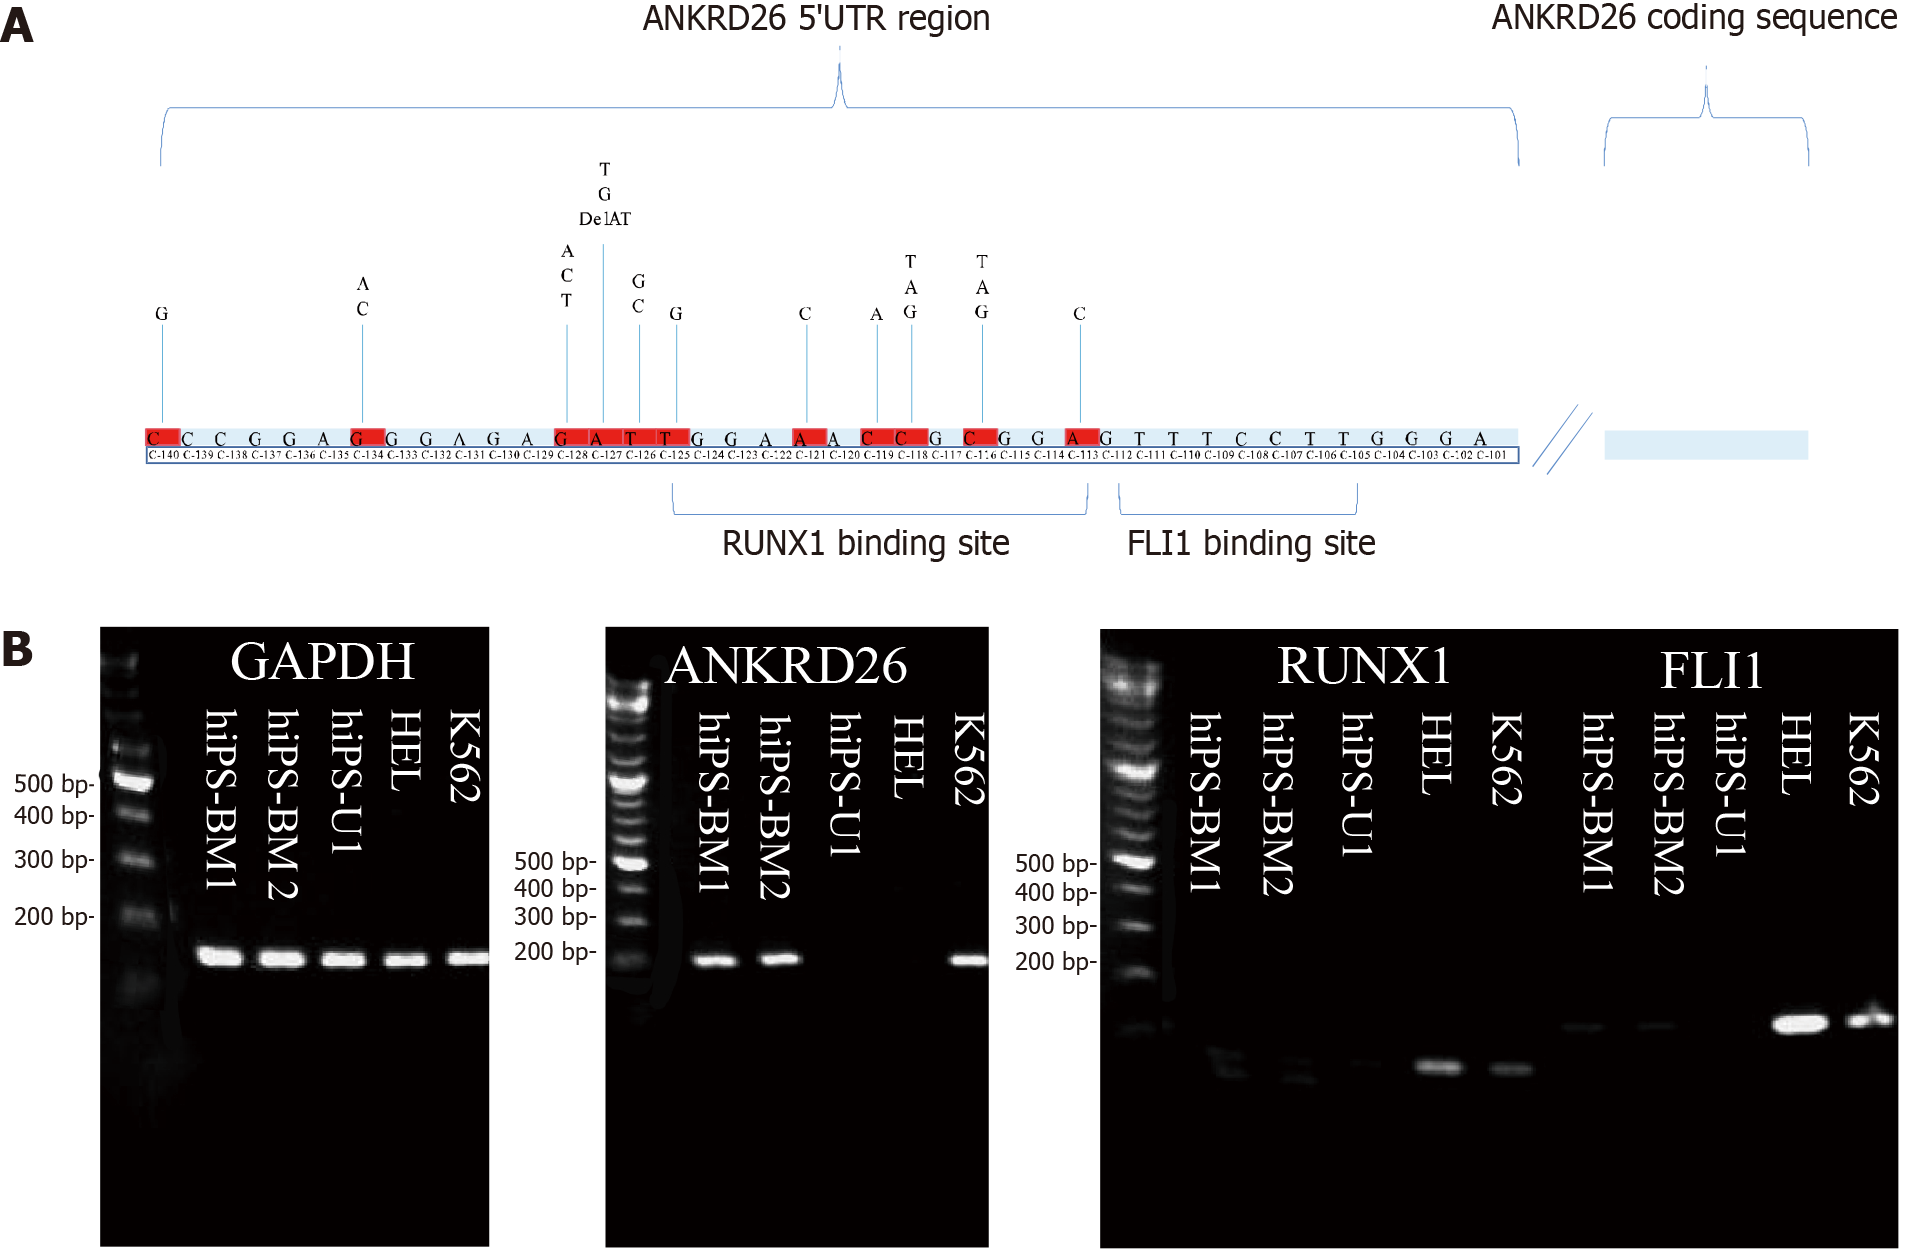
Figure 1 The expression of ankyrin repeat domain containing 26 varied in induced pluripotent stem cells derived from bone marrow and the urothelium.
A: Schematic structure of the 5’-untranslated region ankyrin repeat domain containing 26 (ANKRD26) region and its relationship with the Runt related transcription factor 1 (RUNX1) and friend leukemia integration 1 (FLI1) binding sites. The bases in red represent the mutation sites reported in the literature; B: Agarose gels after polymerase chain reaction to assess the expression of ANKRD26, RUNX1 and FLI1 in HEL, K562, human induced pluripotent stem cells derived from bone marrow, and human induced pluripotent stem cells derived from urothelium. UTR: Untranslated region; ANKRD26: Ankyrin repeat domain containing 26; RUNX1: Runt related transcription factor 1; FLI1: Friend leukemia integration 1; hiPSC-BM: Human induced pluripotent stem cells derived from bone marrow; hiPSC-U: Human induced pluripotent stem cells derived from urothelium.
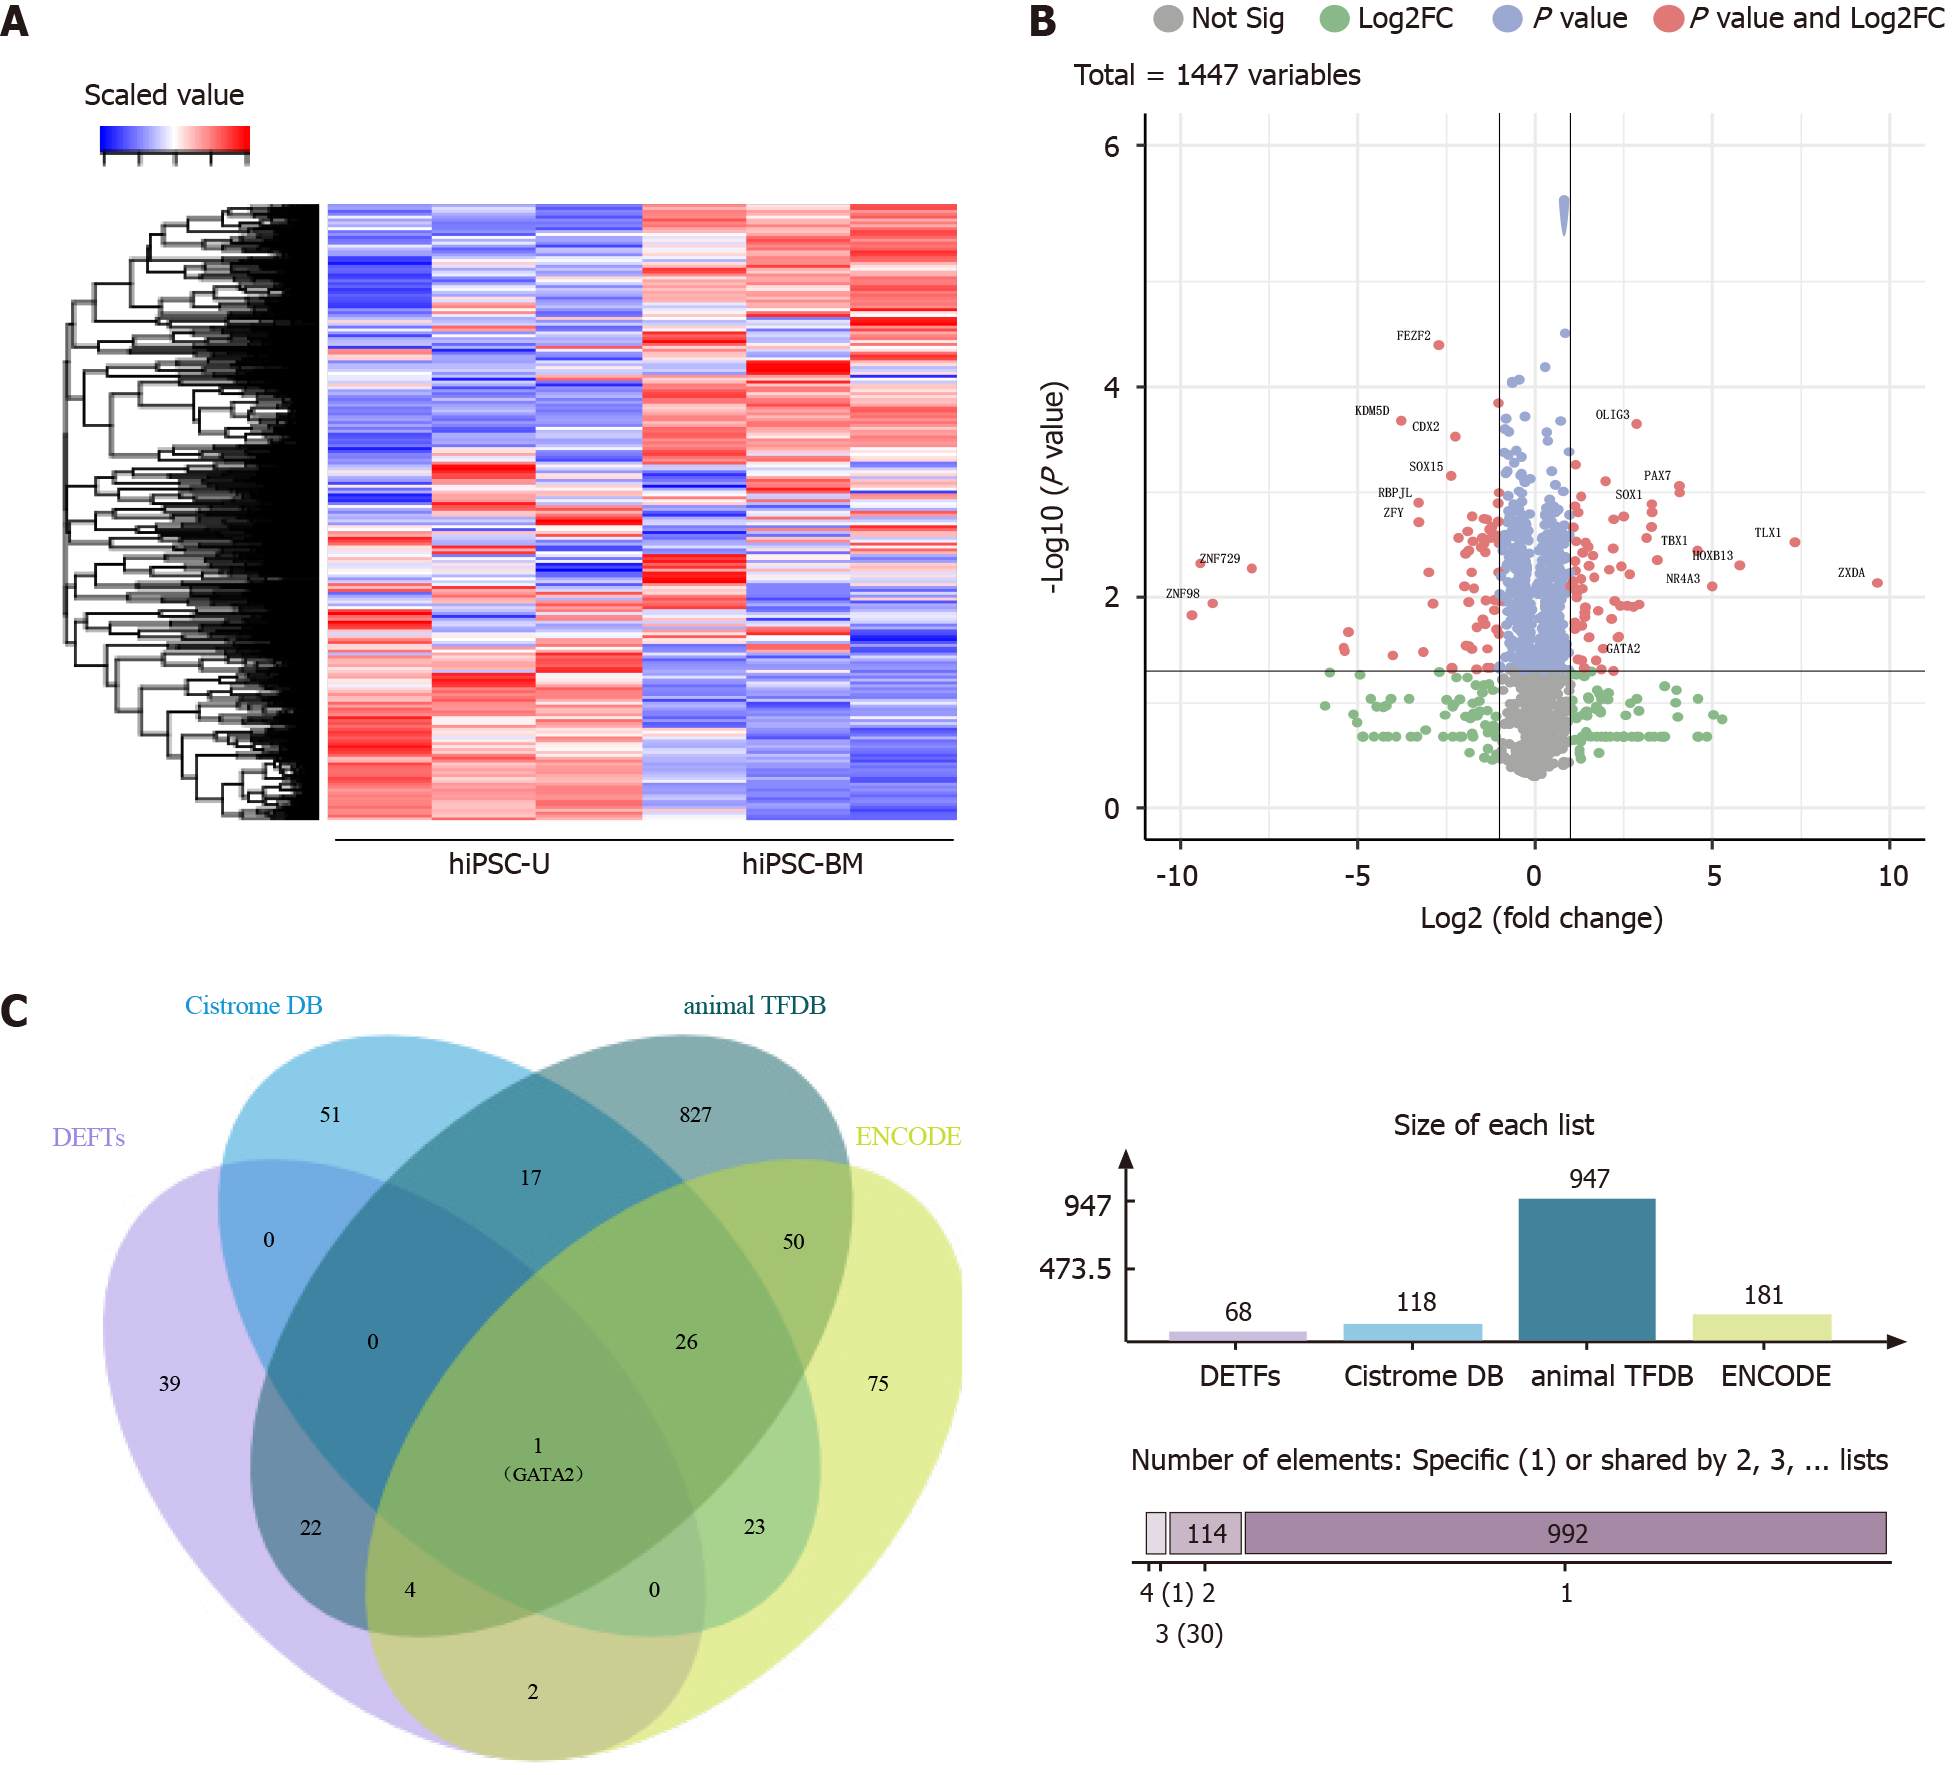
Figure 2 The transcription factor GATA binding protein 2 is potentially involved in regulating ankyrin repeat domain containing 26 expression.
A: A heatmap showing the expression patterns of transcription factor (TF) genes in human induced pluripotent stem cells derived from bone marrow (hiPSC-BM) and human induced pluripotent stem cells derived from urothelium (hiPSC-U); B: A volcano plot showing the differentially expressed TF genes in hiPSC-BM and hiPSC-U. Red dots represent TF genes with significant differential expression; C: Venn diagram showing overlaps of ankyrin repeat domain containing 26 (ANKRD26) related transcription factors from the Cistrome DB, animal TFDB, ENCODE and transcriptome (differentially expressed transcription factors)[41]. DETFs: Differentially expressed transcription factors; GATA2: GATA binding protein 2; hiPSC-BM: Human induced pluripotent stem cells derived from bone marrow; hiPSC-U: Human induced pluripotent stem cells derived from urothelium.
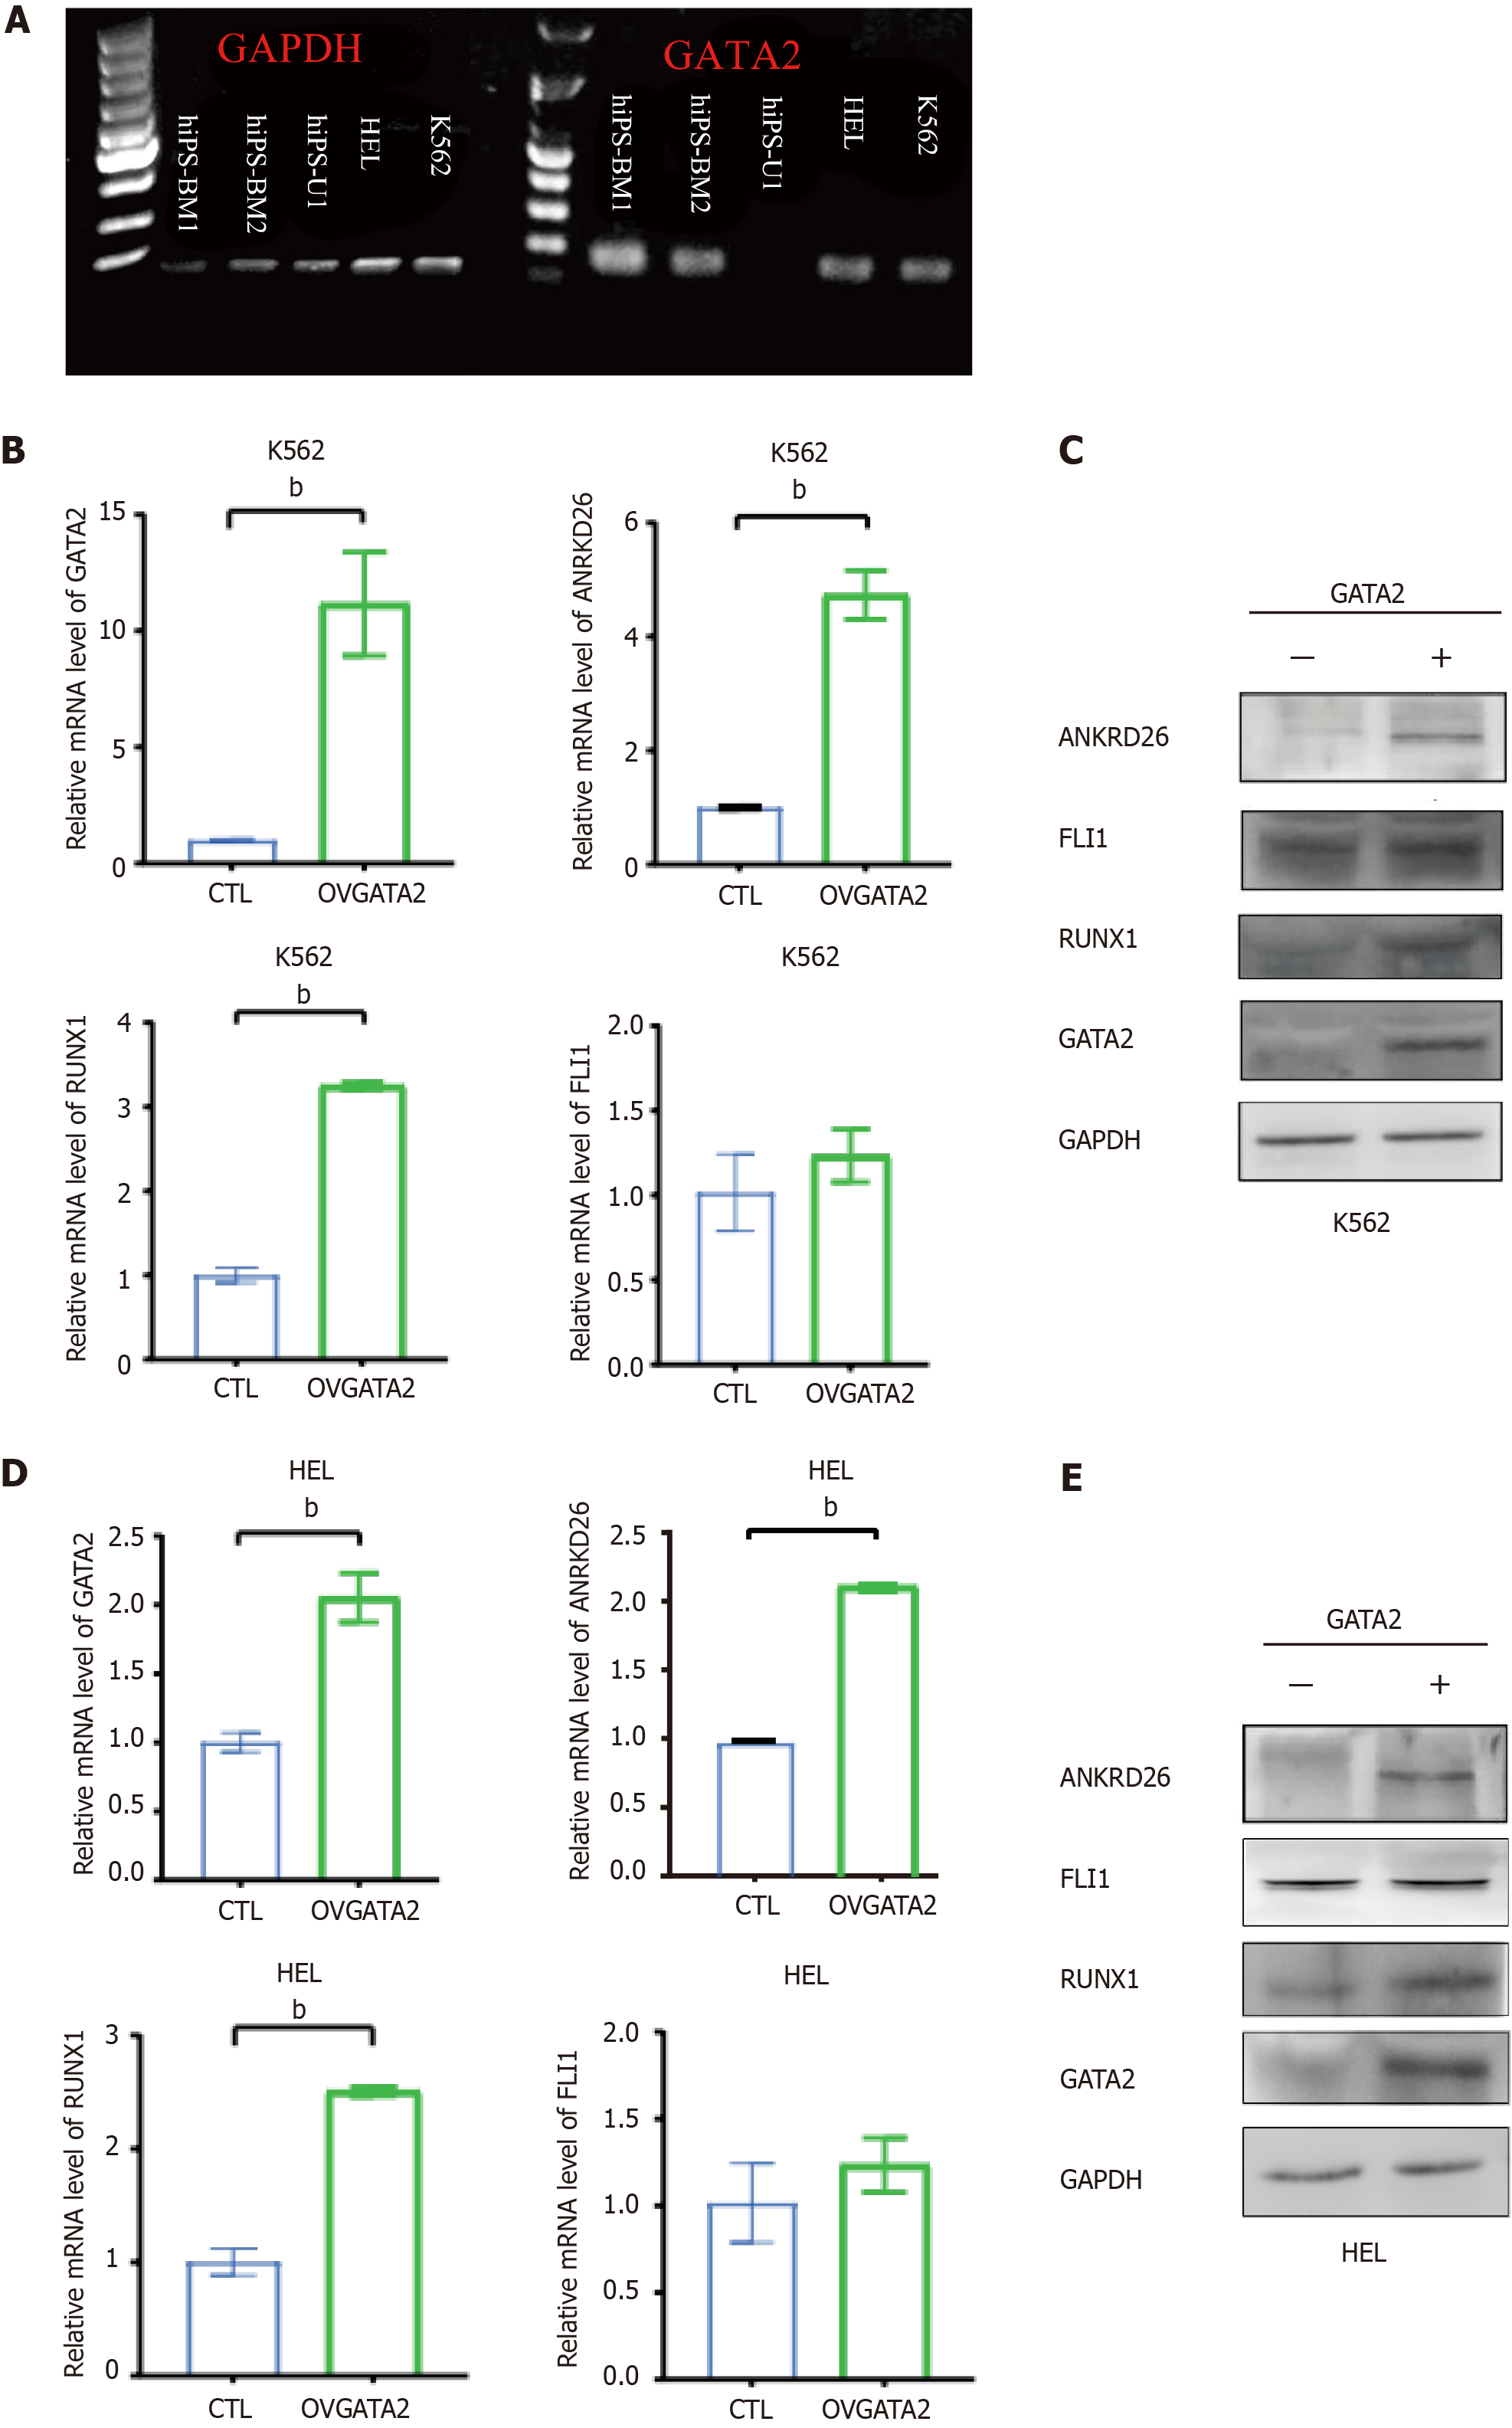
Figure 3 The expression of ankyrin repeat domain containing 26 is upregulated by the overexpression of GATA binding protein 2.
A: Agarose gels after polymerase chain reaction (PCR) to assess the expression of GATA binding protein 2 (GATA2) in HEL, K562, human induced pluripotent stem cells derived from bone marrow (hiPSC-BM) and human induced pluripotent stem cells derived from urothelium (hiPSC-U); B: Quantitative real-time PCR (RT-qPCR) analyses showing the promoting effect of GATA2 on ankyrin repeat domain containing 26 (ANKRD26) mRNA expression. K562 cells were transfected with GATA2 plasmids and control plasmids; C: Western blots showing the effect of GATA2 on promoting ANKRD26 protein expression in K562 cells; D: RT-qPCR analyses showing the effect of GATA2 on promoting ANKRD26 mRNA expression. HEL cells were transfected with GATA2 plasmids and control plasmids; E: Western blots showing the effect of GATA2 on promoting ANKRD26 expression at the protein level in HEL cells. The error bars represent the means ± SD of triplicate samples. bP < 0.01, calculated by Student’s t test. GATA2: GATA binding protein 2; ANKRD26: Ankyrin repeat domain containing 26; RUNX1: Runt related transcription factor 1; FLI1: Friend leukemia integration 1; hiPSC-BM: Human induced pluripotent stem cells derived from bone marrow; hiPSC-U: Human induced pluripotent stem cells derived from urothelium.
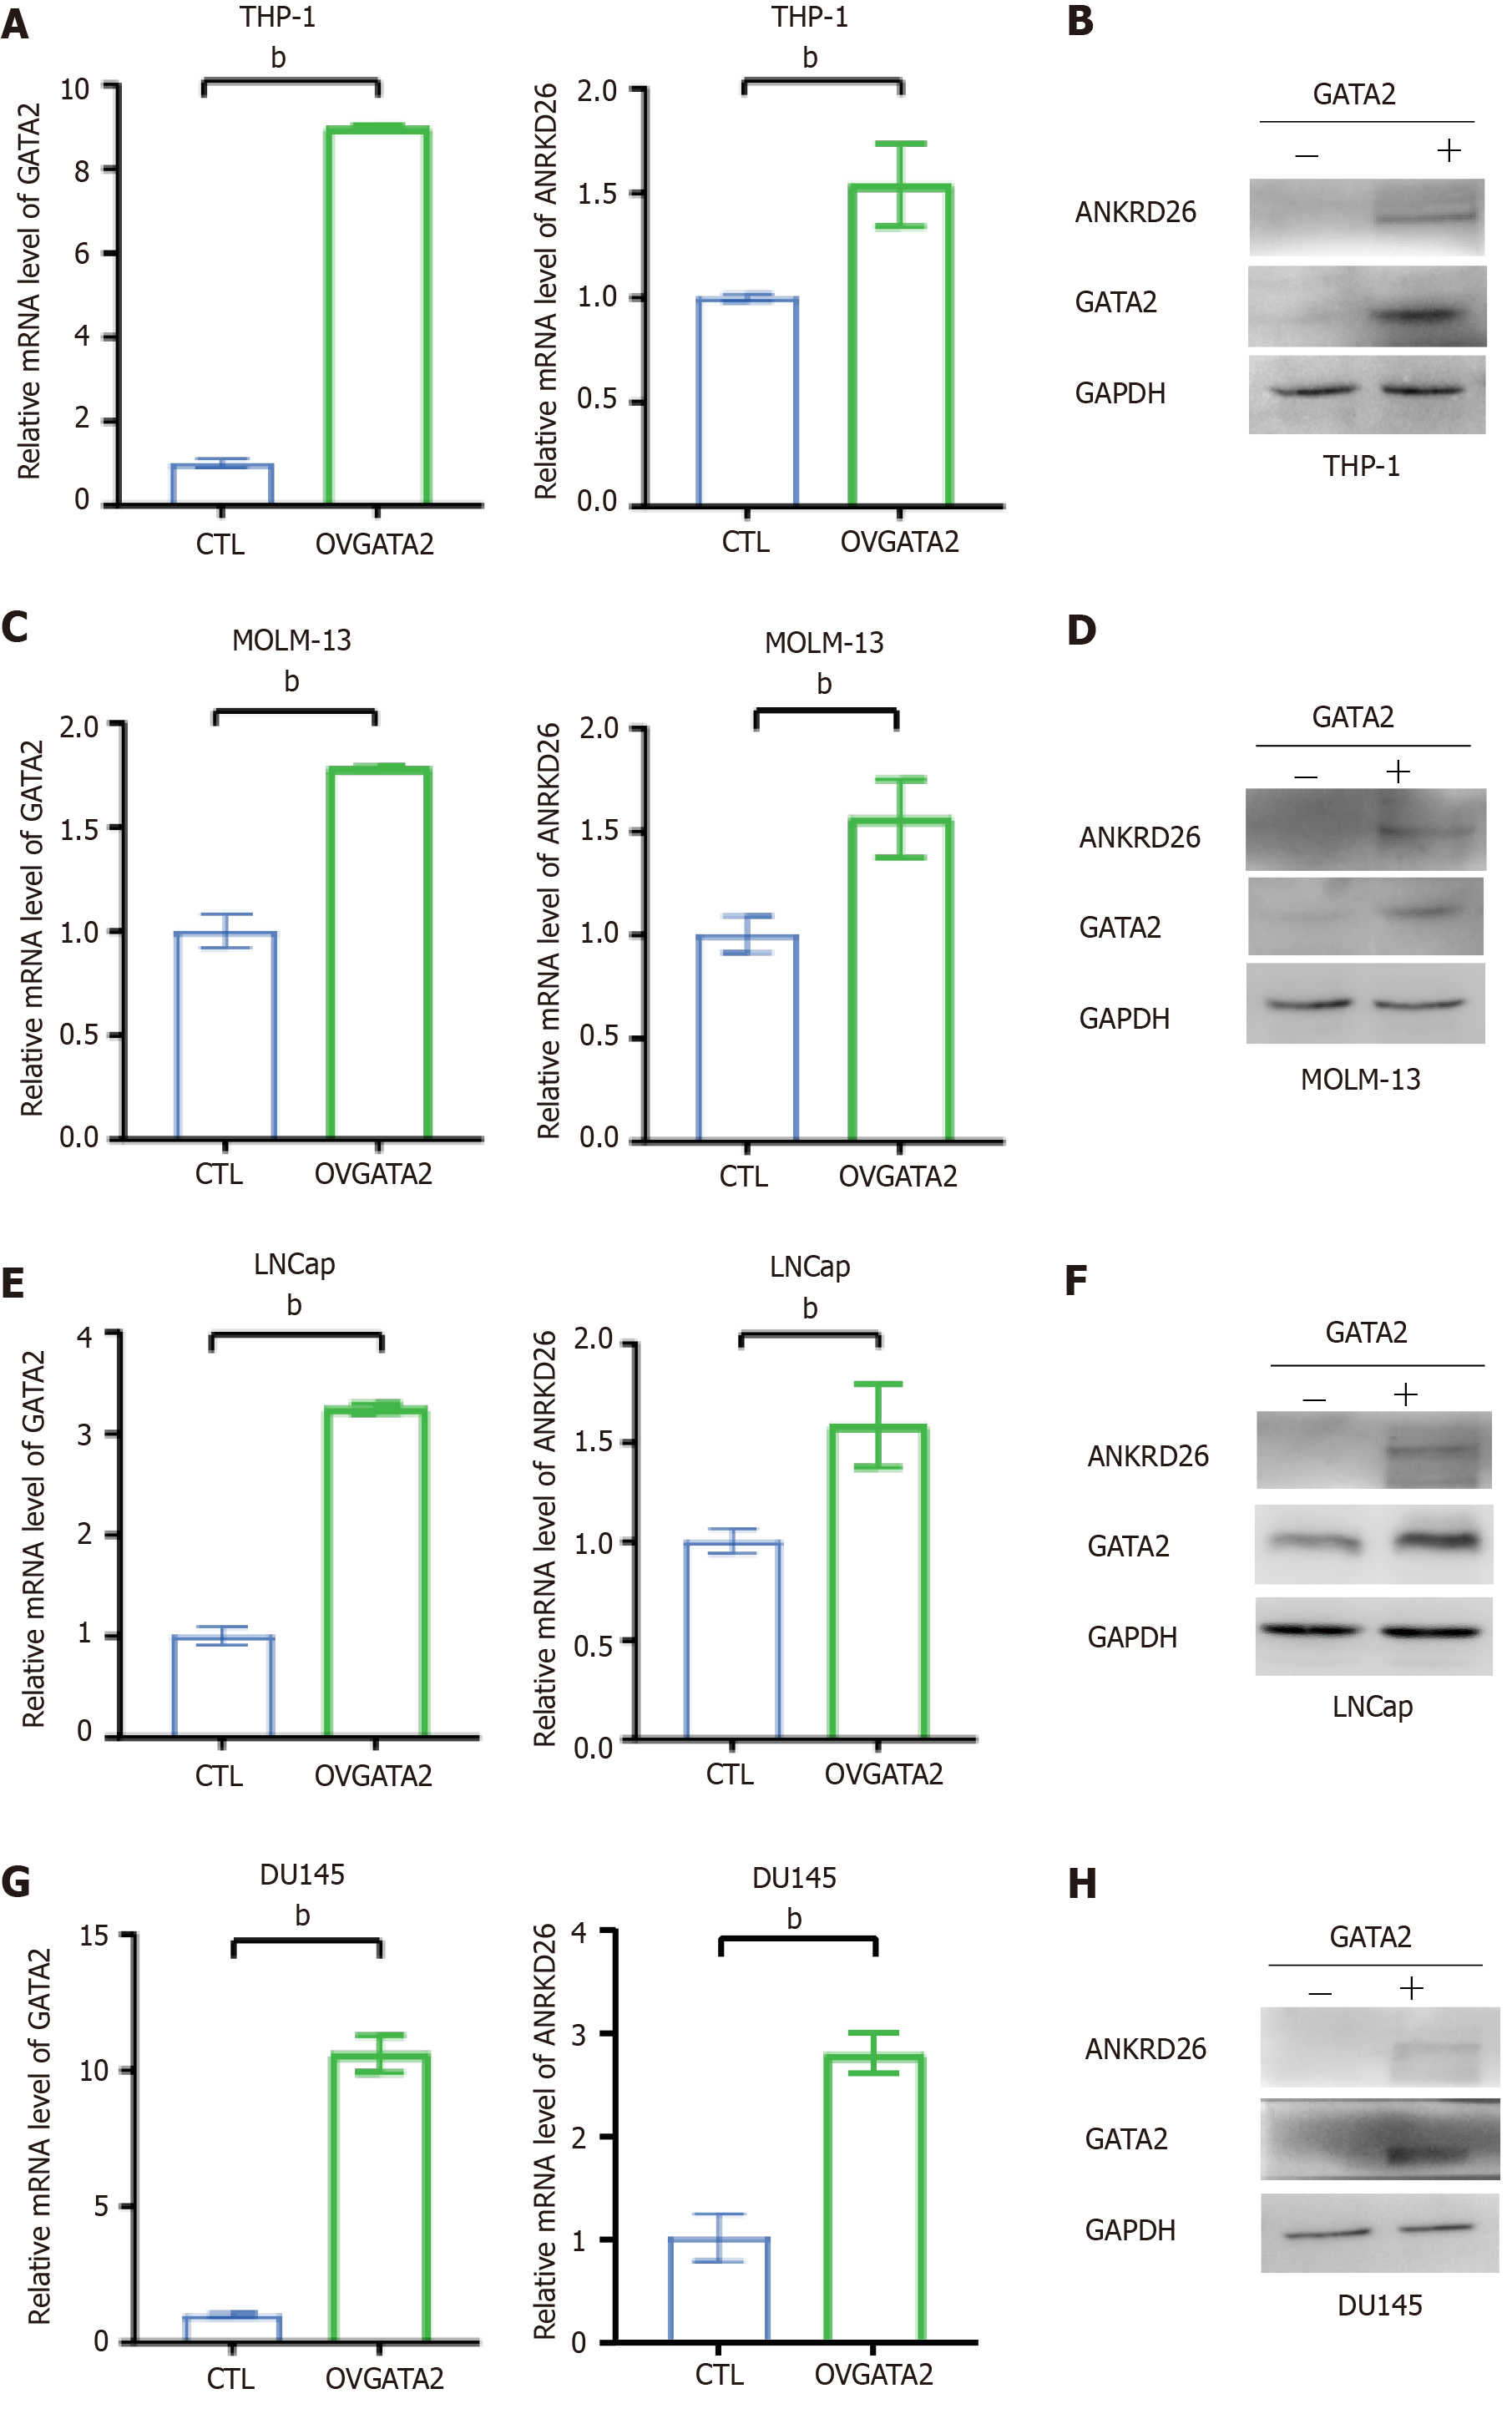
Figure 4 The regulation of ankyrin repeat domain containing 26 by GATA binding protein 2 overexpression in bone marrow- and urothelium-derived cell lines.
A-D: Quantitative real-time polymerase chain reaction (RT-qPCR) and western blot analyses showing that GATA binding protein 2 (GATA2) promoted ankyrin repeat domain containing 26 (ANKRD26) expression in two bone marrow-derived cell lines (THP-1 and MOLM-13); E-H: RT-qPCR and western blot analyses showing that GATA2 promoted ANKRD26 expression in two urothelium-derived cell lines (LNCaP and DU145). The error bars represent the means ± SD of triplicate samples. aP < 0.05; bP < 0.01, calculated by Student’s t test. GATA2: GATA binding protein 2; ANKRD26: Ankyrin repeat domain containing 26.
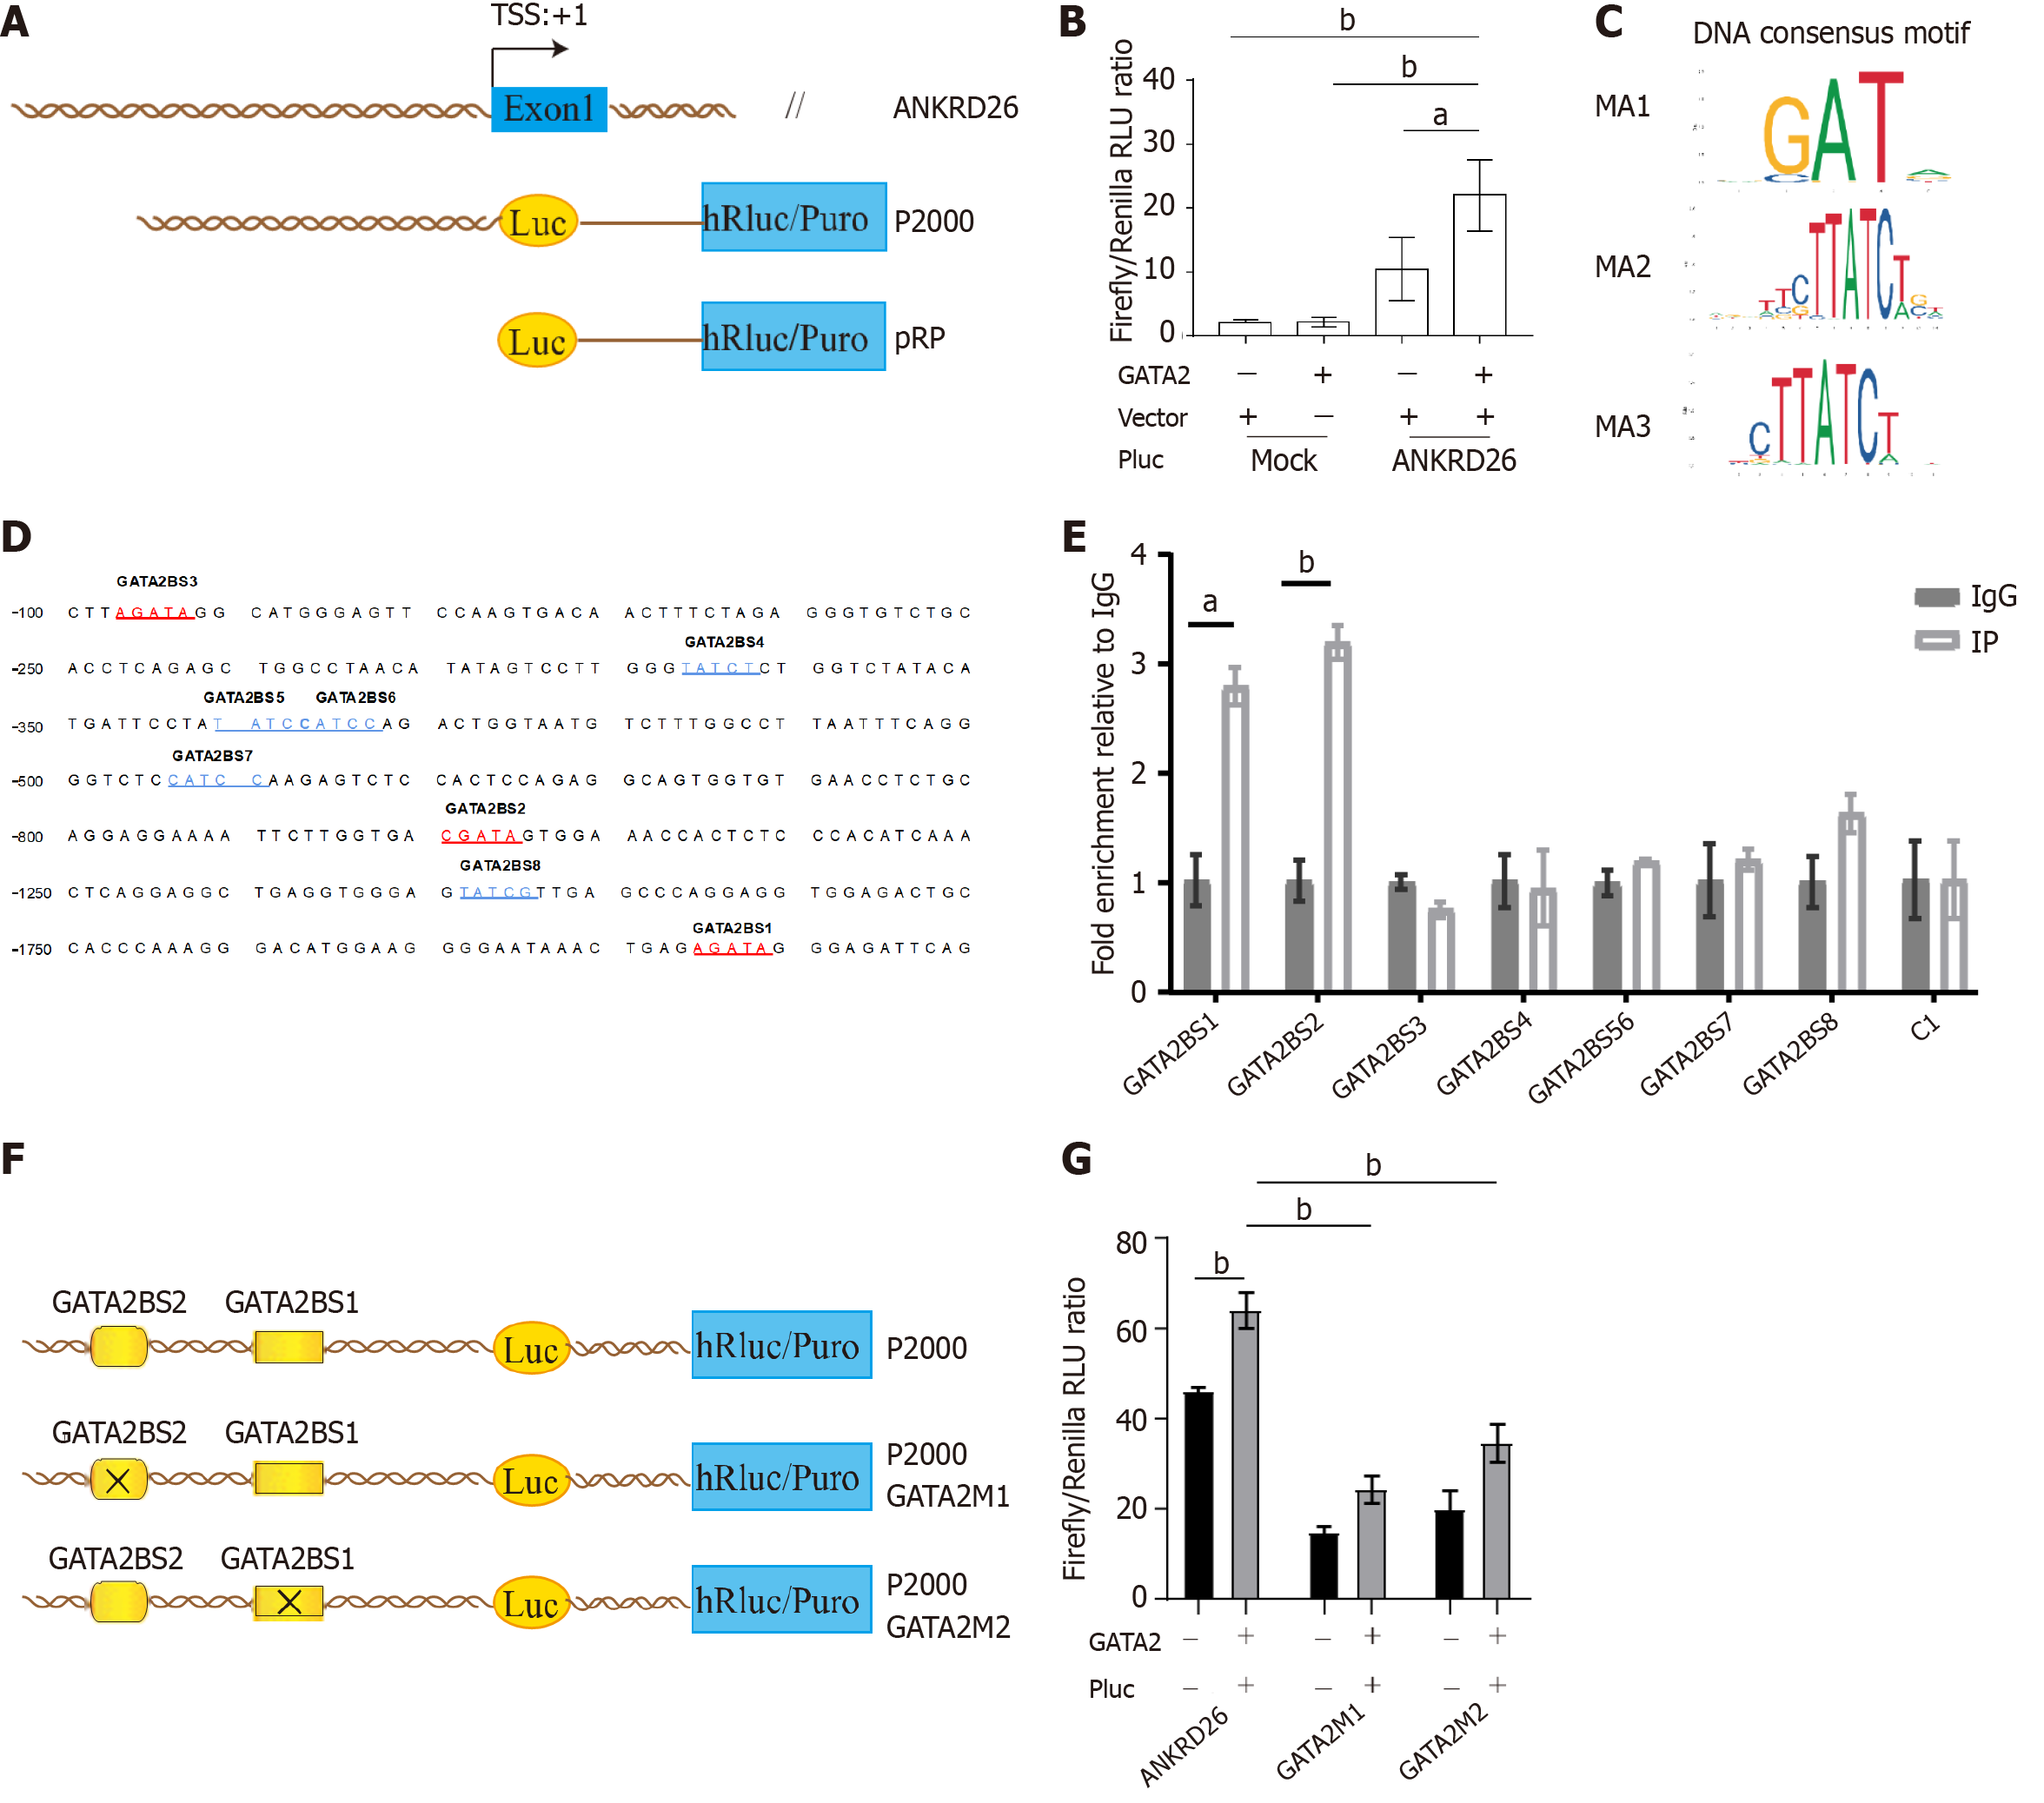
Figure 5 GATA binding protein 2 promotes ankyrin repeat domain containing 26 expression by binding to its promoter region.
A: Schematic diagram of the ankyrin repeat domain containing 26 (ANKRD26) gene promoter reporter constructs. The constructs are named P-length. The open box shows the first exon of ANKRD26, and the positions relative to the major ANKRD26 transcription start site (+1) are indicated. The pRP represents an empty vector (mock); B: The empty (mock) or ANKRD26 (P2000) dual-luciferase reporter constructs were cotransfected into K562 cells with control plasmids or plasmids expressing GATA binding protein 2 (GATA2) in synergy. Cell extracts were analyzed for luciferase activity; C: DNA consensus motifs of GATA2; D: The eight potential GATA2 binding sites on the ANKRD26 promoter region. Red-marked sites are on the sense strand, and blue-marked sites are on the antisense strand; E: Chromatin immunoprecipitation assays performed in K562 cells show that GATA2 directly binds to the ANKRD26 promoter region. The binding sites of GATA2BS1 to GATA2BS8 encompass the 8 predicted binding sites in (D). C1, which encompasses the region without GATA2 binding sites, was used as the negative control; F: Schematic diagram of site-directed mutagenesis of GATA2 binding sites in the ANKRD26 promoter. The two potential GATA2 binding sites are indicated as open boxes (GATA2BS1 and GATA2BS2). The indicated point mutation is denoted by a cross; G: Dual-luciferase assays showing that two mutated GATA2 binding sites block GATA2 Luciferase-promoting activity. The error bars represent the means ± SDs of triplicate samples. aP < 0.05; bP < 0.01, calculated by Student’s t test. GATA2: GATA binding protein 2.
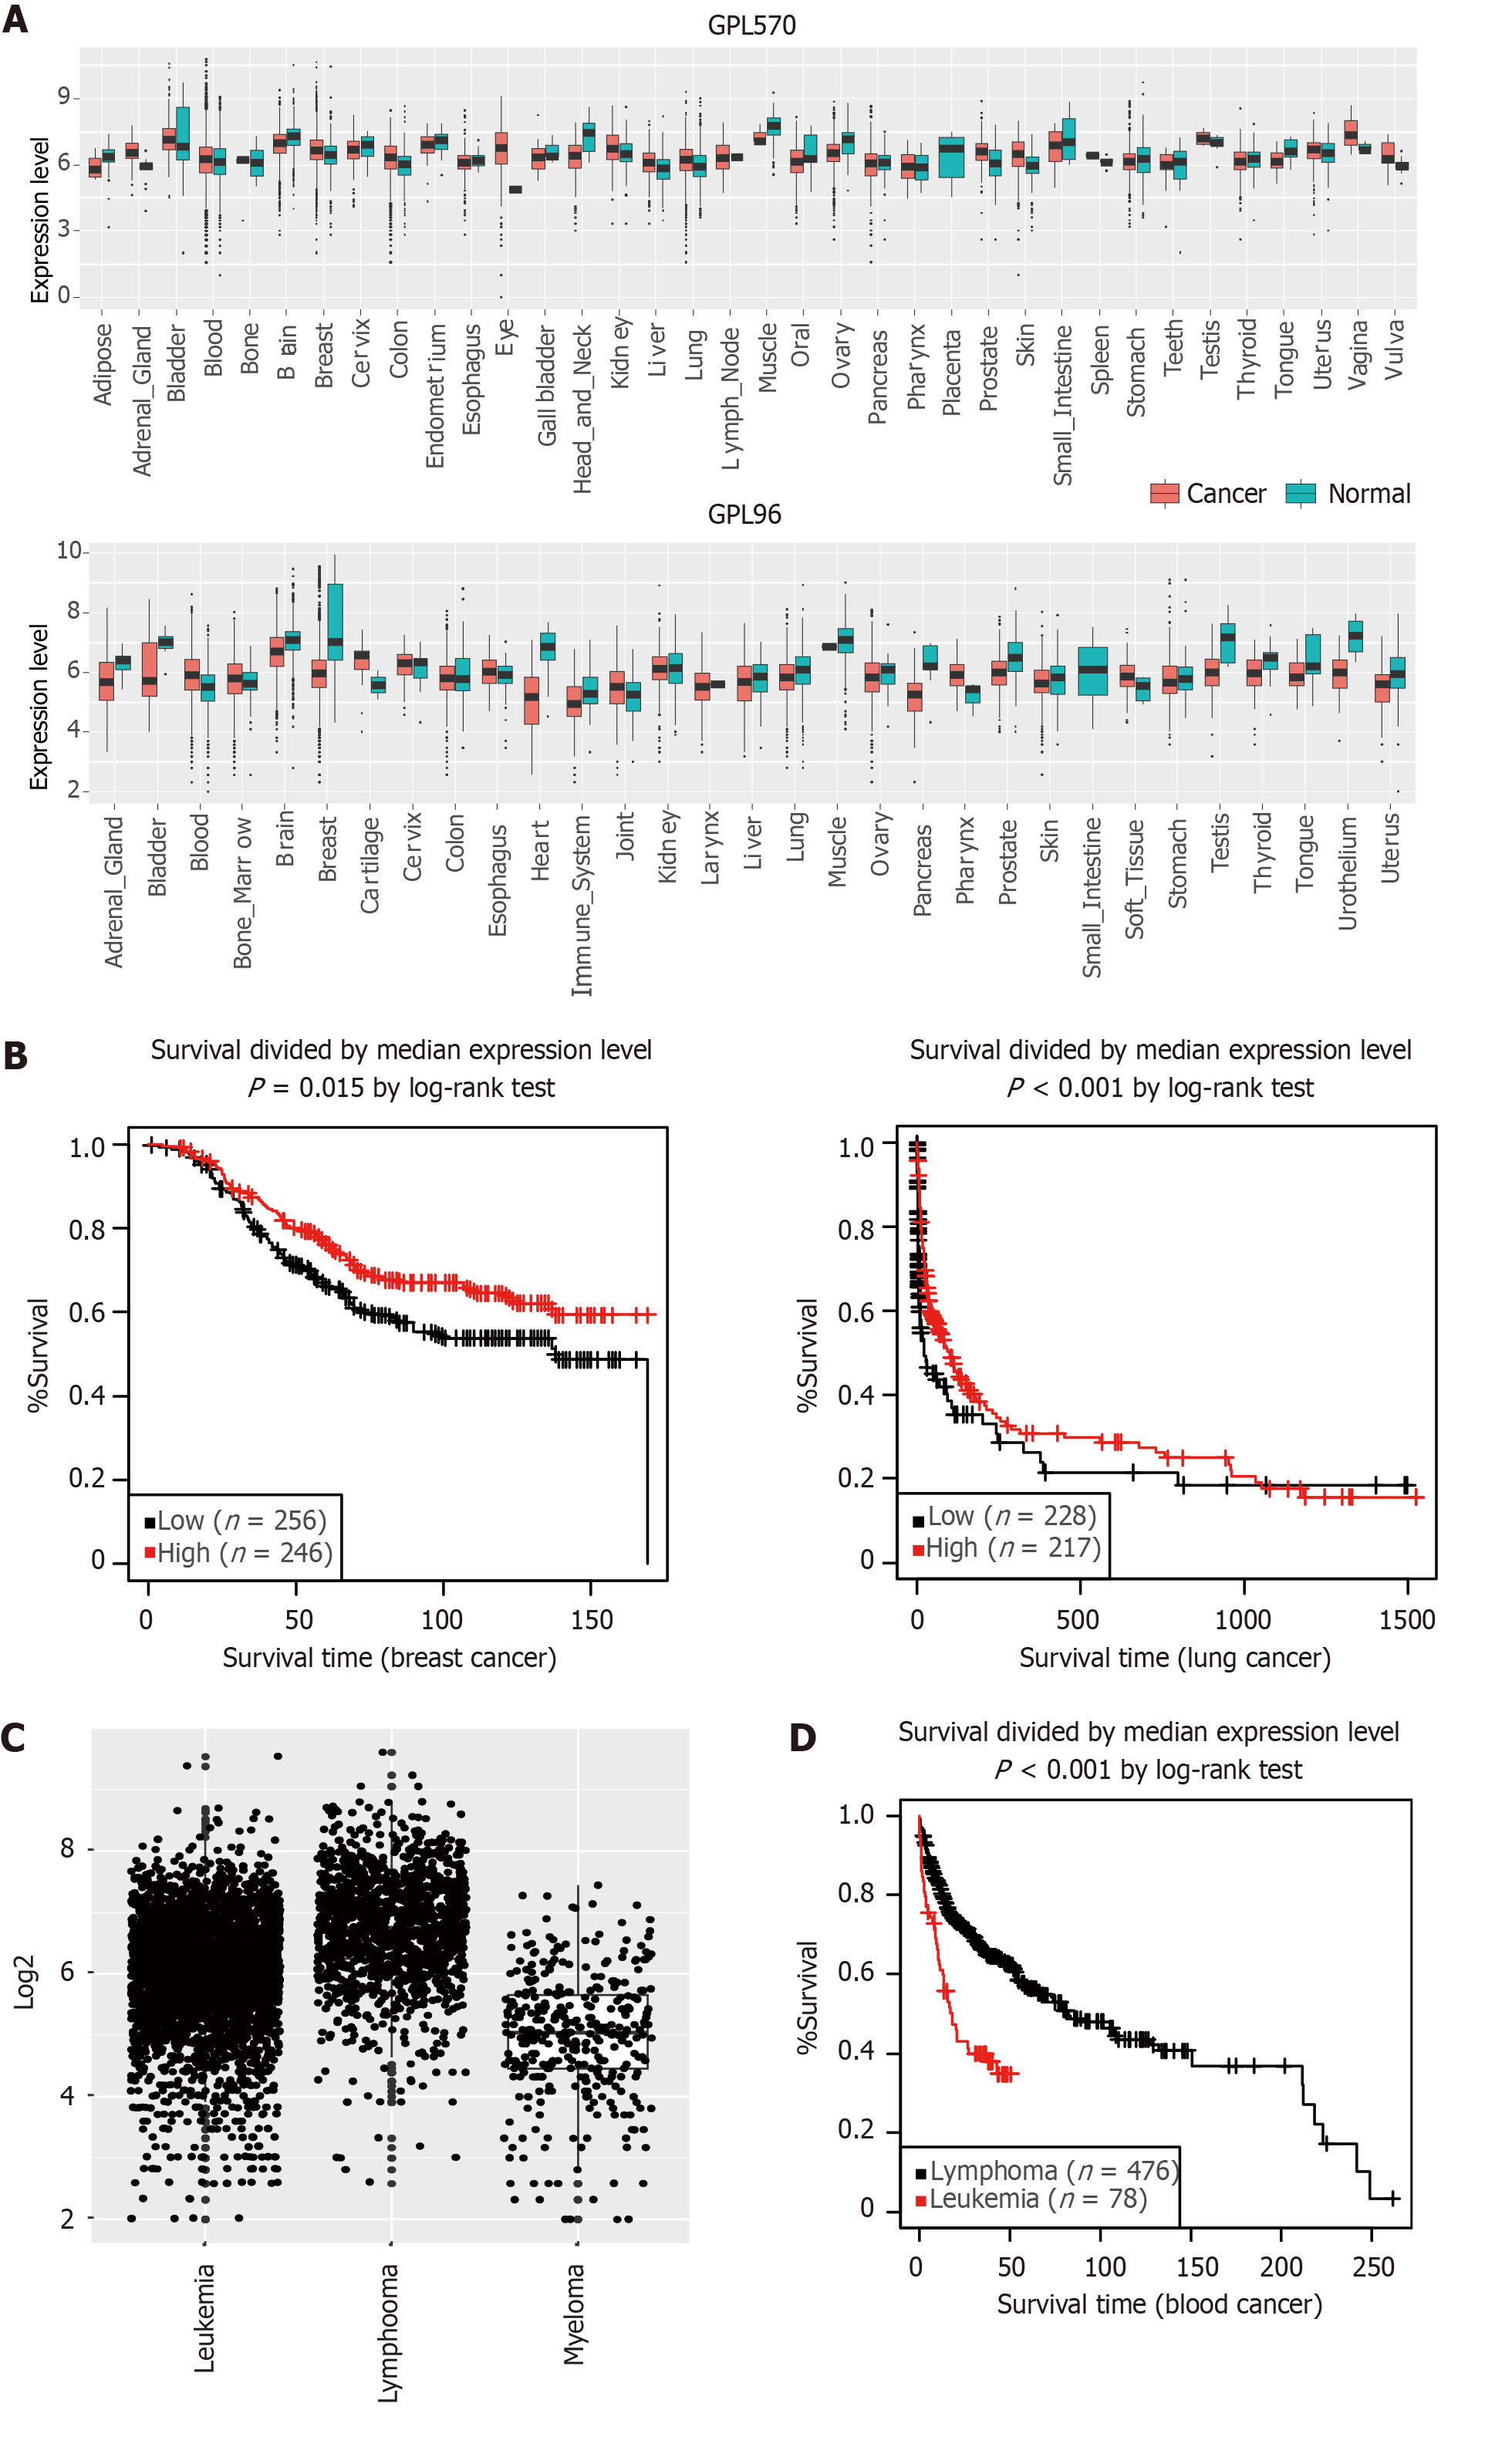
Figure 6 The importance of ankyrin repeat domain containing 26 in cancers.
A: Two boxplots of ankyrin repeat domain containing 26 (ANKRD26) gene expression profiles from the GPL570 and GPL96 platforms. Red indicates a boxplot of cancer samples. Blue indicates a boxplot of normal samples; B: Kaplan-Meier plots by median cutoff showing an association between ANKRD26 expression and overall survival (left is in breast cancer, and right is in lung cancer); C: Box and dot plot of each subtype of blood cancer; D: Kaplan-Meier plots by subtypes showing an association between ANKRD26 expression and blood cancer subtypes.
- Citation: Jiang YZ, Hu LY, Chen MS, Wang XJ, Tan CN, Xue PP, Yu T, He XY, Xiang LX, Xiao YN, Li XL, Ran Q, Li ZJ, Chen L. GATA binding protein 2 mediated ankyrin repeat domain containing 26 high expression in myeloid-derived cell lines. World J Stem Cells 2024; 16(5): 538-550
- URL: https://www.wjgnet.com/1948-0210/full/v16/i5/538.htm
- DOI: https://dx.doi.org/10.4252/wjsc.v16.i5.538


