Copyright
©The Author(s) 2024.
World J Stem Cells. Apr 26, 2024; 16(4): 444-458
Published online Apr 26, 2024. doi: 10.4252/wjsc.v16.i4.444
Published online Apr 26, 2024. doi: 10.4252/wjsc.v16.i4.444
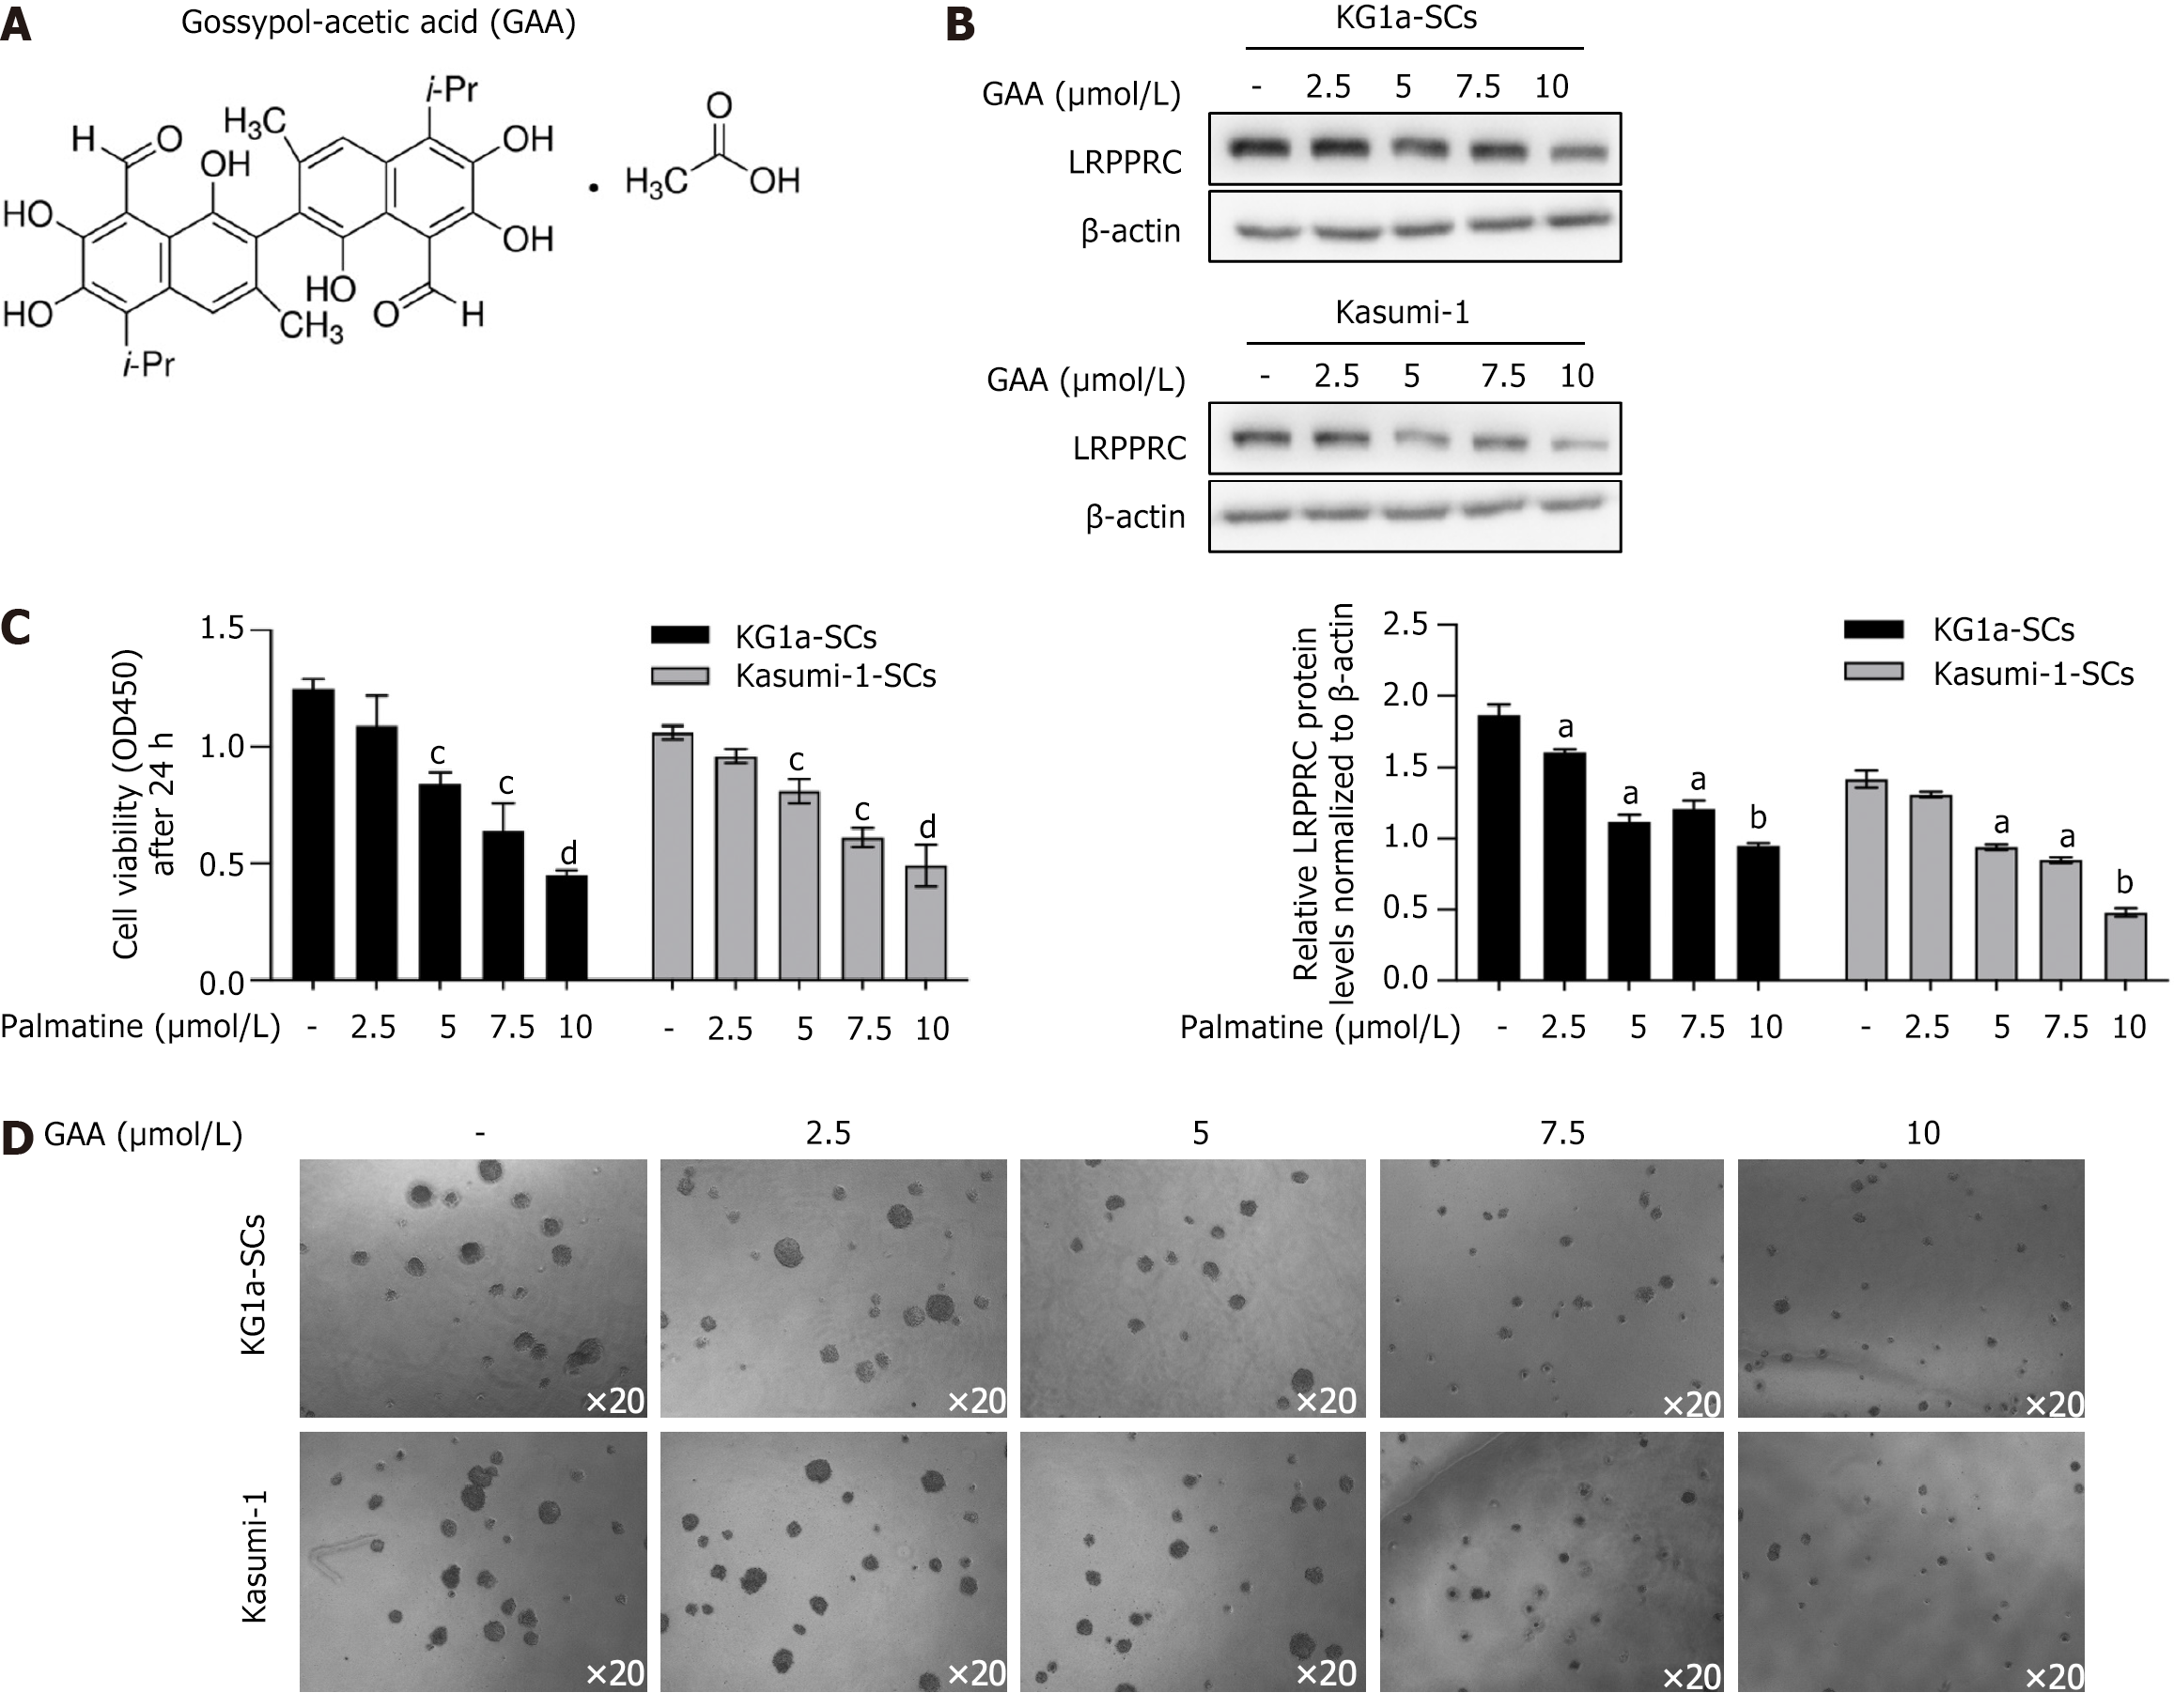
Figure 1 Gossypol acetic acid decreased leucine-rich pentatricopeptide repeat-containing protein and inhibited leukemia stem cell progression.
A: Molecular structure of gossypol acetic acid (GAA) was presented; B: After being treated with 2.5, 5, 7.5, 10 μmol/L GAA for 24 h, leucine-rich pentatricopeptide repeat-containing protein was measured by performing western blot; C: After being cultured with 2.5, 5, 7.5, 10 μmol/L GAA for 24 h, cell viability was measured by performing CCK-8 assay. aP < 0.05, vs KG1a-SCs; bP < 0.01, vs KG1a-SCs; cP < 0.05, vs Kasumi-1-SCs; dP < 0.01, vs Kasumi-1-SCs; D: With presence of 2.5, 5, 7.5, 10 μmol/L GAA, colony formation assay was performed. LRPPRC: Leucine-rich pentatricopeptide repeat-containing protein; GAA: Gossypol acetic acid.
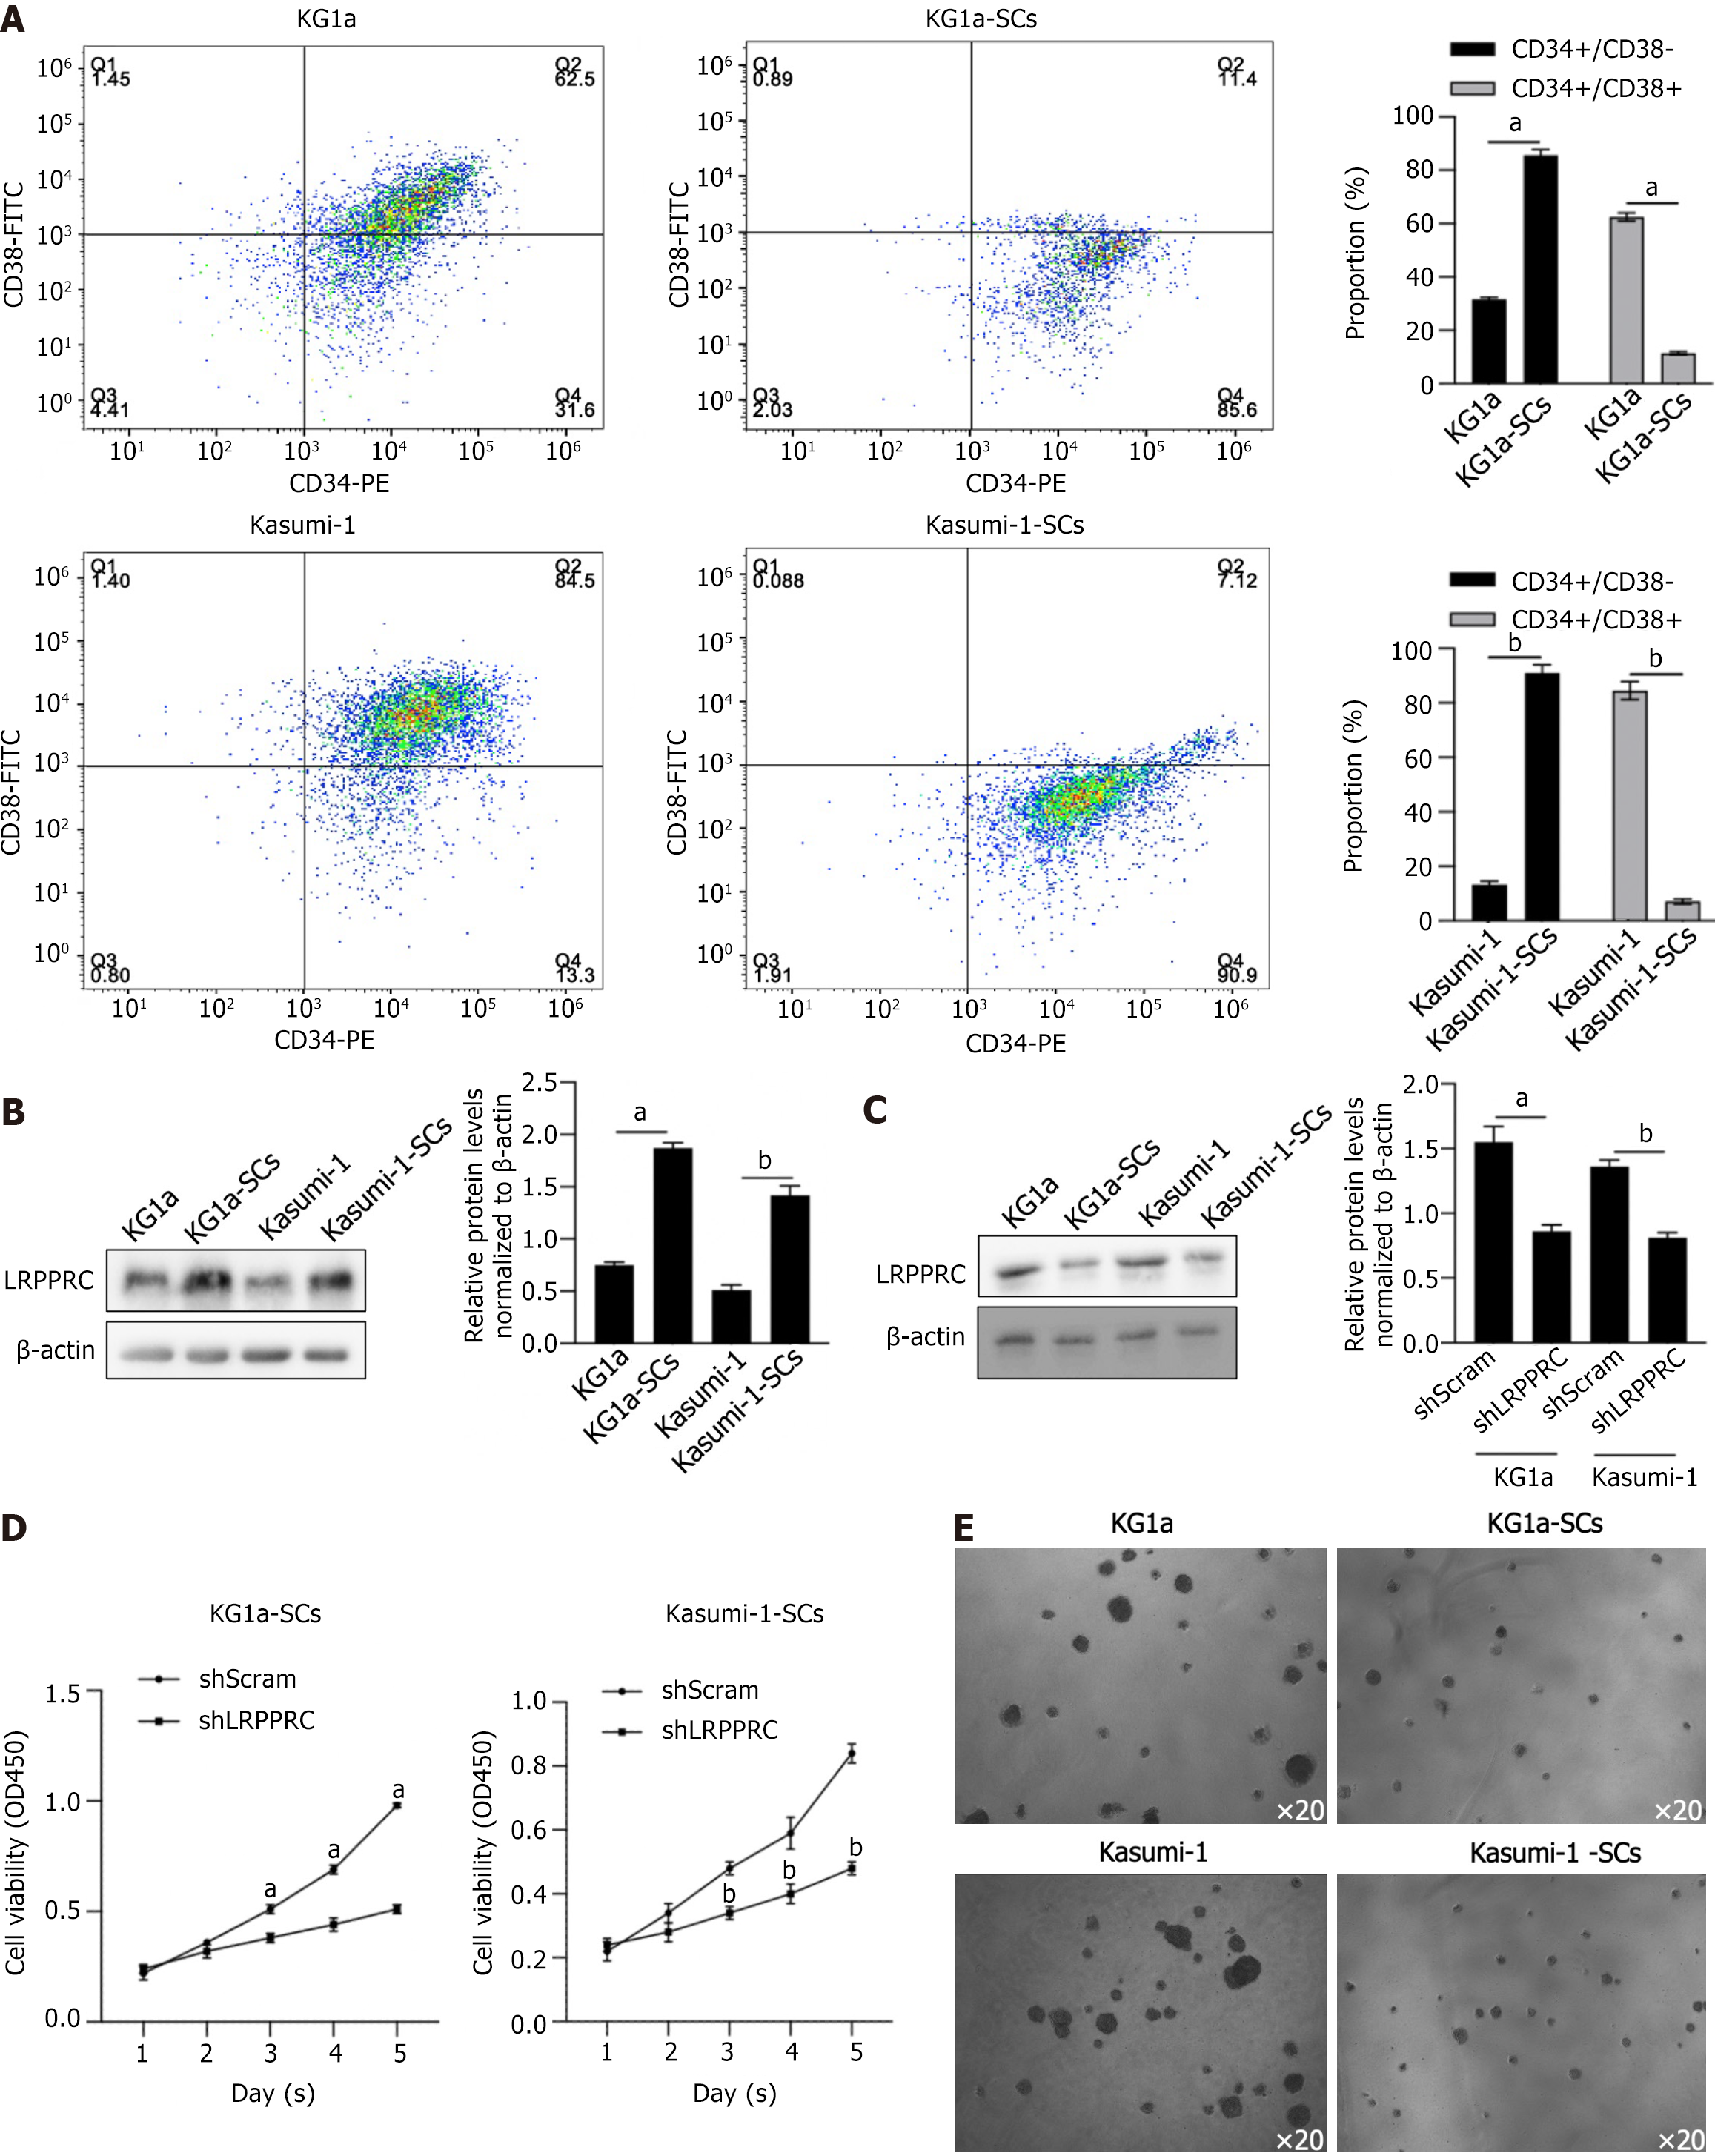
Figure 2 Leucine-rich pentatricopeptide repeat-containing protein knockdown decreased cell viability and colony formation in KG1a-SCs and Kasumi-1-SCs.
A: After magnetic sorting, sorted or original cells were analyzed by flow cytometry after double staining using CD34-PE/CD38-FITC. CD34+/CD38- proportion was considered as leukemia stem cell subpopulation. aP < 0.05, vs KG1a group; bP < 0.05, vs Kasumi-1 group; B: Leucine-rich pentatricopeptide repeat-containing protein (LRPPRC) expression was measured by performing western blot. aP < 0.05, vs KG1a group; bP < 0.05, vs Kasumi-1 group; C: After short hairpin RNA (shRNA) transfection targeting to LRPPRC mRNA for 48 h, LRPPRC protein level was measured. aP < 0.05, vs KG1a group or Kasumi-1 group; bP < 0.05, vs Kasumi-1 group; D: Cell viability was measured from day 1 to 5 after LRPPRC knockdown (shLRPPRC group). aP < 0.05, vs KG1a-SCs shScram group; bP < 0.05, vs Kasumi-1-SCs shScram group; E: Colony formation assay was performed to evaluate the effect of LRPPRC knockdown. LRPPRC: Leucine-rich pentatricopeptide repeat-containing protein.
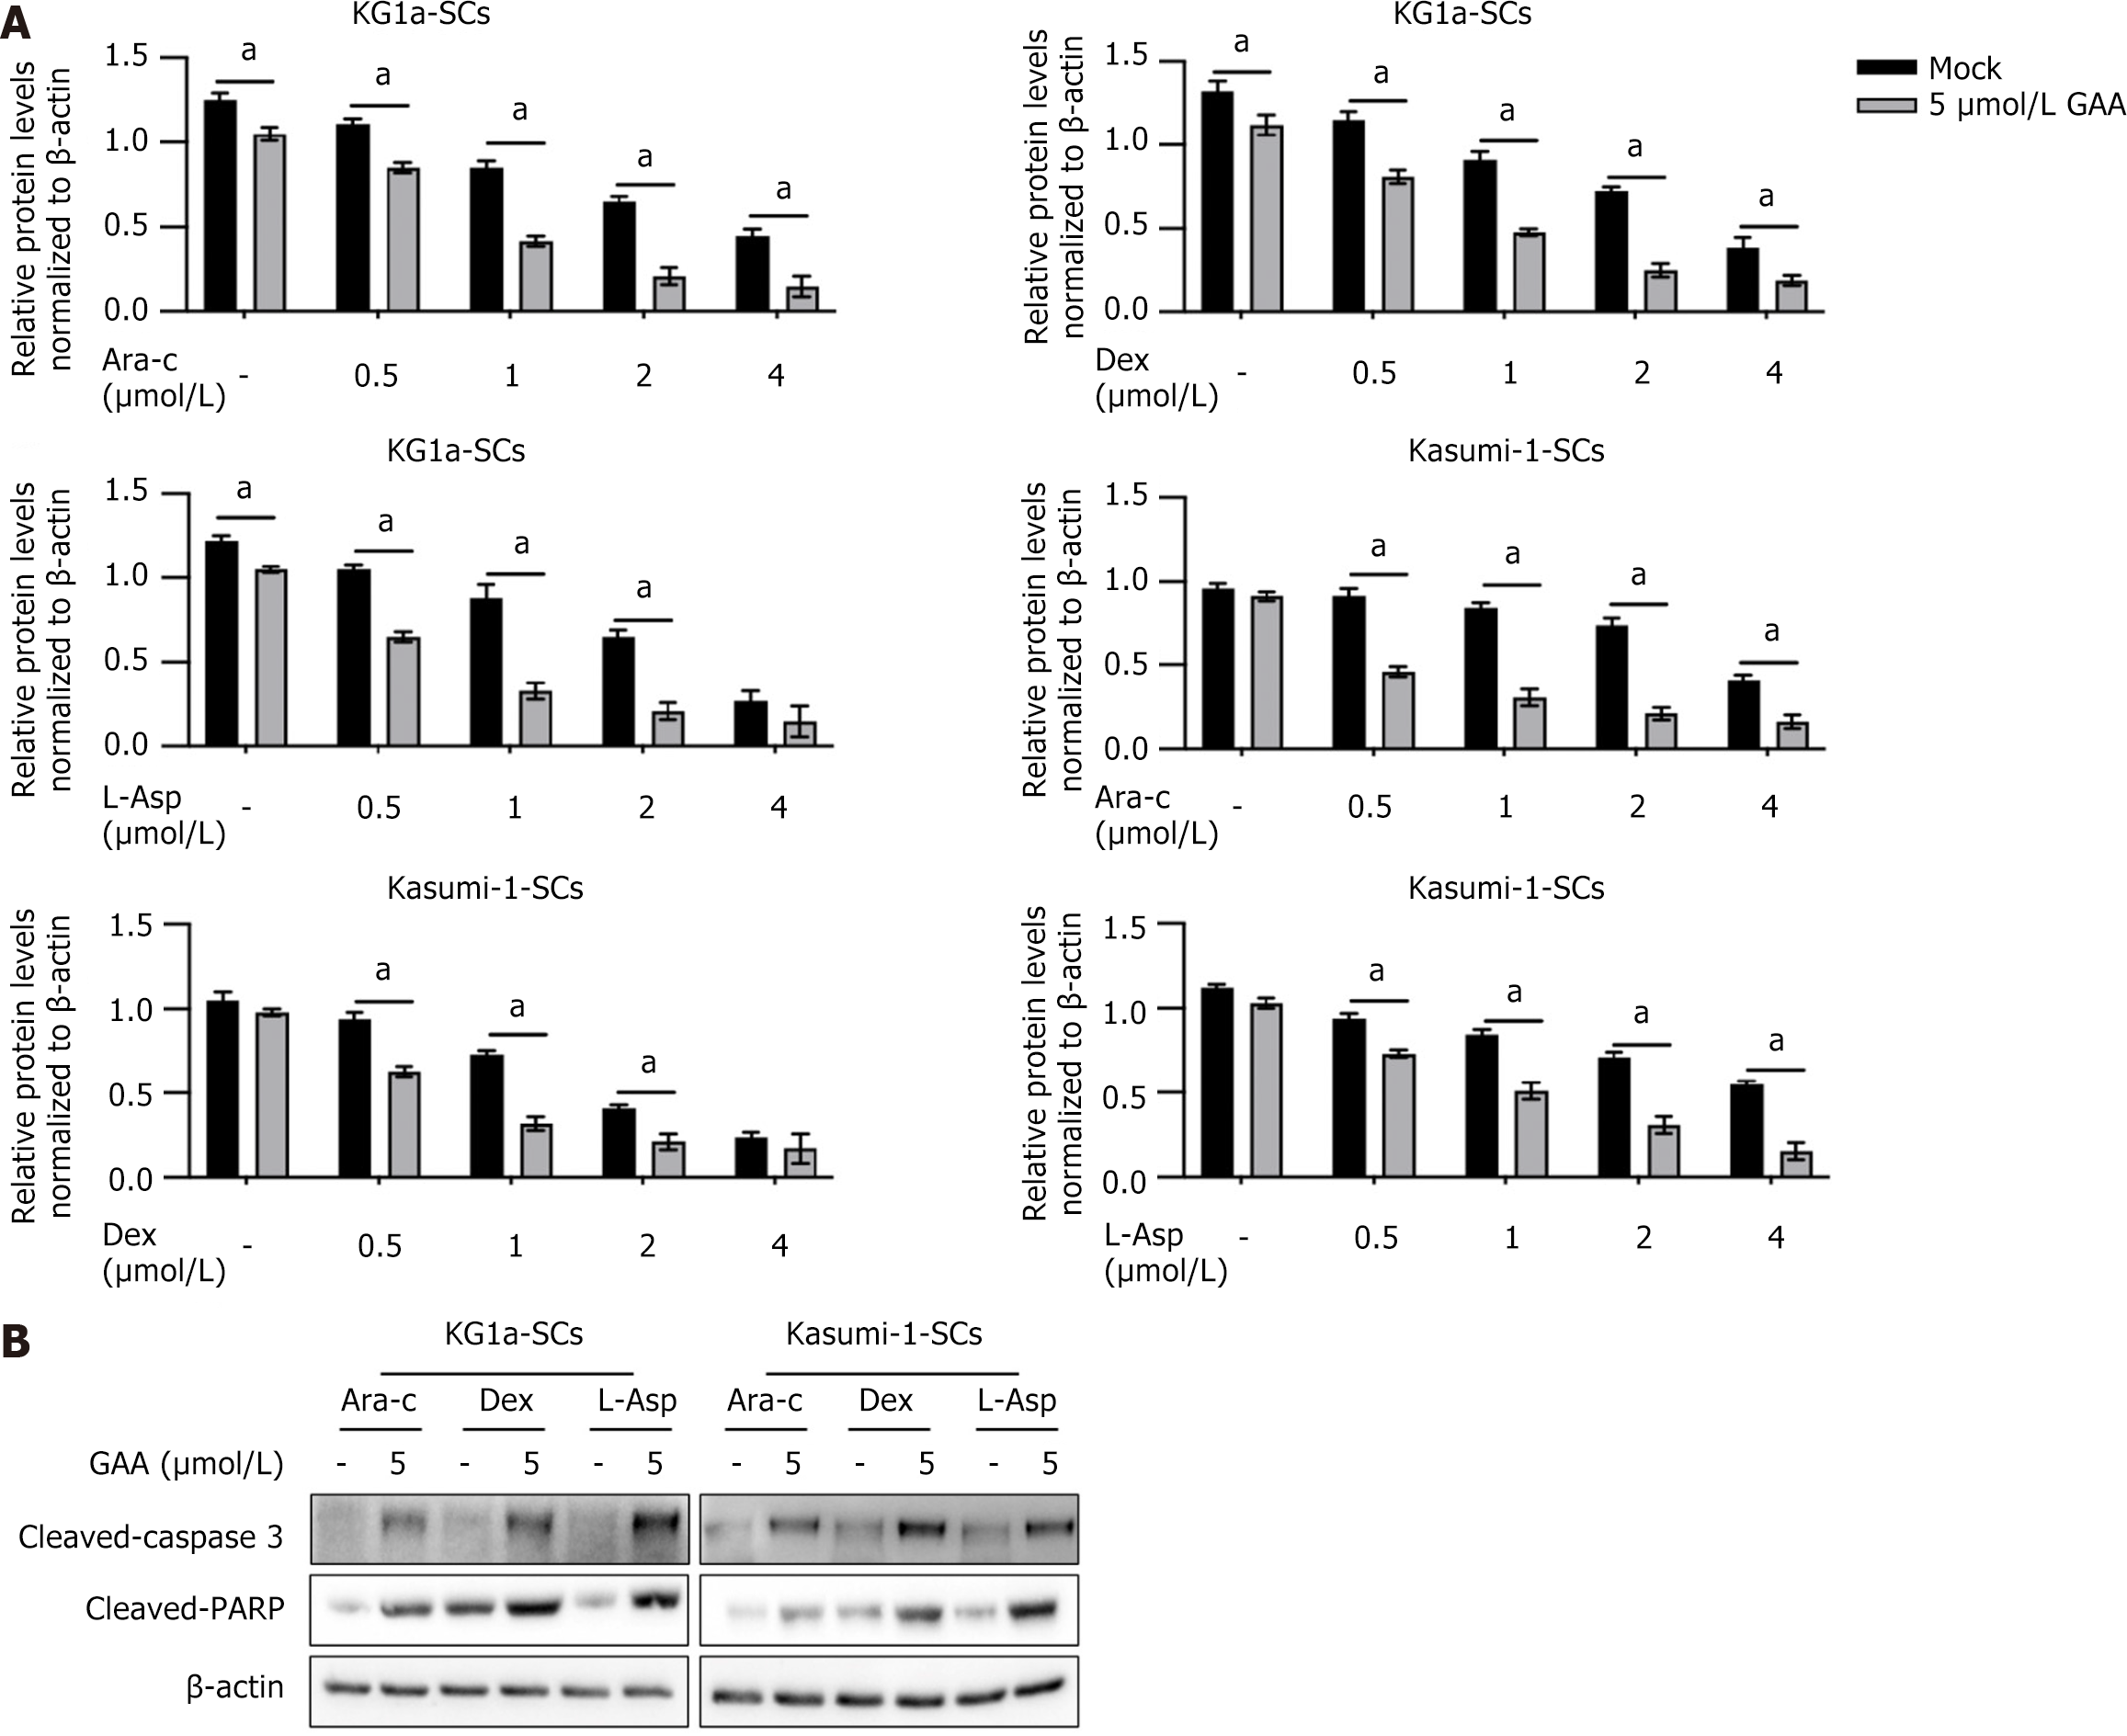
Figure 3 Gossypol acetic acid treatment enhanced chemosensitivity and apoptosis after chemotreatment.
A: 0.5, 1, 2 or 4 μmol/L of cytarabine (Ara-C), Dexamethasone (Dex) or L-Asparaginase (L-Asp) was used for chemotreatment with or without presence of 5 μmol/L of gossypol acetic acid (GAA), 24-h later, cell viability was measured by performing CCK-8 assay. aP < 0.05, vs mock group; B: KG1a-SCs or Kasumi-1-SCs was co-cultured with 1 μmol/L of Ara-c, Dex or L-Asp with or without 5 μmol/L of GAA for 24 h, and cleaved-caspase 3 and cleaved-PARP were measured by performing western blot. LRPPRC: Leucine-rich pentatricopeptide repeat-containing protein; GAA: Gossypol acetic acid; Ara-C: Cytarabine; Dex: Dexamethasone; L-Asp: L-Asparaginase.
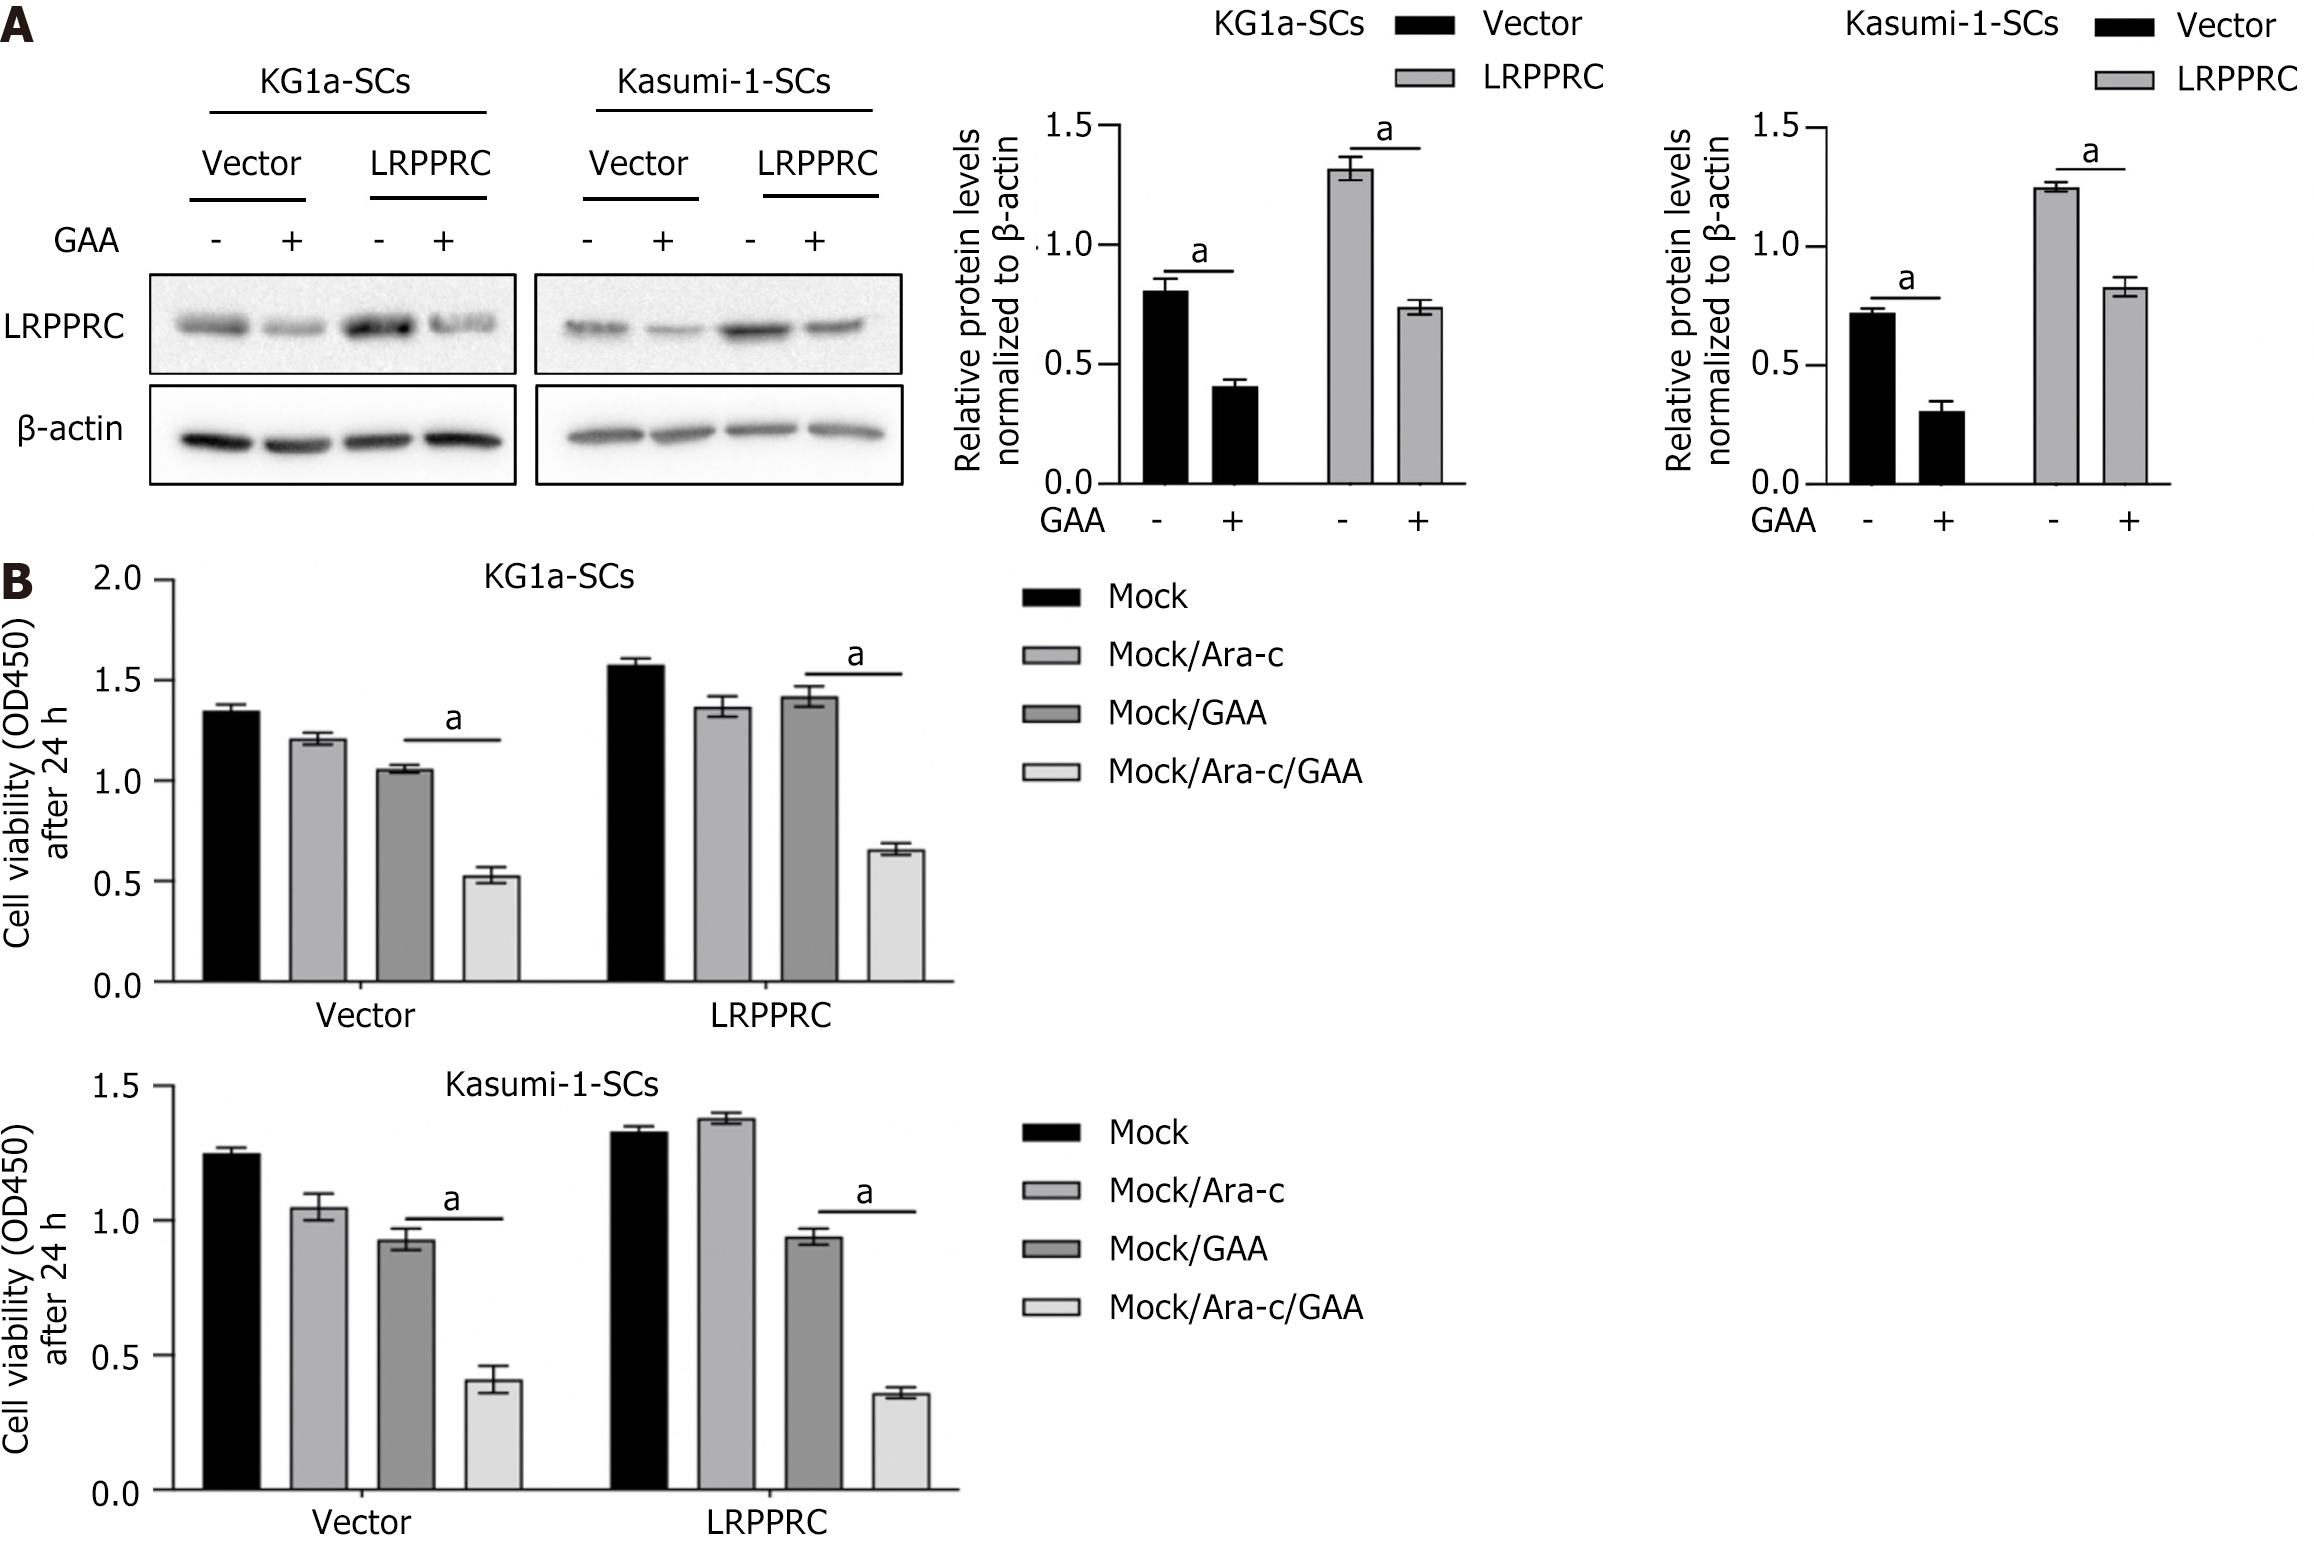
Figure 4 Gossypol acetic acid induced chemosensitivity via degrading leucine-rich pentatricopeptide repeat-containing protein.
A: After being transfected with leucine-rich pentatricopeptide repeat-containing protein-coding plasmid, overexpression efficiency was measured by performing western blot. aP < 0.05, vs vector group; B: After being pre-treated with gossypol acetic acid (GAA), KG1a-SCs or Kasumi-1-SCs were treated with cytarabine for extra 24 h and cell viability was measured. aP < 0.05, mock/GAA group. LRPPRC: Leucine-rich pentatricopeptide repeat-containing protein; GAA: Gossypol acetic acid.
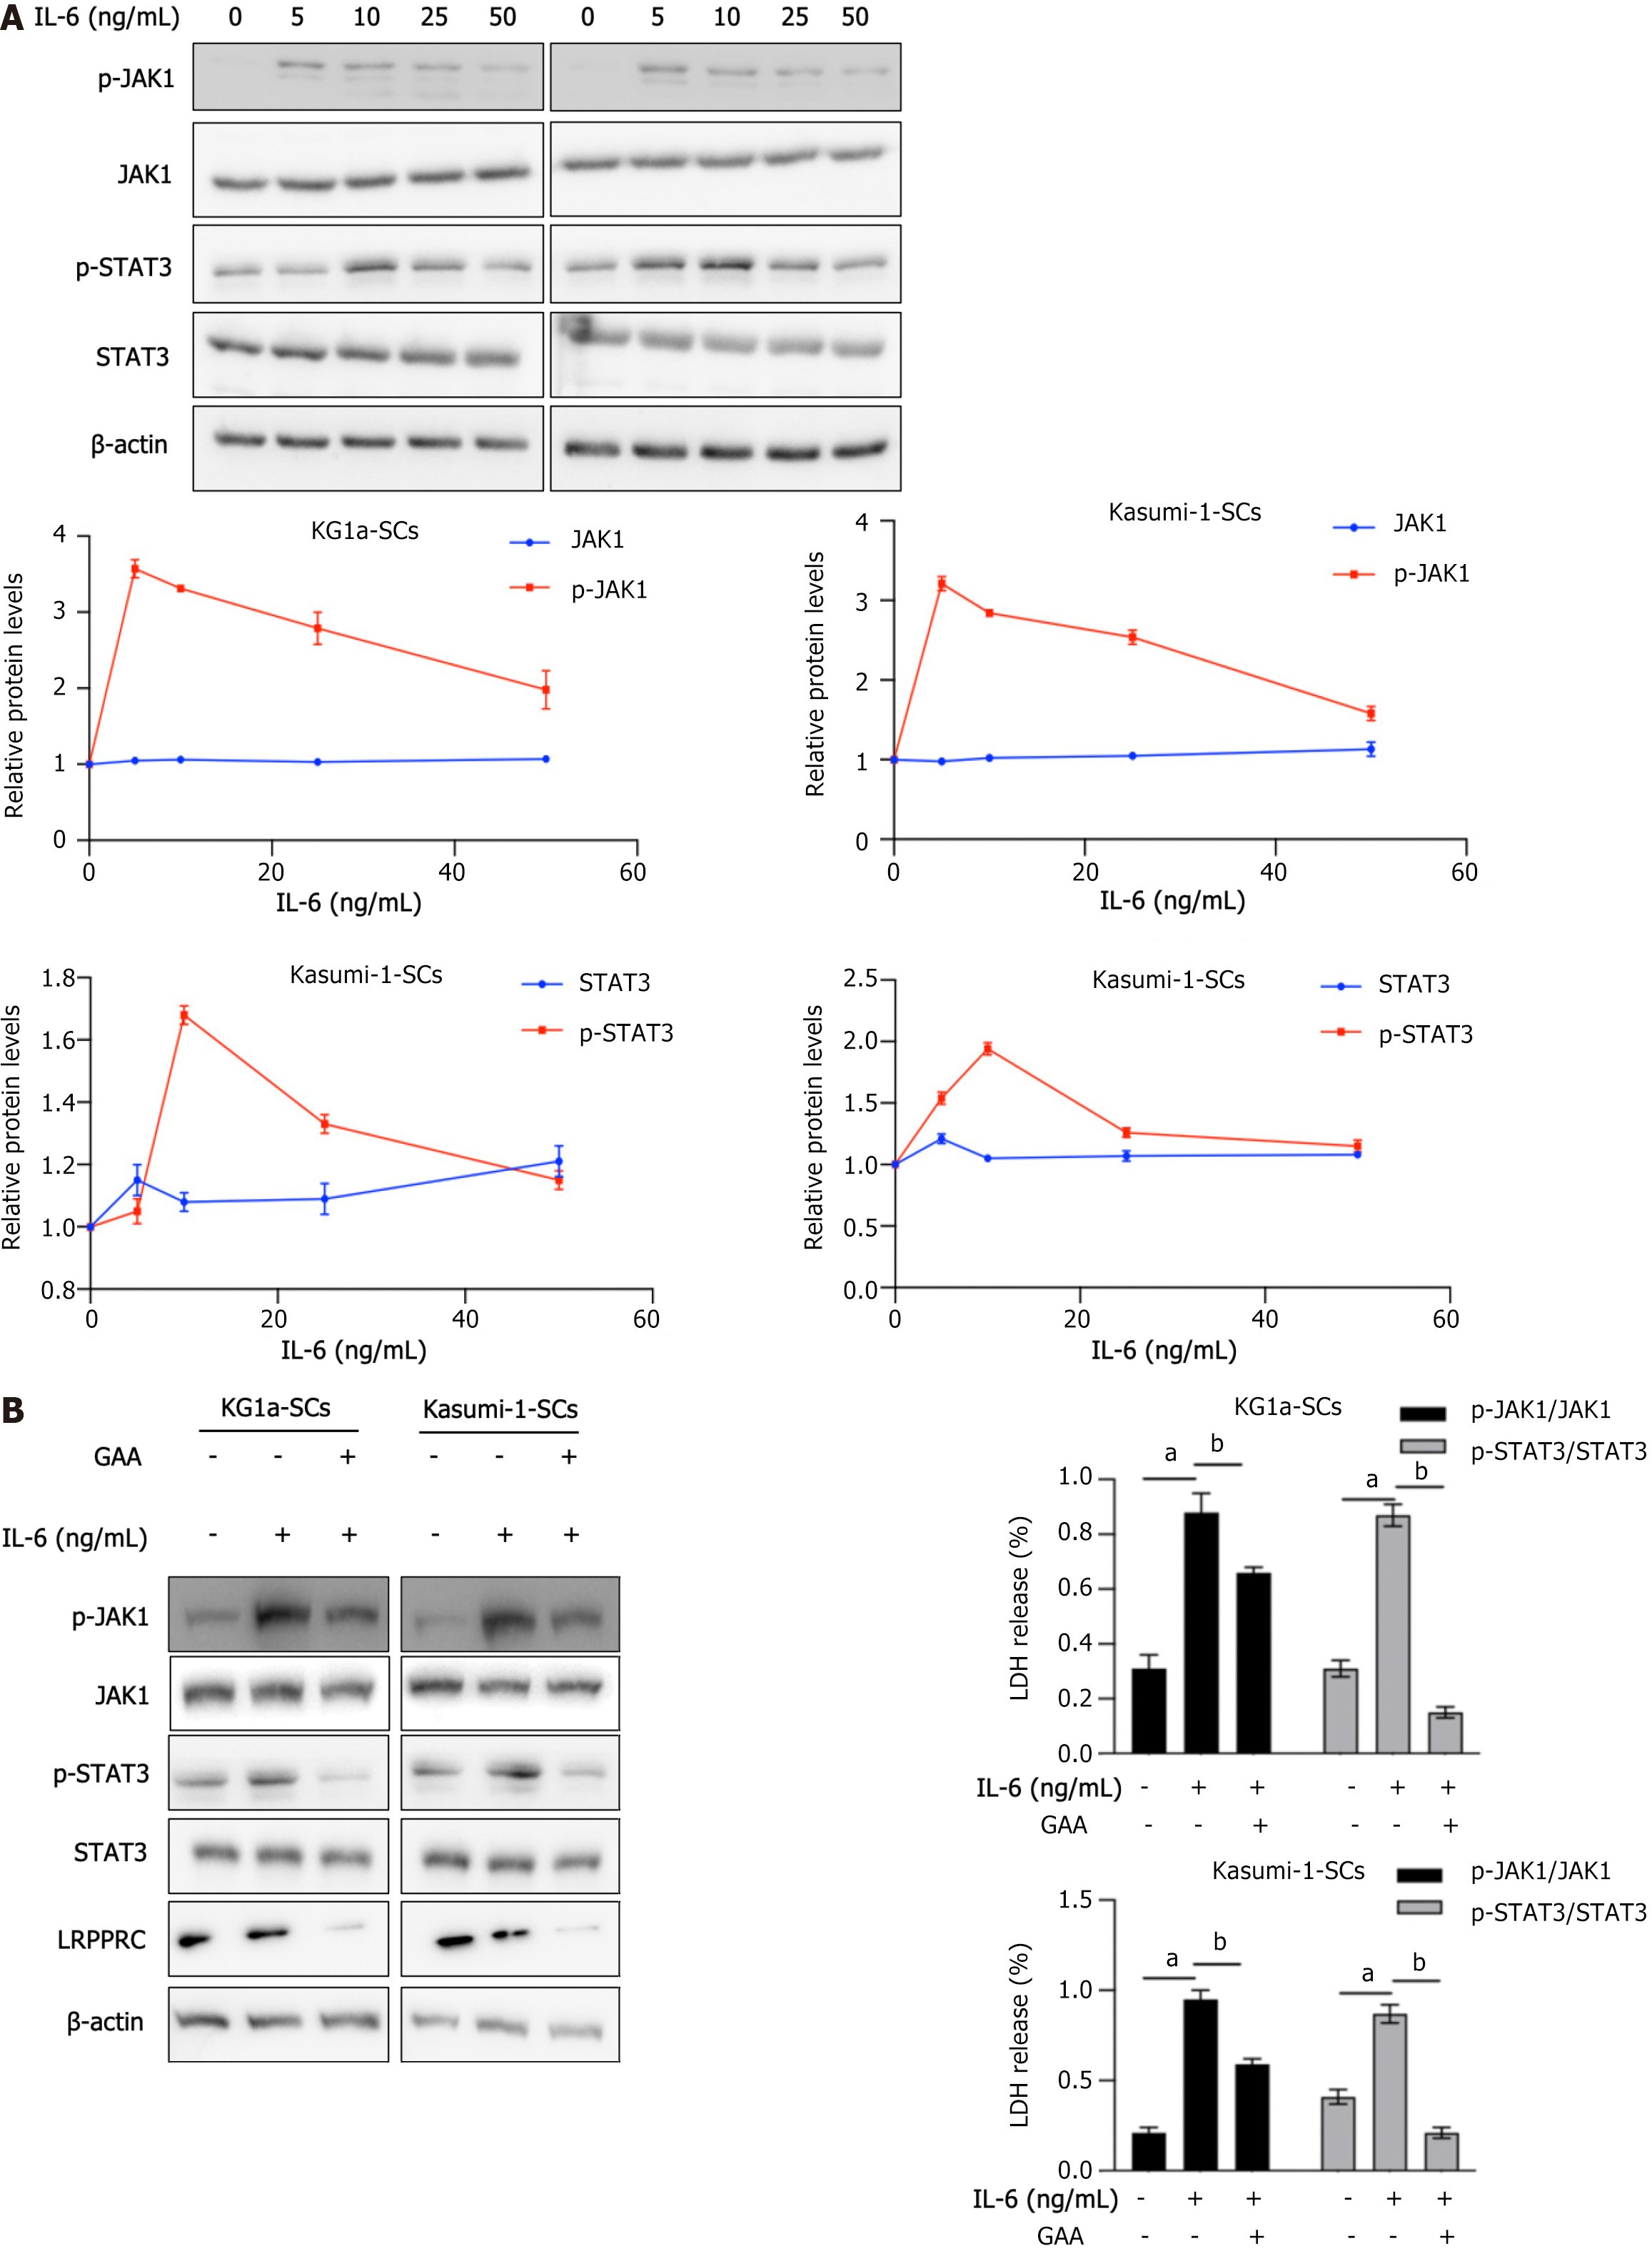
Figure 5 Gossypol acetic acid treatment inhibited interleukin 6/janus kinase 1/signal transducer and activator of transcription 3 signaling.
A: After being treated with 5-50 ng/mL interleukin 6 (IL-6) for 6 h, western blot was performed to detect IL-6/janus kinase 1/signal transducer and activator of transcription 3 (IL-6/JAK1/STAT3) signaling including STAT3, p-STAT3, JAK1, p-JAK1; B: After being pre-treated with gossypol acetic acid for 24 h, 10 ng/mL IL-6 was added for 6-hour extra incubation and IL-6/JAK1/STAT3 signaling including STAT3, p-STAT3, JAK1, p-JAK1 was detected. aP < 0.05, vs IL-6 (-) group; bP < 0.05, vs IL-6 (+) group. LRPPRC: Leucine-rich pentatricopeptide repeat-containing protein; GAA: Gossypol acetic acid; IL-6: Interleukin 6; JAK1: Janus kinase 1; STAT3: Signal transducer and activator of transcription 3.
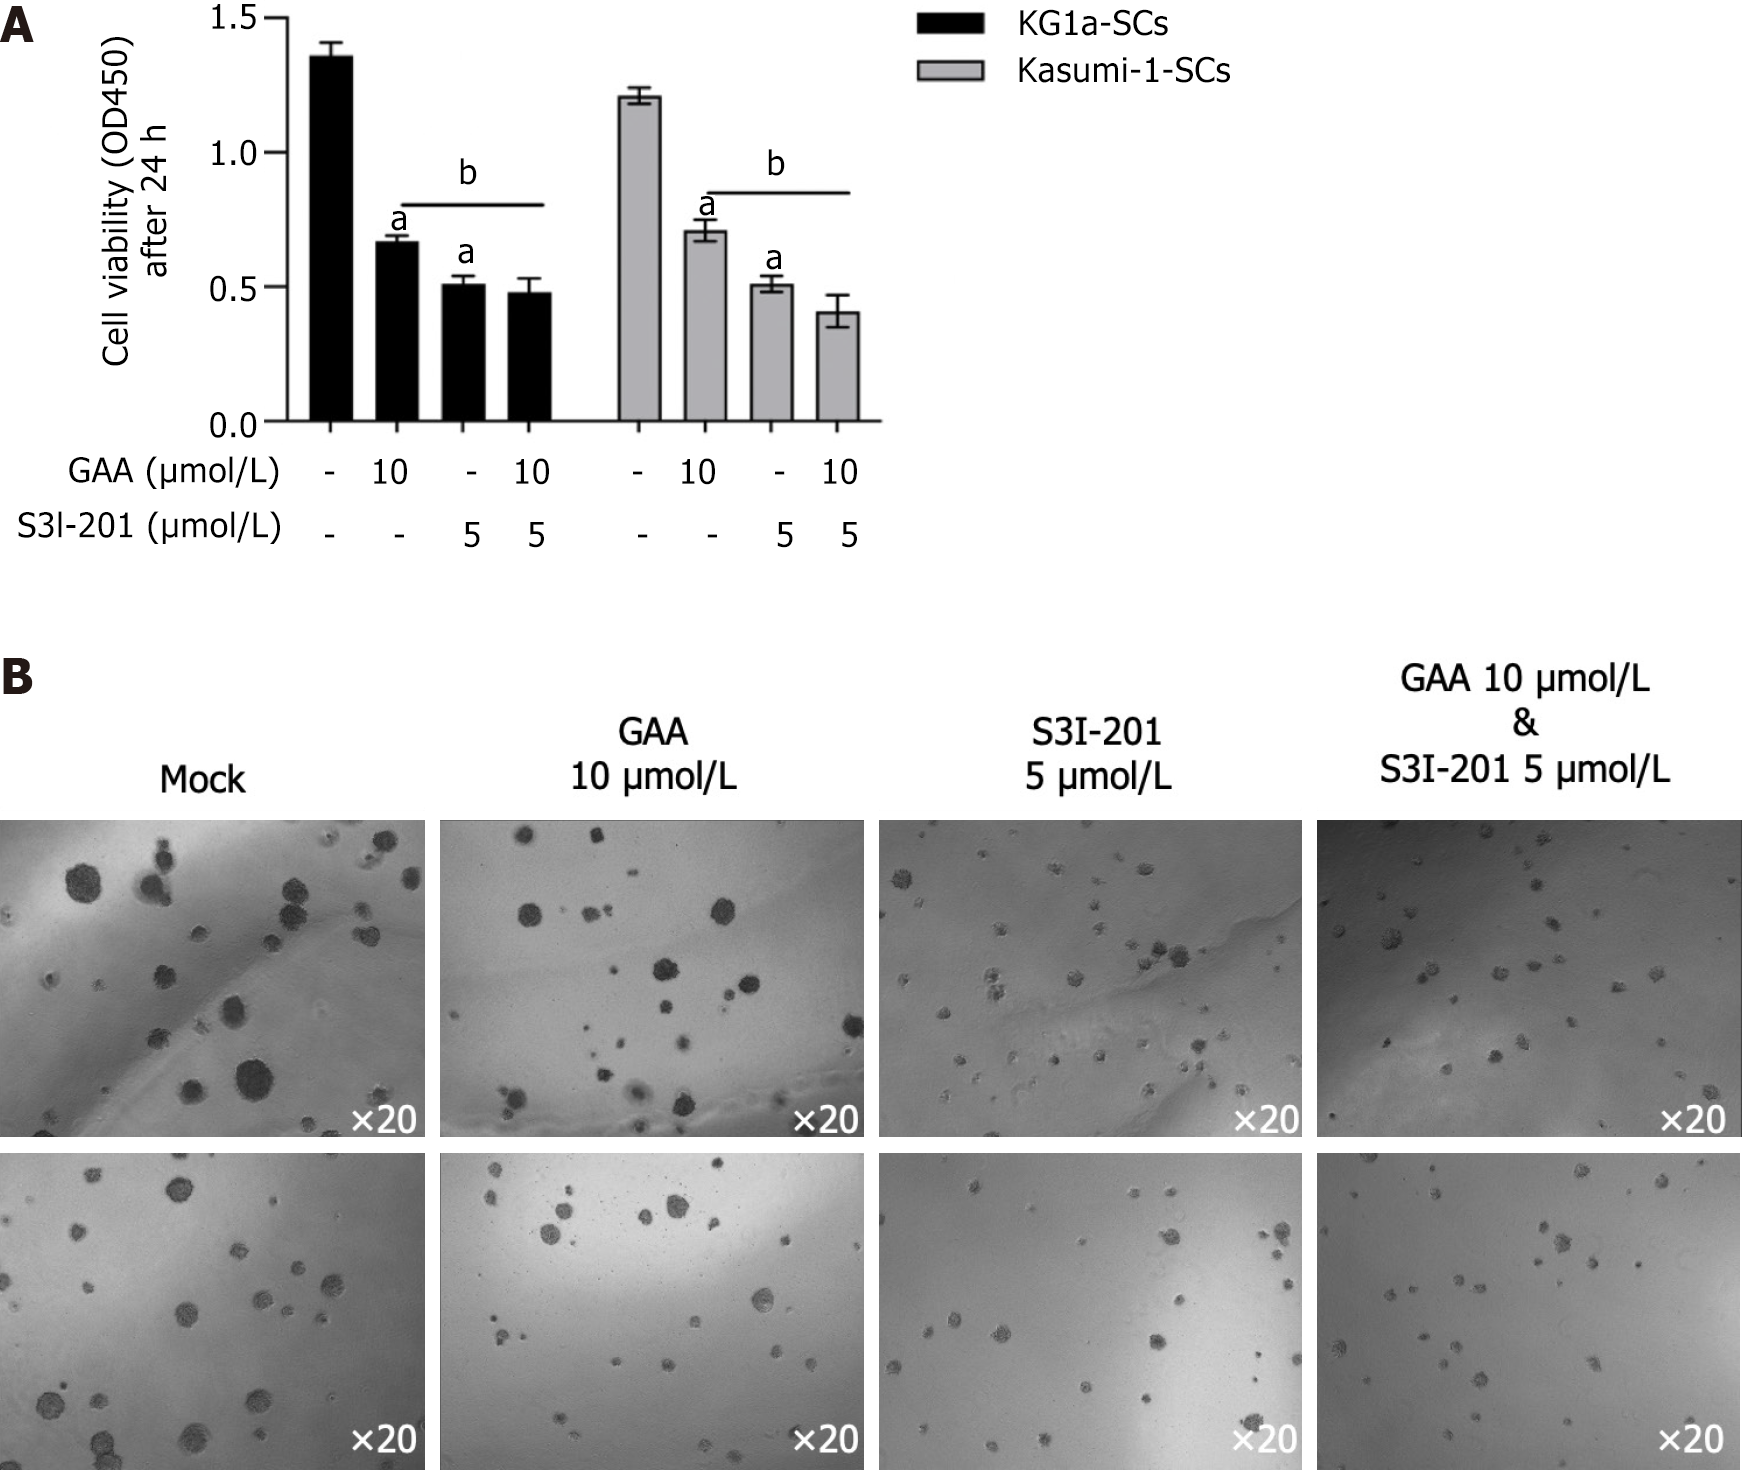
Figure 6 Gossypol acetic acid inhibits leukemia stem cells partially via inhibiting interleukin 6/janus kinase 1/signal transducer and activator of transcription 3 signaling.
A and B: After being treated with gossypol acetic acid (GAA) or treated with S3I-210 for 24 h, cell viability was performing by employing CCK-8 assay (A), and colony formation ability was measured (B). aP < 0.05, vs GAA/S3I-201(-) group; bP < 0.05, vs GAA (+) group. GAA: Gossypol acetic acid.
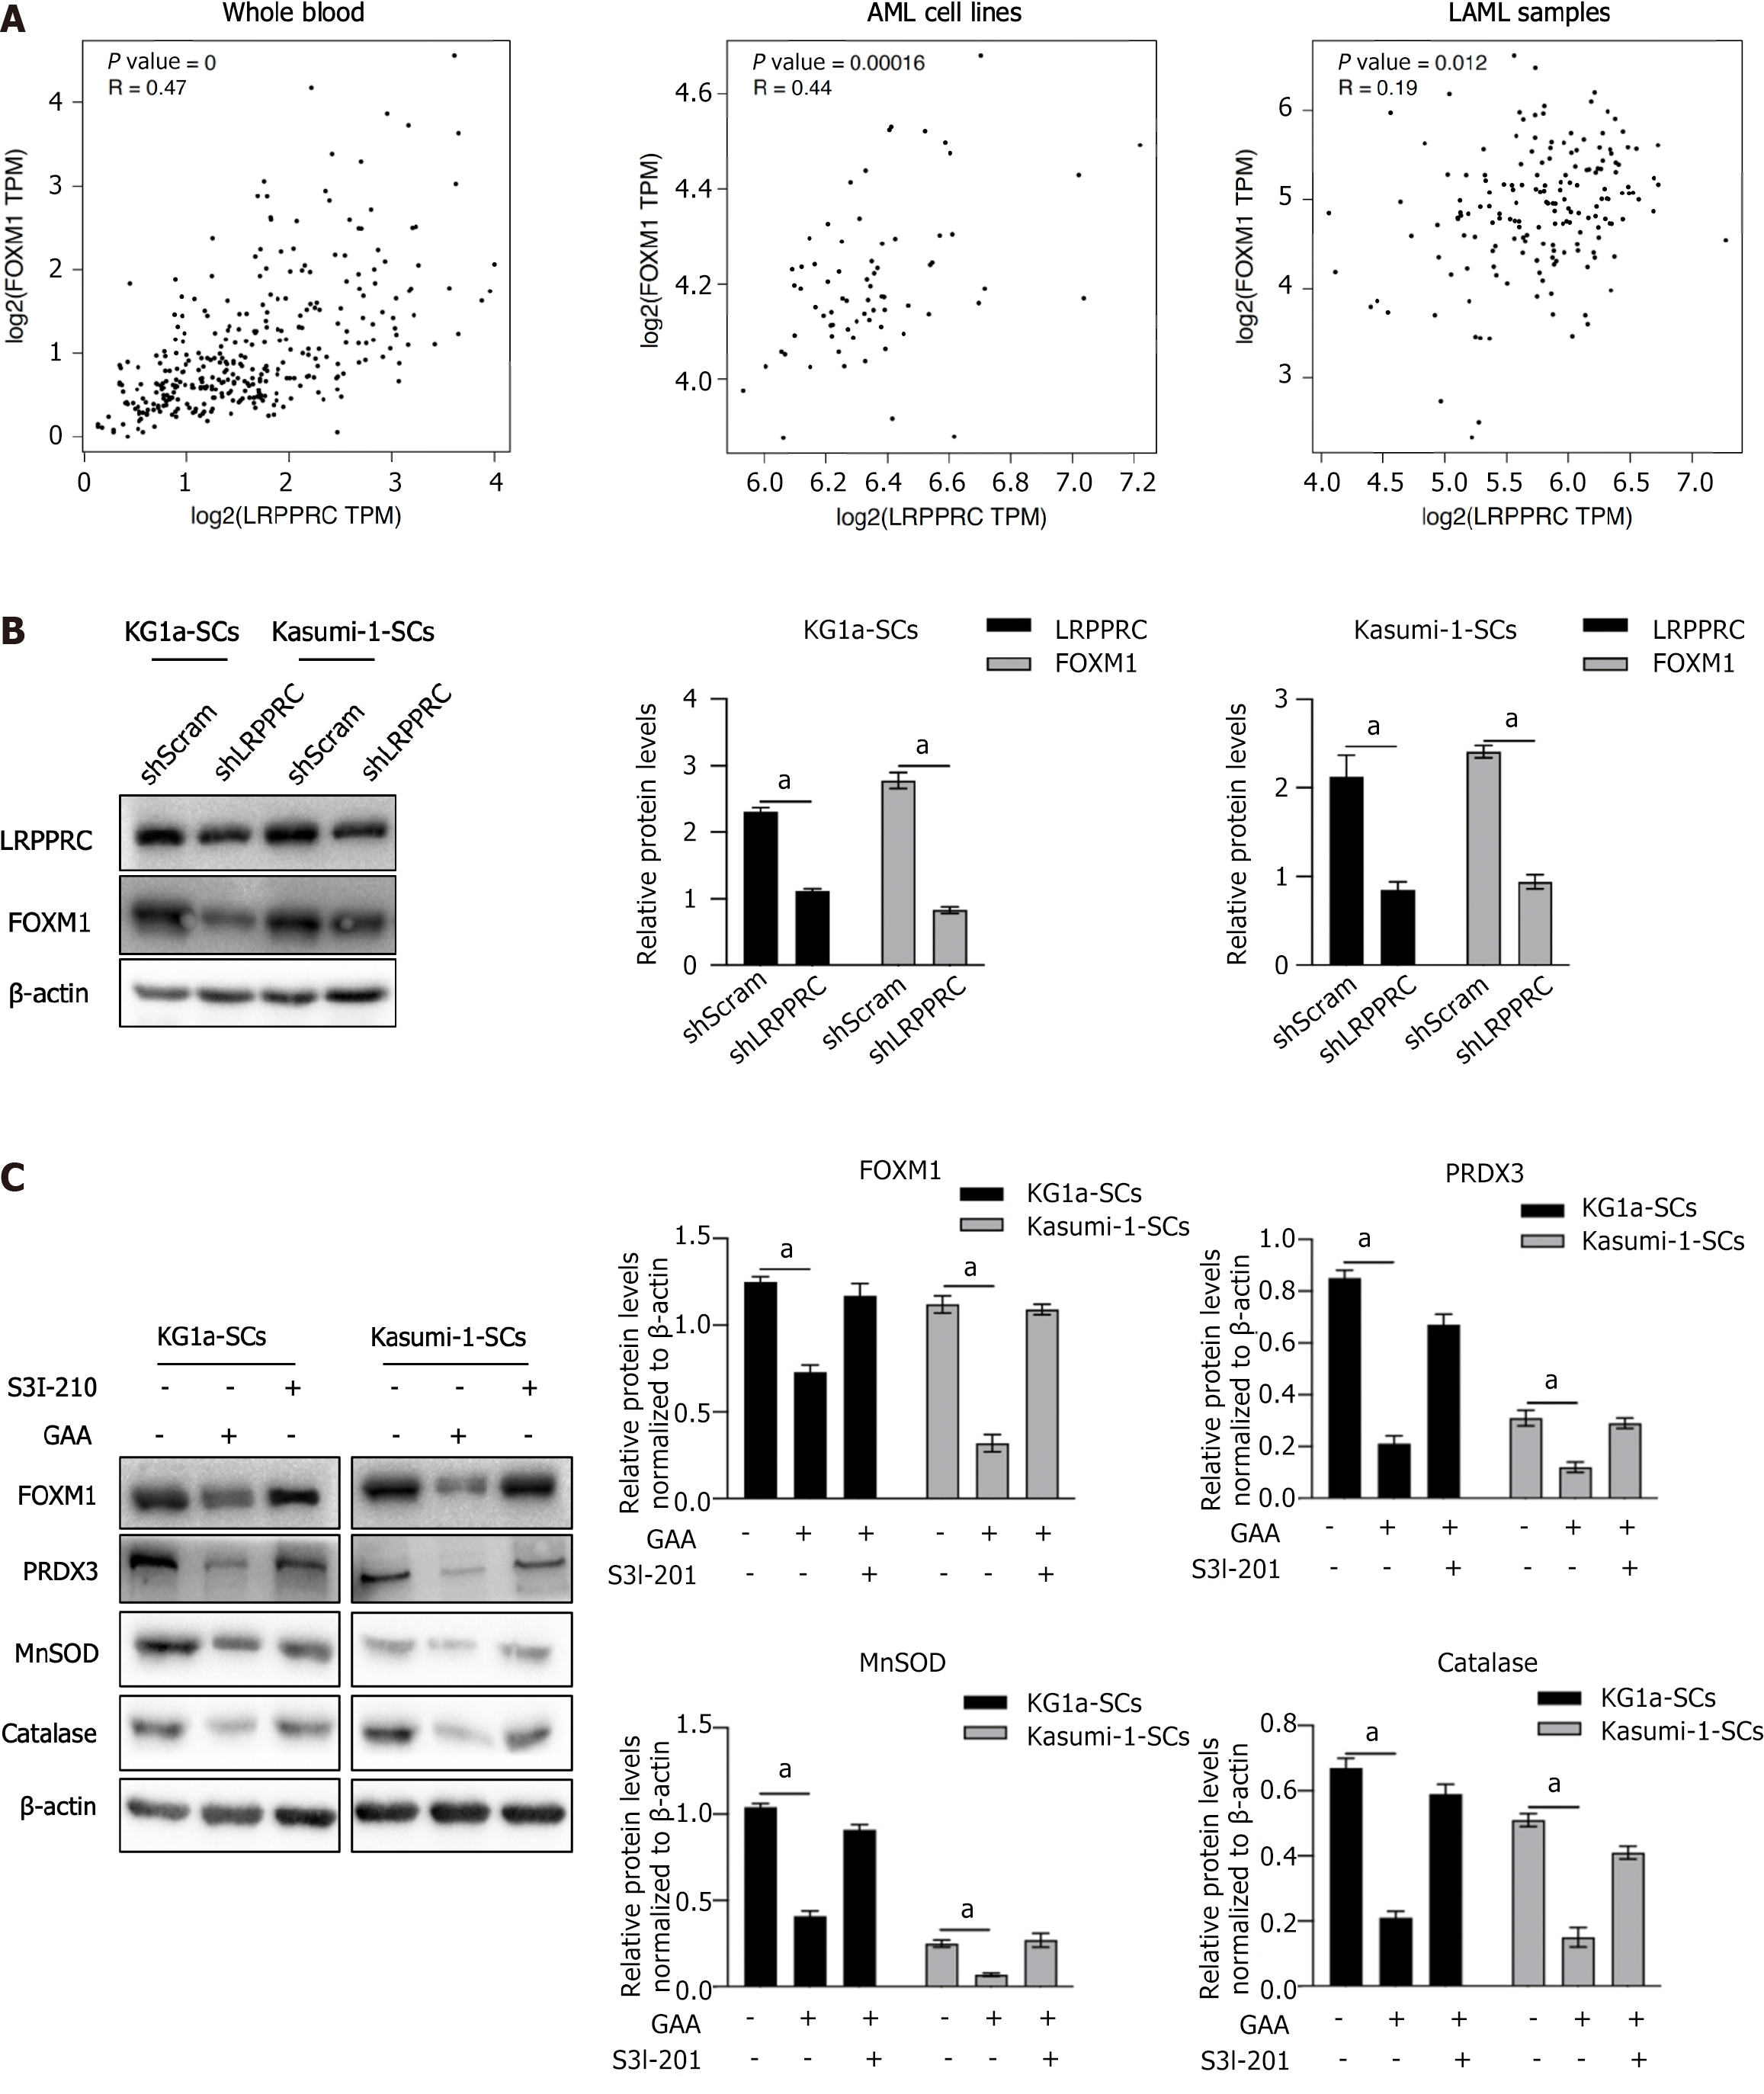
Figure 7 Gossypol acetic acid positively regulates forkhead box M1 in and interleukin 6/janus kinase 1/signal transducer and activator of transcription 3 signaling independent manner.
A: By employing GEPIA online tool, the correlation between leucine-rich pentatricopeptide repeat-containing protein (LRPPRC) and forkhead box M1 (FOXM1) in whole blood, acute myeloid leukemia cell lines and LAML samples were analyzed; B: After efficiently knockdown LRPPRC in KG1a-SCs and Kasumi-1-SCs, LRPPRC and FOXM1 protein levels were measured by performing western blot. aP < 0.05, vs shScram group; C: After being cultured with gossypol acetic acid (GAA), or pharmacology inhibitor S3I-210 for 24 h, FOXM1 and its downstream target genes, including PRDX3, MnSOD and catalase, were measured by performing western blot. aP < 0.05, vs GAA(-)/S3I-210(-) group. LRPPRC: Leucine-rich pentatricopeptide repeat-containing protein; GAA: Gossypol acetic acid; FOXM1: Forkhead box M1.
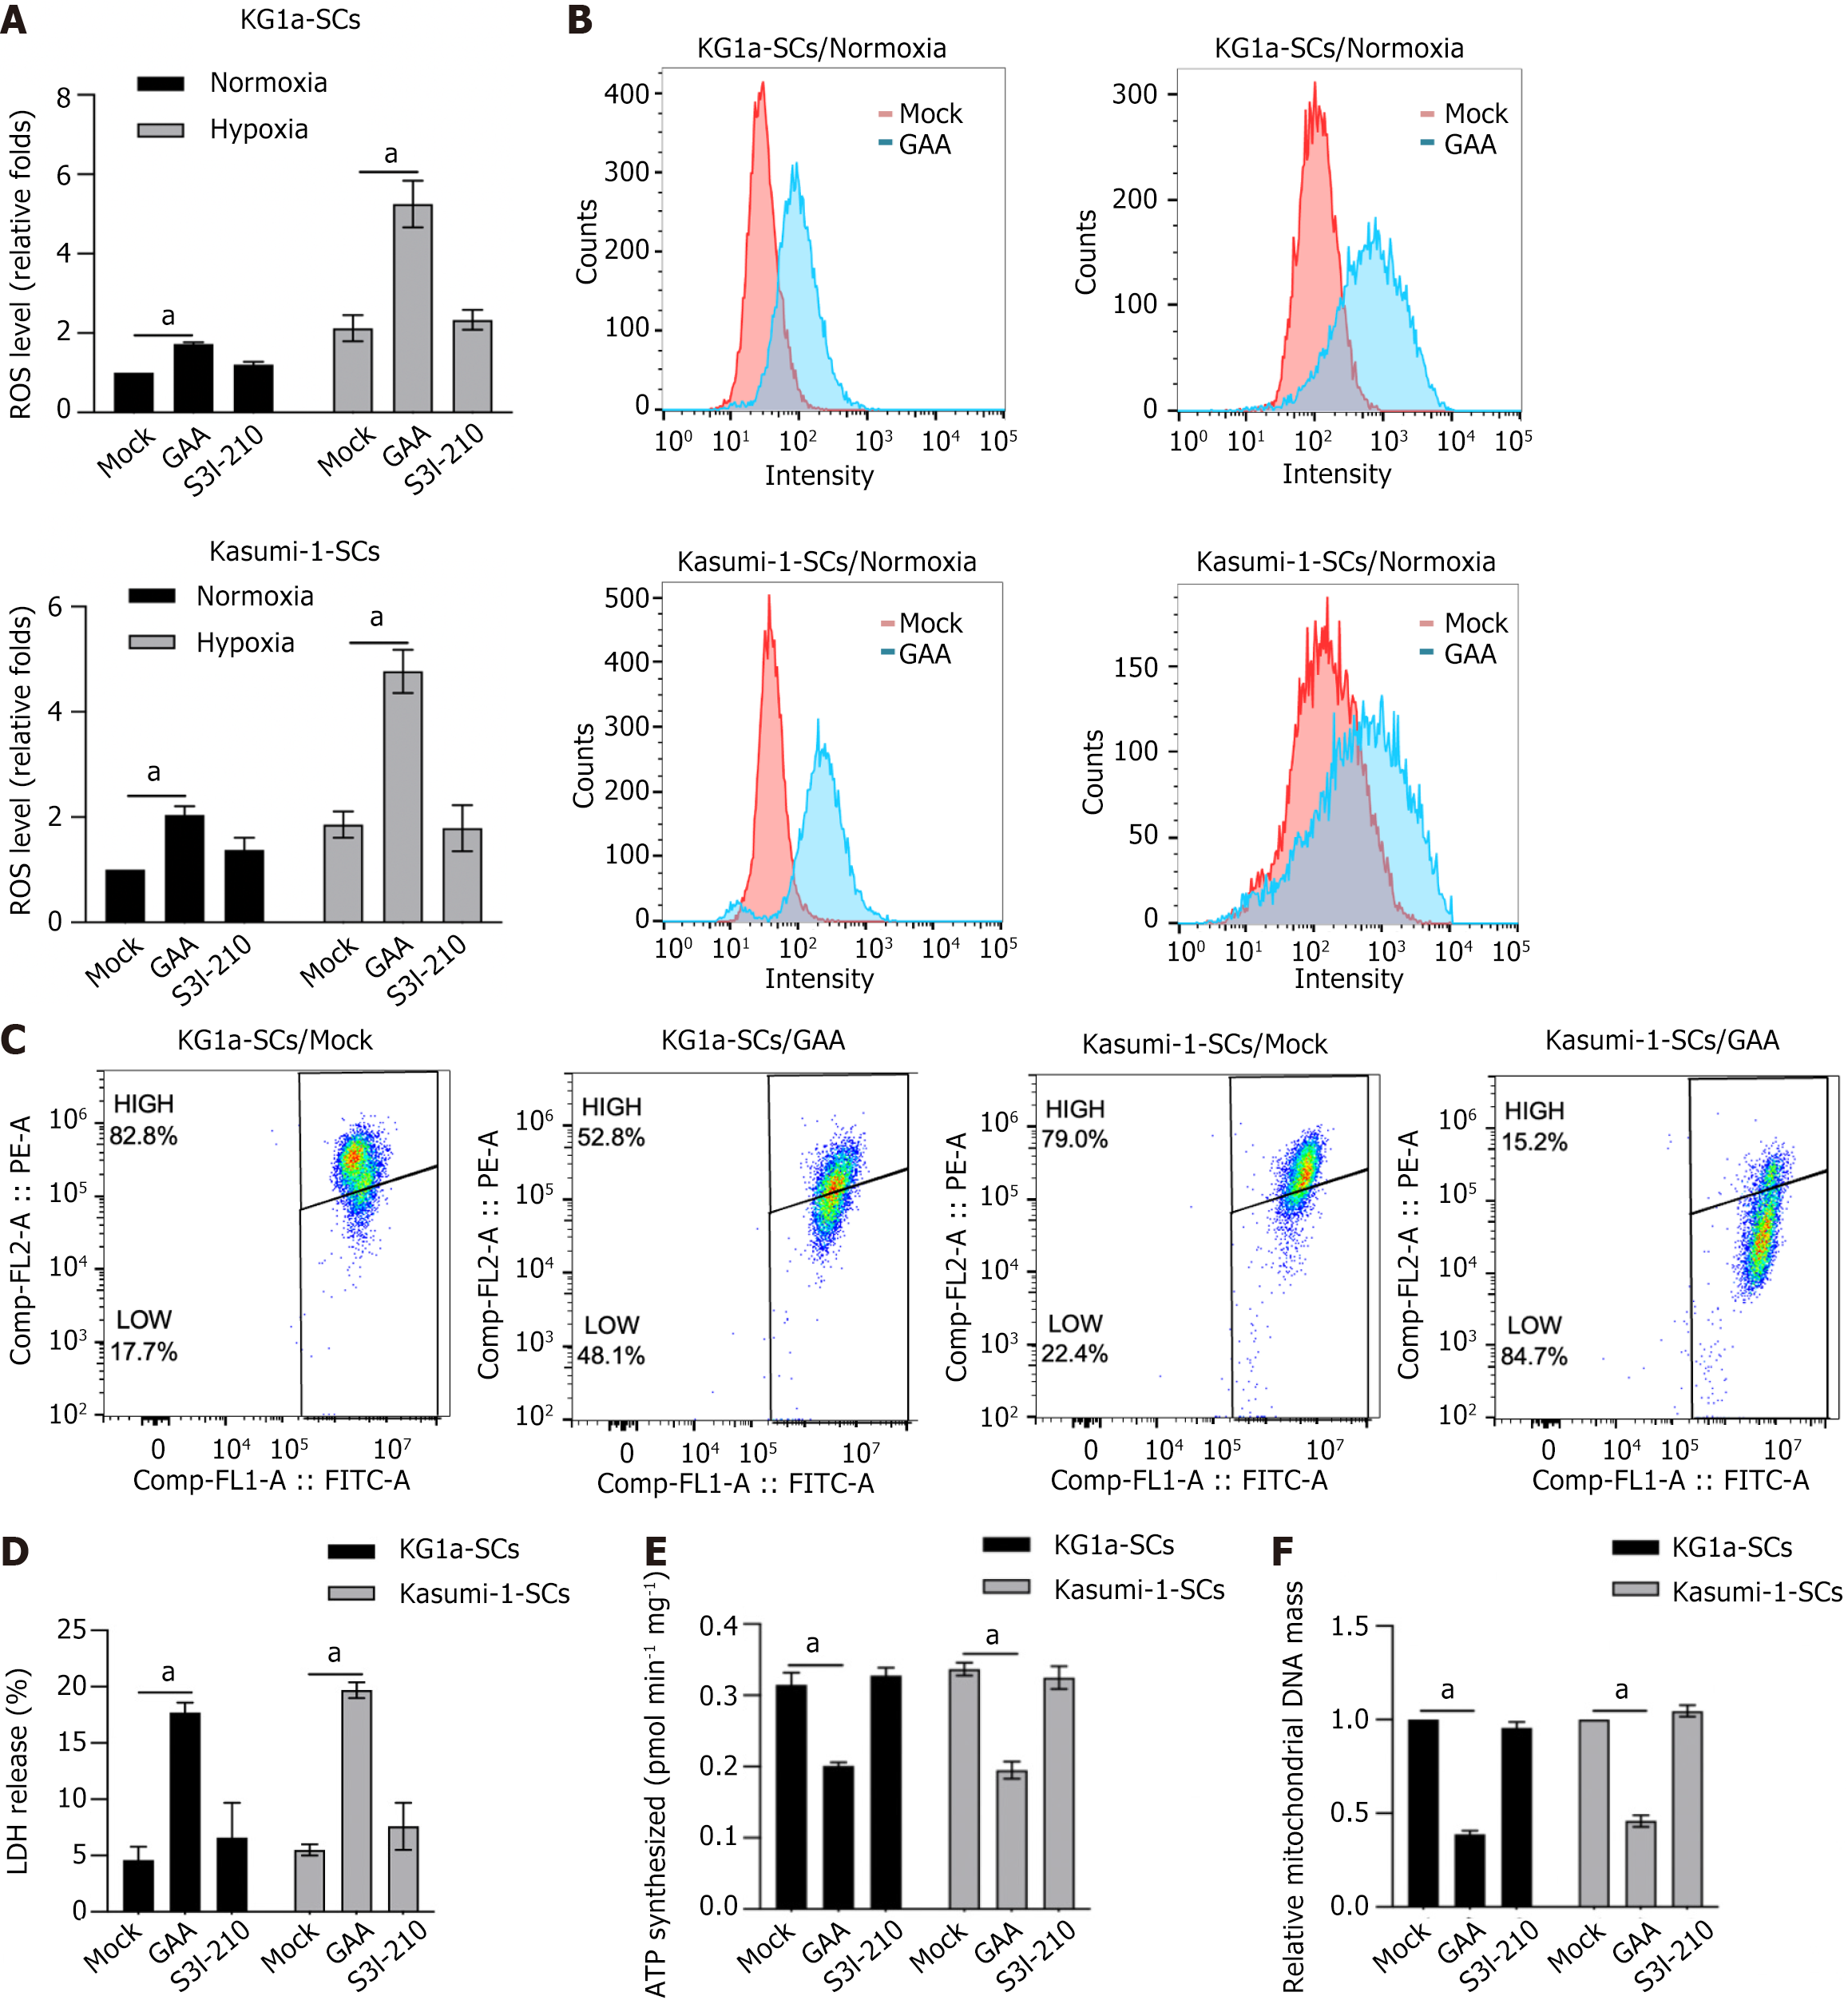
Figure 8 Gossypol acetic acid induced reactive oxygen species, disturbed mitochondrial homeostasis and resulted in mitochondrial dysfunction.
A: Under normoxia and hypoxia conditions, after being treated with gossypol acetic acid (GAA) or S3I-210 for 24 h, cell viability was measured by performing CCK-8 assay. aP < 0.05, vs mock group; B: After being treated with or without GAA, cells were stained using H2DCFDA and detected by performing flow cytometry; C: After being cultured by GAA under hypoxia condition, mitochondrial homeostasis was measured by performing JC-1 staining. JC-1 FITC proportion was considered as disturbed mitochondrial homeostasis; D-F: After being cultured by GAA or S3I-210, LDH leakage was detected to measure cellular membrane impact (D); total ATP synthesis (E) and mitochondrial DNA mass (F) were measured to confirm the effects of GAA on mitochondrial function. aP < 0.05, vs mock group.
- Citation: Ai CJ, Chen LJ, Guo LX, Wang YP, Zhao ZY. Gossypol acetic acid regulates leukemia stem cells by degrading LRPPRC via inhibiting IL-6/JAK1/STAT3 signaling or resulting mitochondrial dysfunction. World J Stem Cells 2024; 16(4): 444-458
- URL: https://www.wjgnet.com/1948-0210/full/v16/i4/444.htm
- DOI: https://dx.doi.org/10.4252/wjsc.v16.i4.444


