Copyright
©The Author(s) 2024.
World J Stem Cells. Mar 26, 2024; 16(3): 305-323
Published online Mar 26, 2024. doi: 10.4252/wjsc.v16.i3.305
Published online Mar 26, 2024. doi: 10.4252/wjsc.v16.i3.305
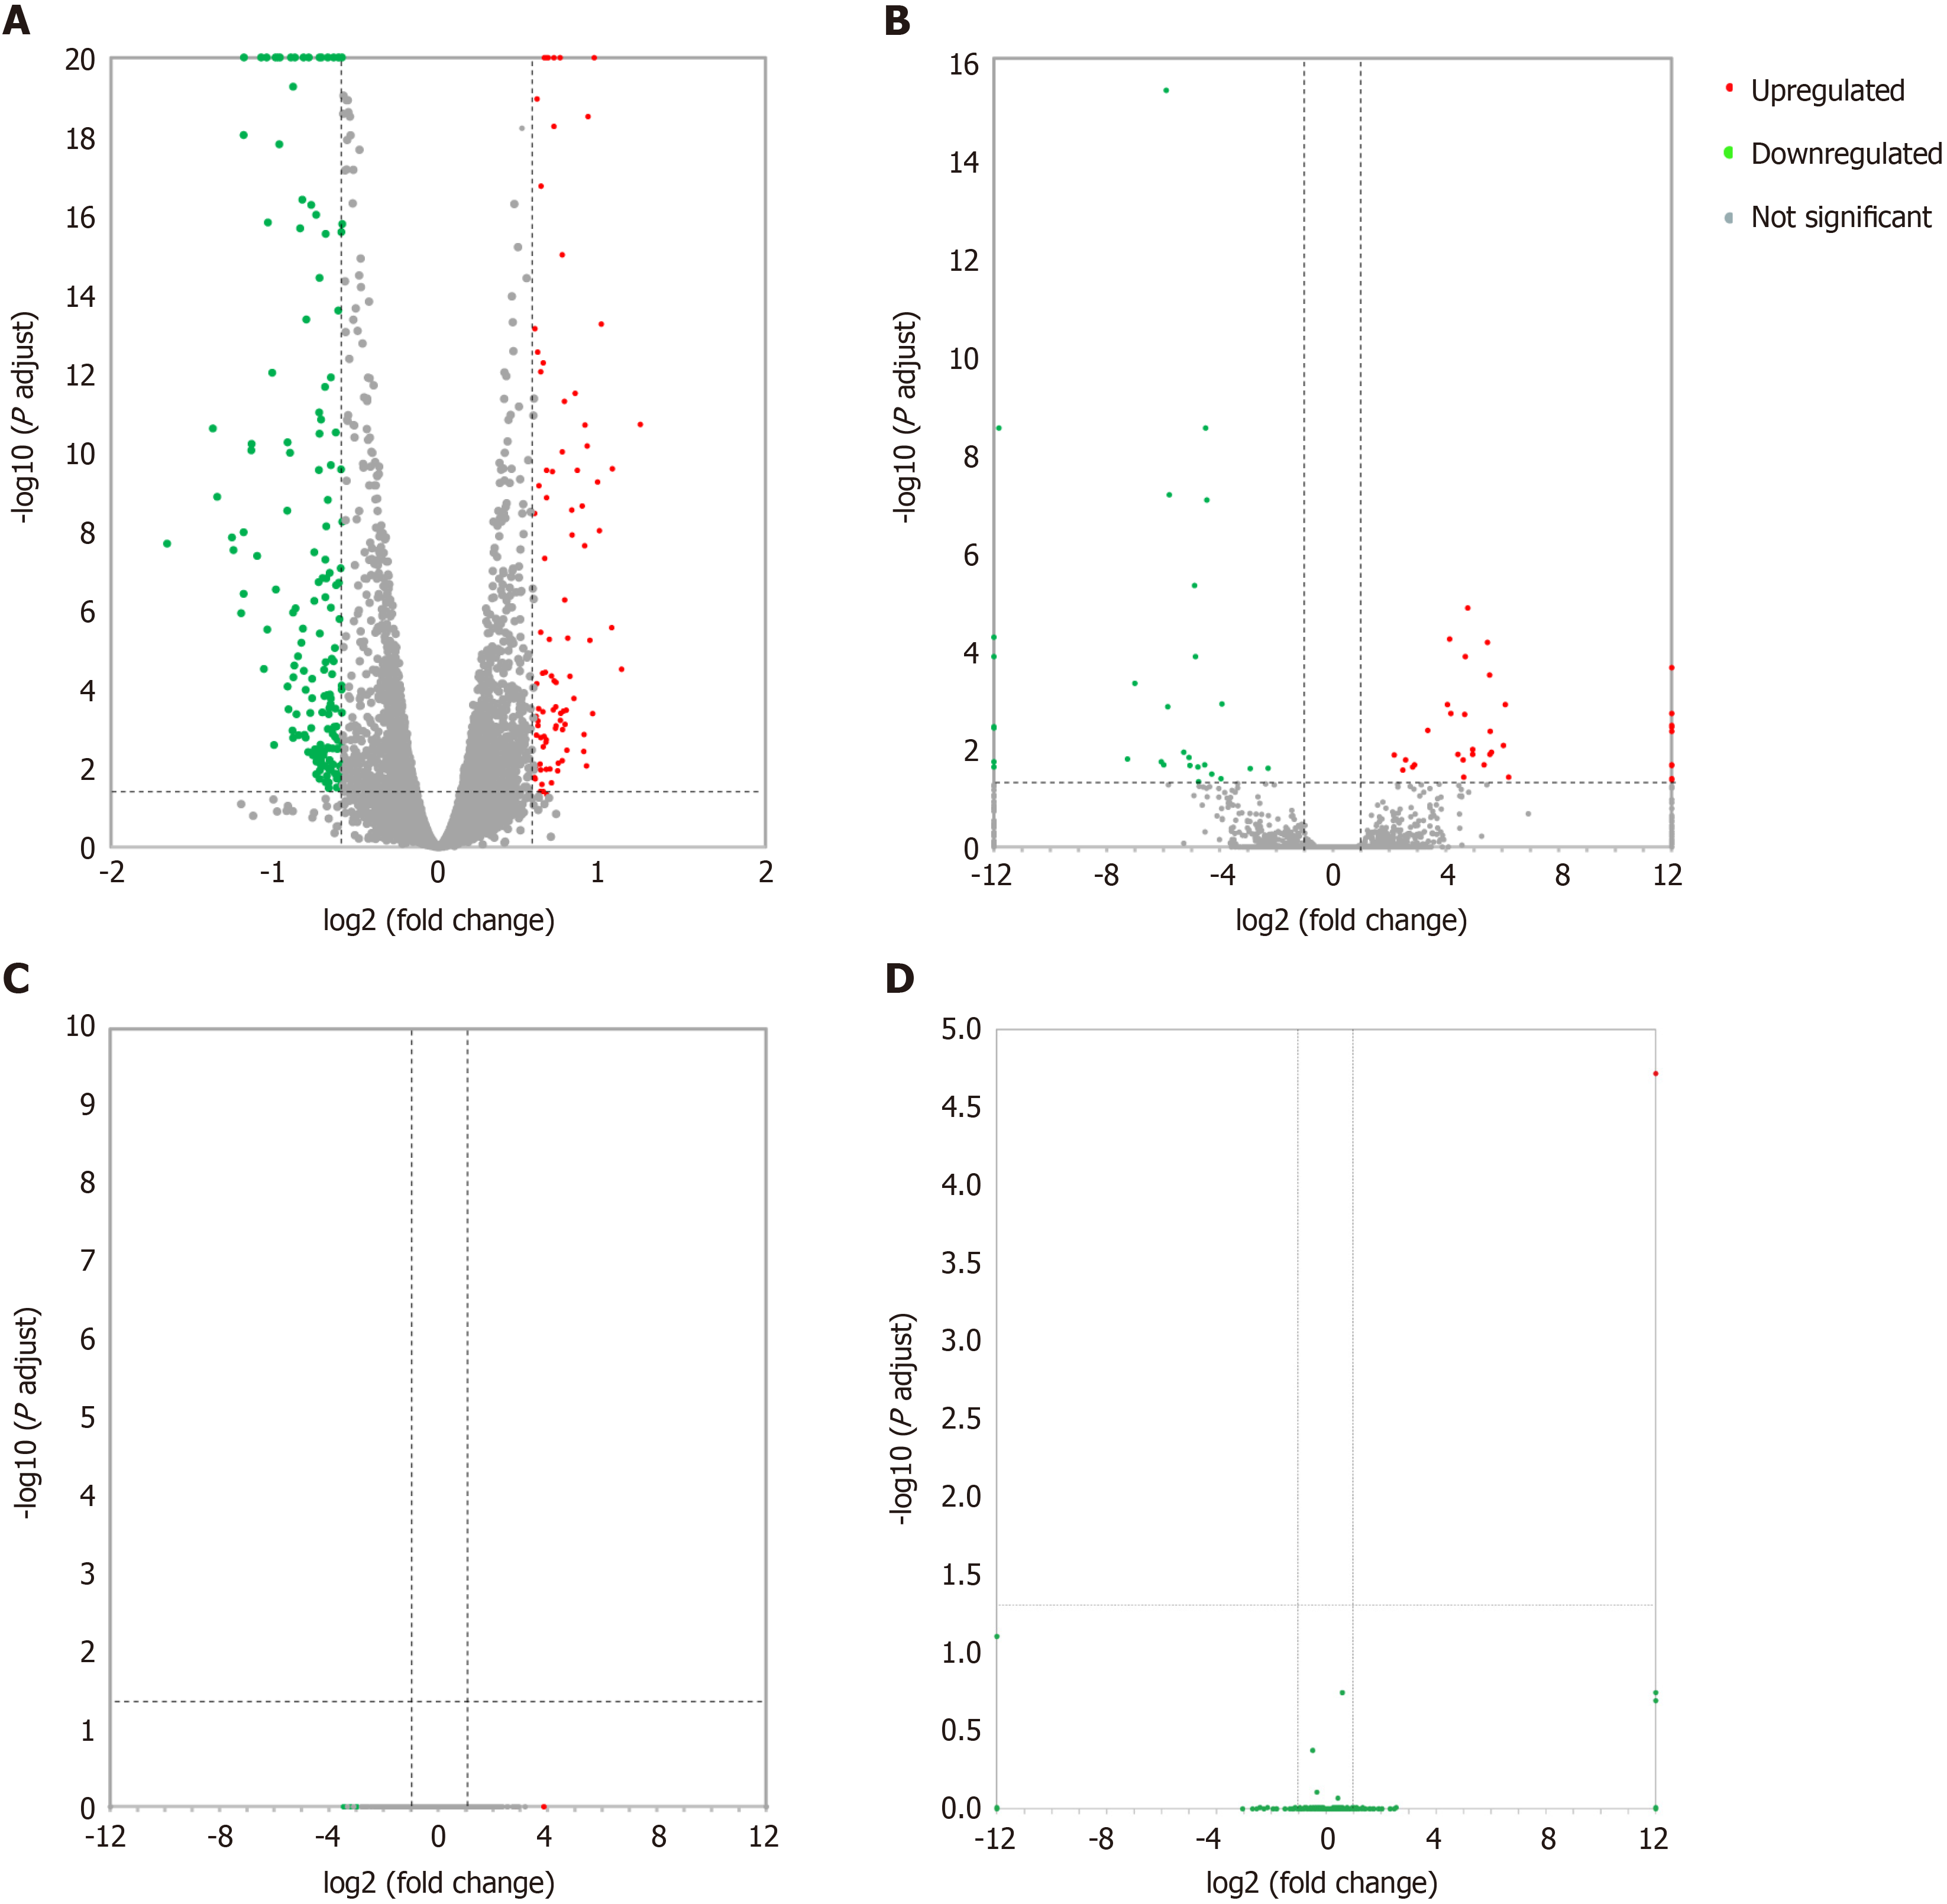
Figure 1 Volcano plots illustrating comparisons of differentially expressed messenger RNAs, long noncoding RNAs, circular RNAs, and microRNAs between each nanosecond pulsed electric field-treated group and the control group.
A: Differentially expressed messenger RNAs; B: Differentially expressed long noncoding RNAs; C: Differentially expressed circular RNAs; D: Differentially expressed microRNAs.
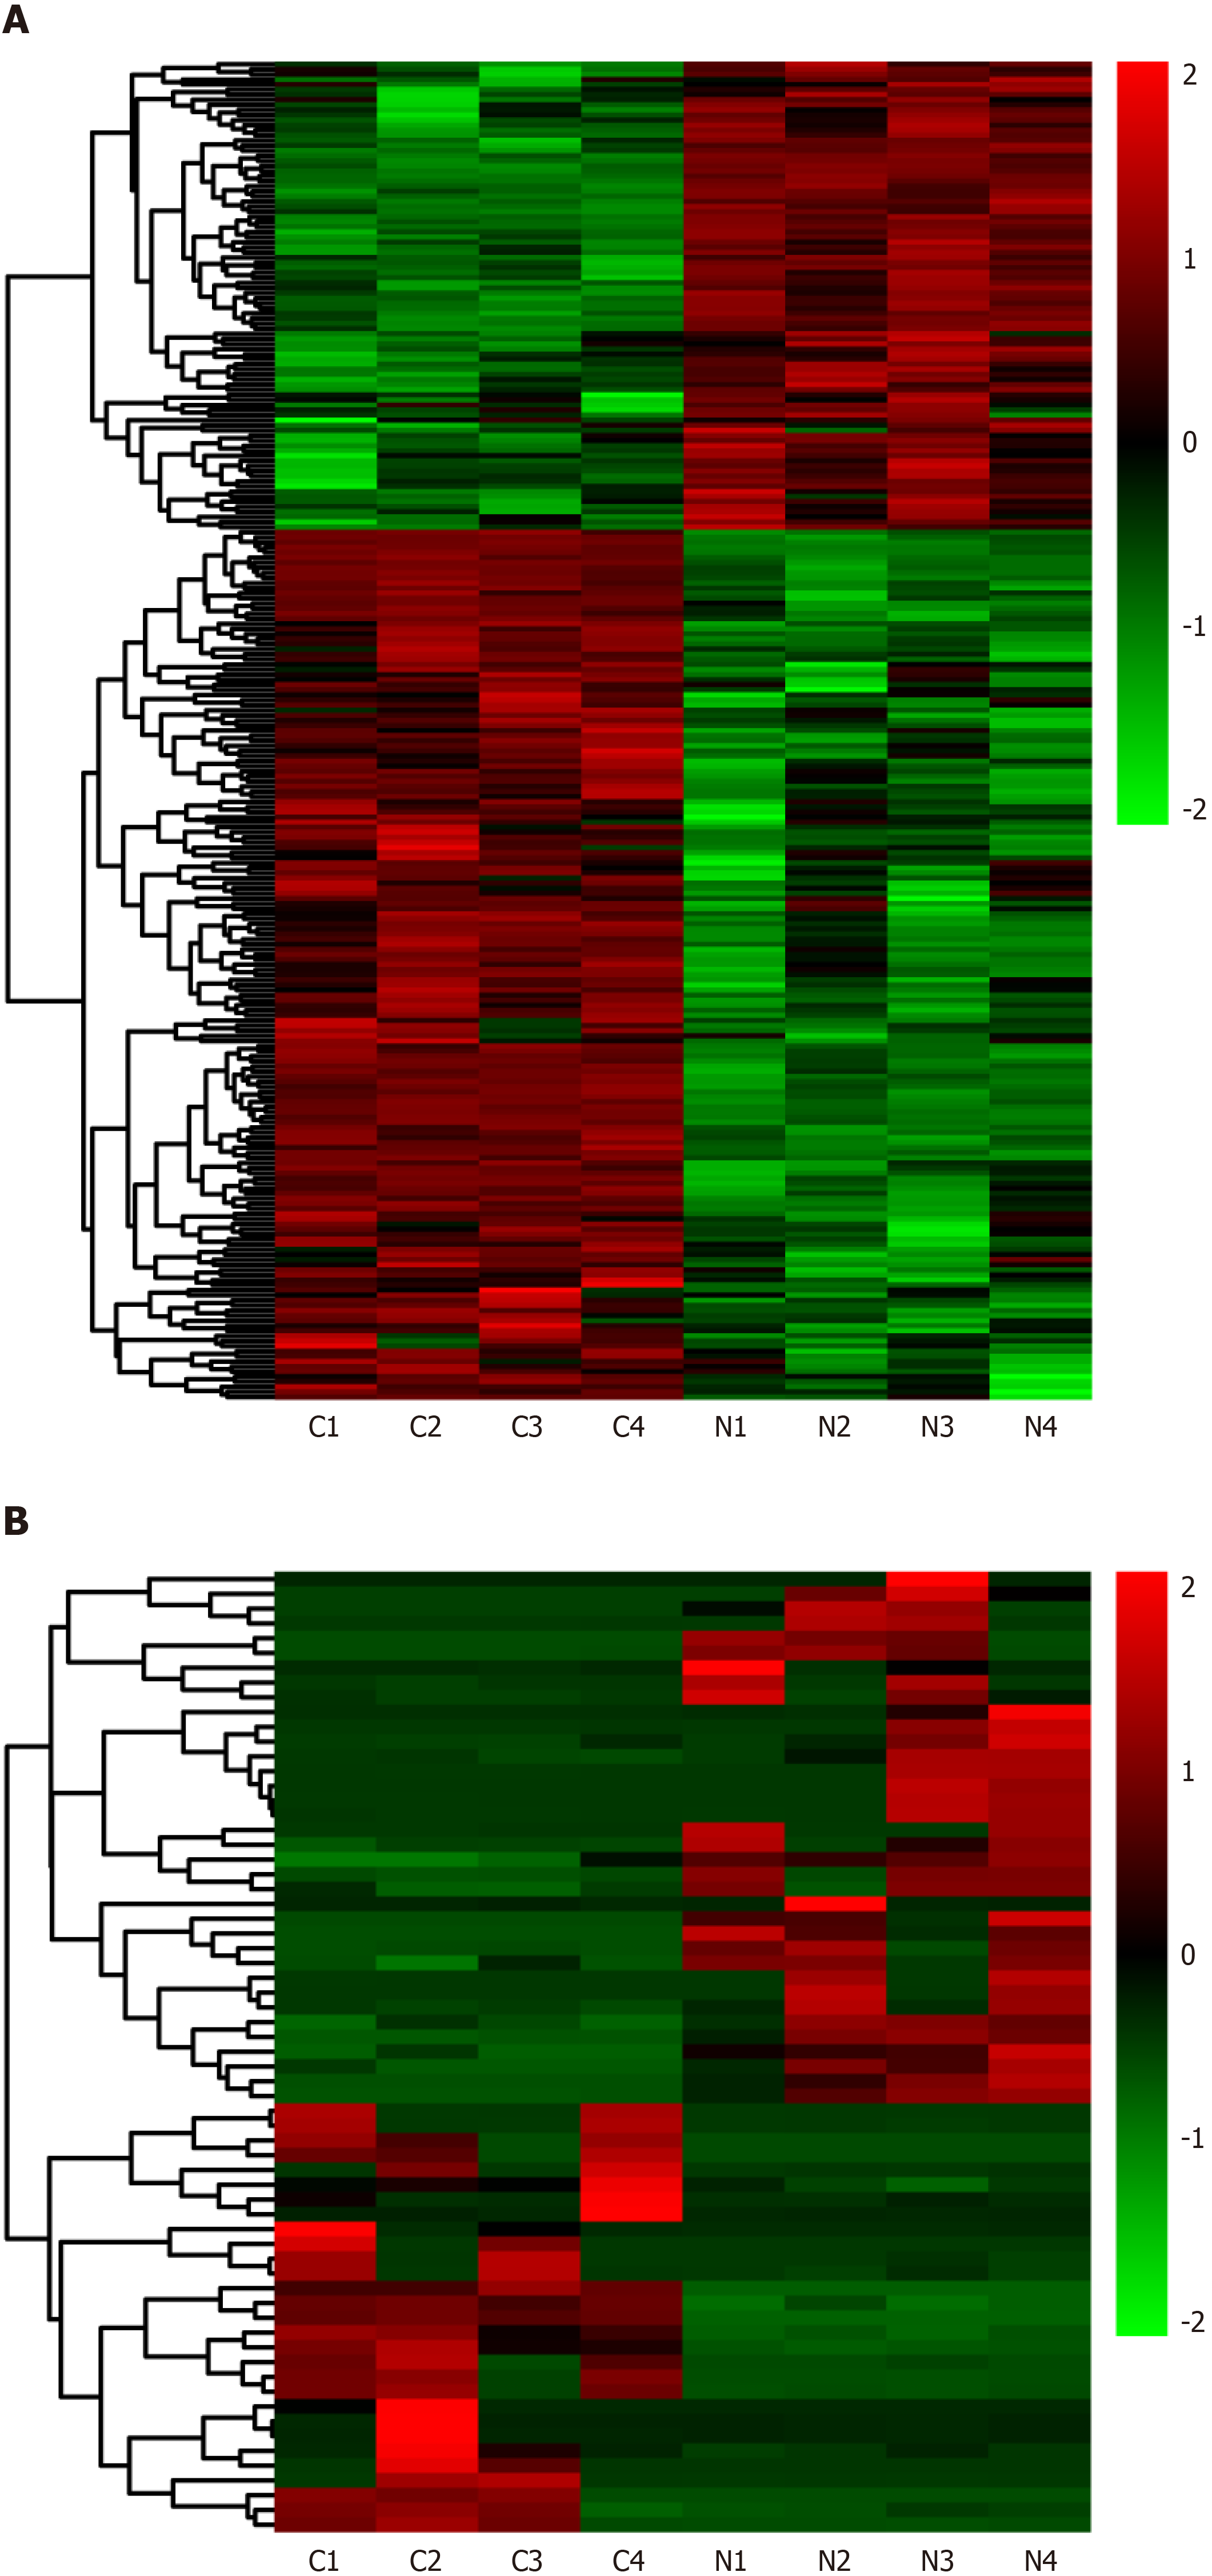
Figure 2 Heat maps displaying the hierarchical clustering of differentially expressed messenger RNAs and long noncoding RNAs.
A: Differentially expressed messenger RNAs, B: Differentially expressed long noncoding RNAs. Red indicates up-regulation and green indicates down-regulation.
Figure 3 Gene Ontology and Kyoto Encyclopedia of Genes and Genomes enrichment analyses of DE messenger RNAs.
A: Gene Ontology (GO) analysis of differentially expressed messenger RNAs (mRNAs). Bubble chart represents the significantly enriched pathways from the GO analysis. The color of dots in the bubble chart indicates the significance of the enriched category, and the size represents the scale of enriched genes in the terms; B: Kyoto Encyclopedia of Genes and Genomes (KEGG) analysis of differentially expressed mRNAs; C: Gene-concept network (cnetplot) of GO analysis; D: Gene-concept network (cnetplot) of KEGG analysis; E: Chord diagram of GO; F: Waterfall plot of KEGG analysis. KECG: Kyoto Encyclopedia of Genes and Genomes.
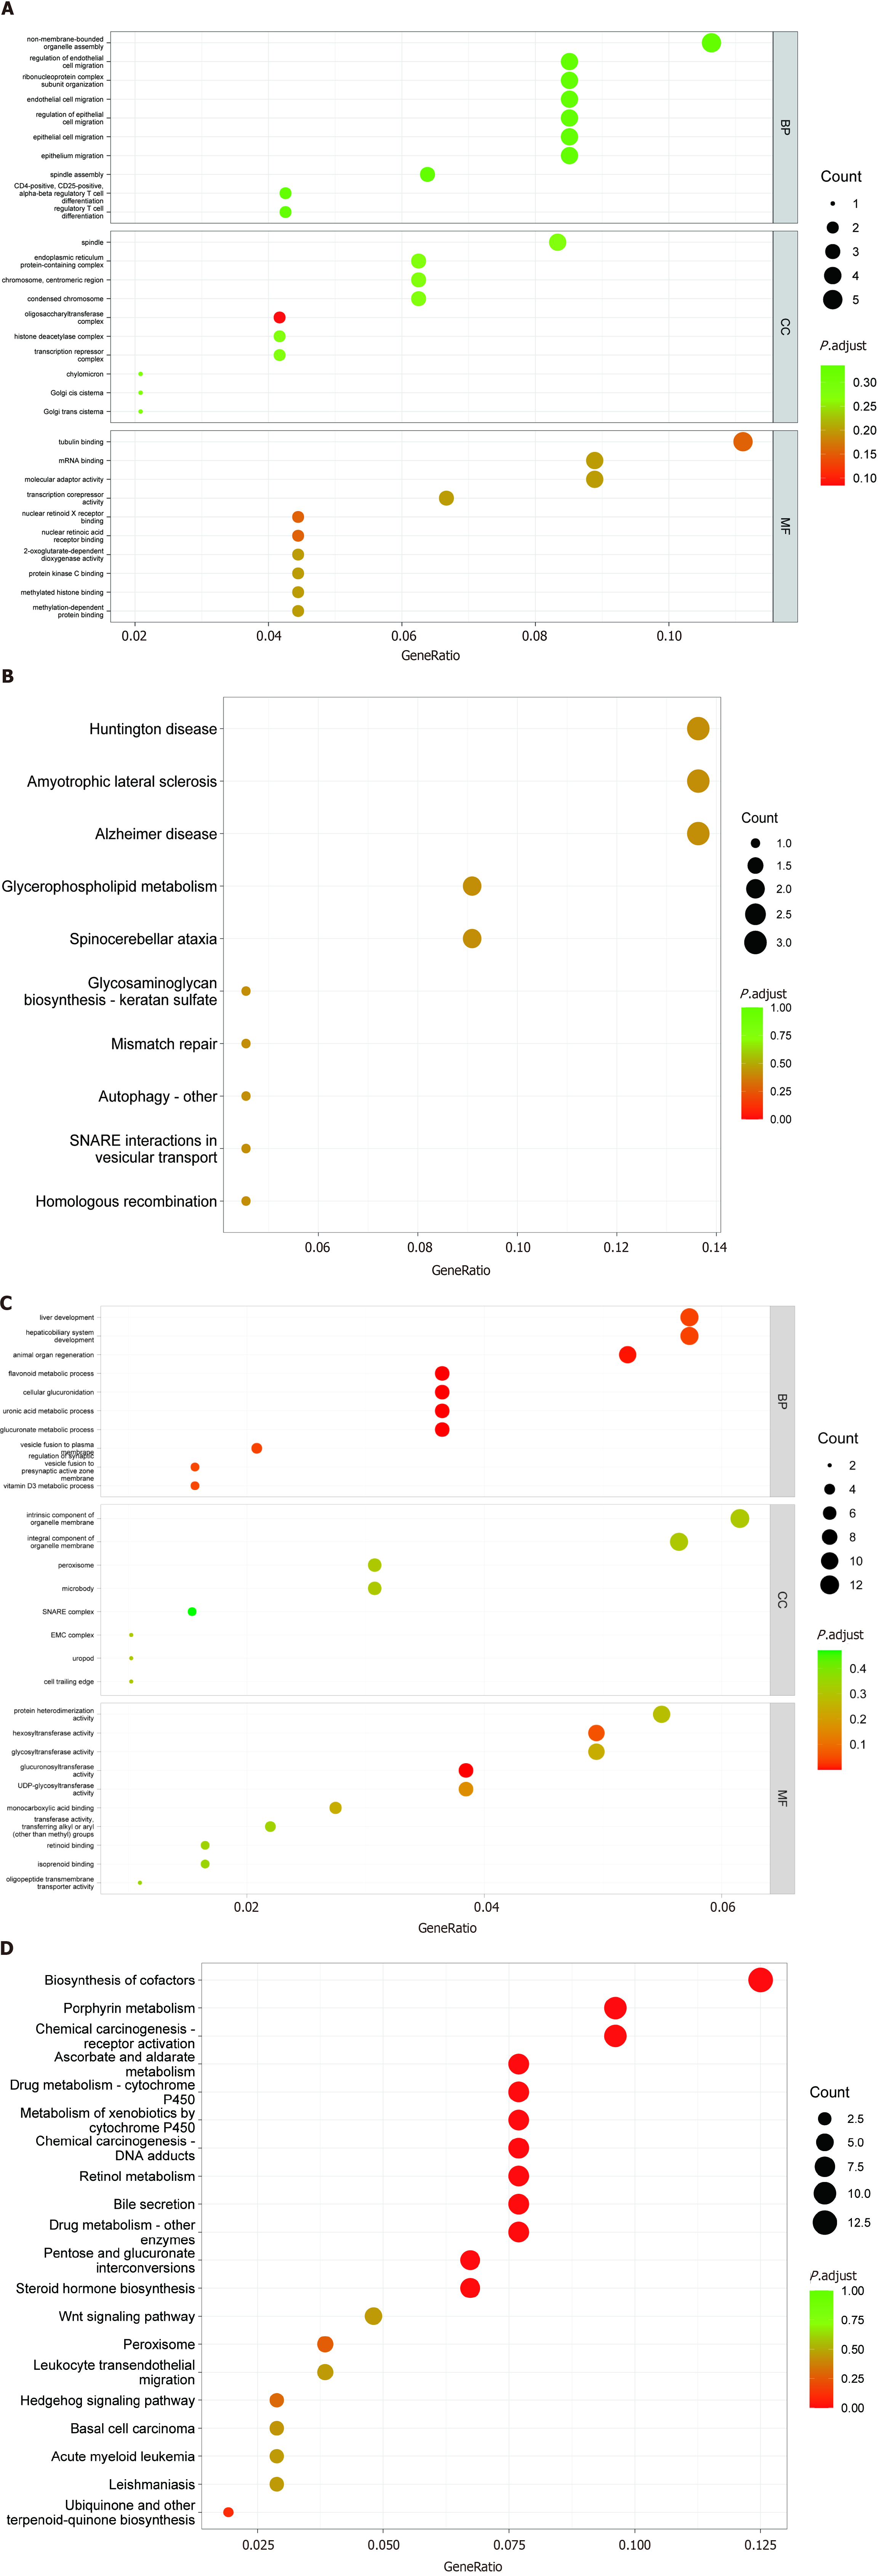
Figure 4 Gene Ontology and Kyoto Encyclopedia of Genes and Genomes enrichment analyses of target genes of differentially expressed long noncoding RNAs and microRNAs.
A: Gene Ontology (GO) analysis of target genes of differentially expressed long noncoding RNAs (lncRNAs); B: Kyoto Encyclopedia of Genes and Genomes (KEGG) analysis of target genes of differentially expressed lncRNAs; C: GO analysis of target genes of differentially expressed microRNAs (miRNAs); D: KEGG analysis of target genes of differentially expressed miRNAs.
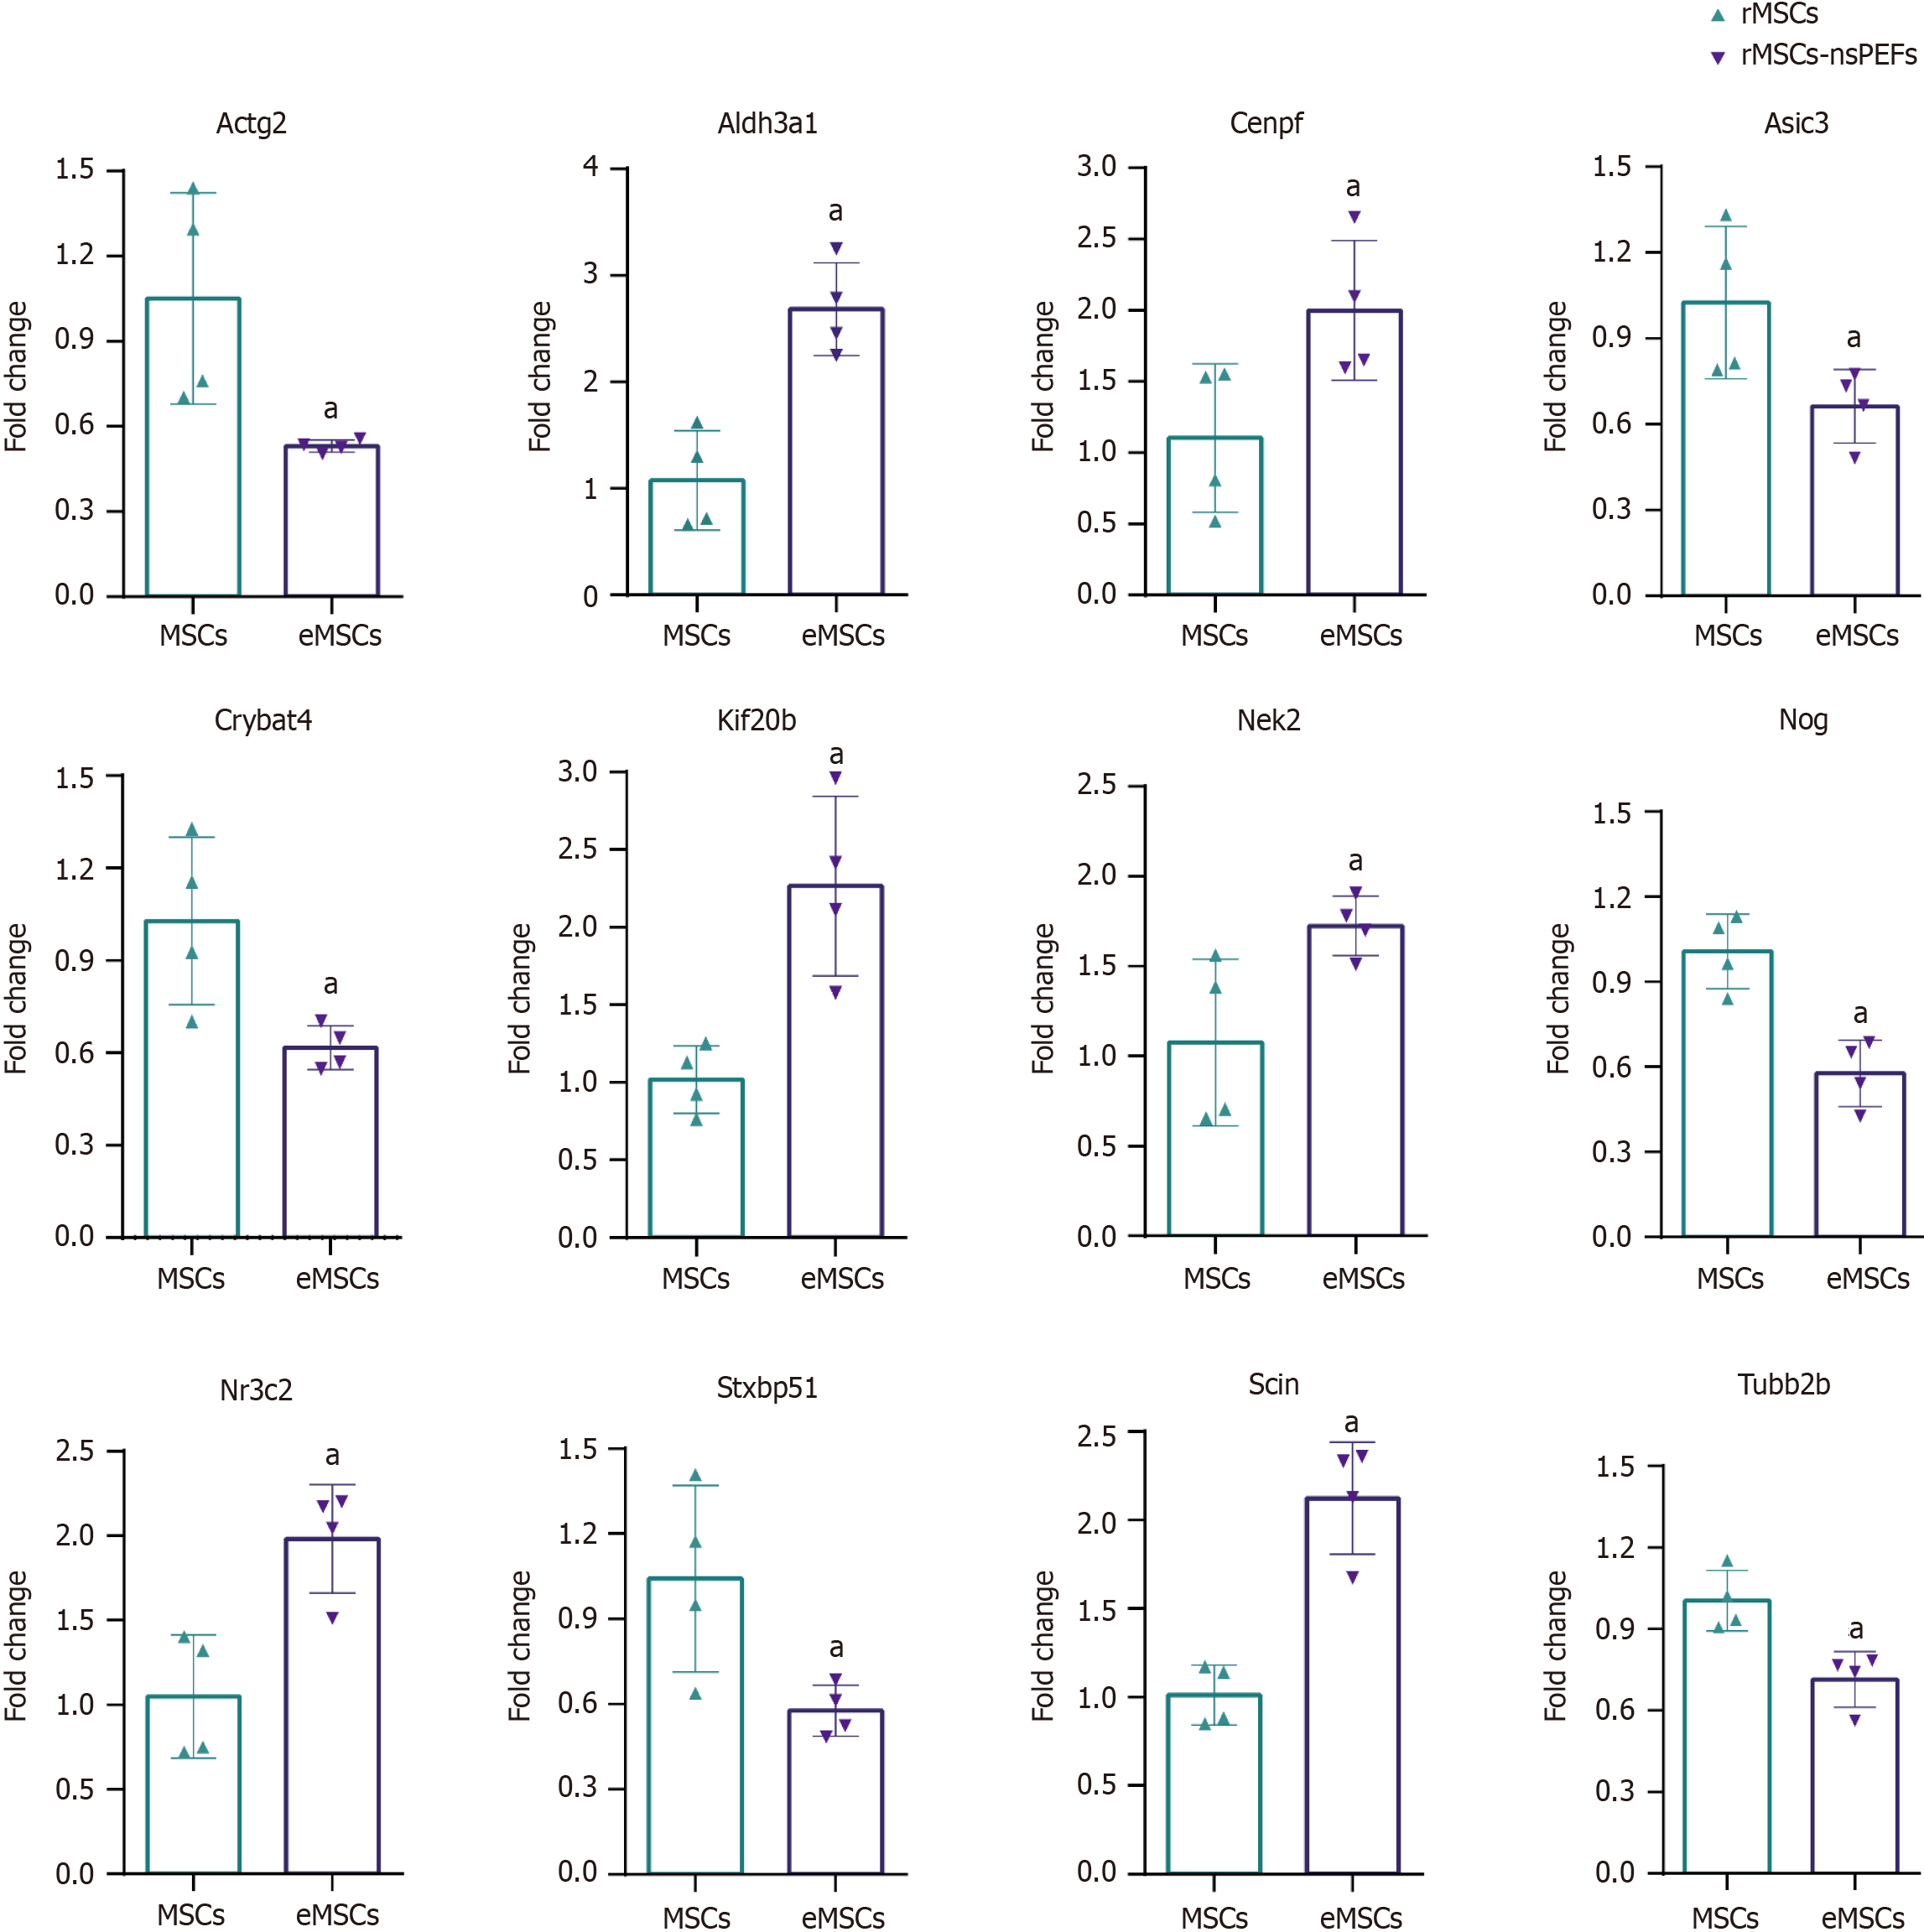
Figure 5 Gene expression validation by quantitative polymerase chain reaction.
The error bars represent the standard deviations of measurements in three separate sample runs (n = 3). aP < 0.05. rMSCs: Rat bone marrow mesenchymal stem cells; MSCs: Mesenchymal stem cells; eMSCs: Mesenchymal stem cells stimulated with nanosecond pulsed electric fields; nsPEFs: Nanosecond pulsed electric fields.
- Citation: Lin JJ, Ning T, Jia SC, Li KJ, Huang YC, Liu Q, Lin JH, Zhang XT. Evaluation of genetic response of mesenchymal stem cells to nanosecond pulsed electric fields by whole transcriptome sequencing. World J Stem Cells 2024; 16(3): 305-323
- URL: https://www.wjgnet.com/1948-0210/full/v16/i3/305.htm
- DOI: https://dx.doi.org/10.4252/wjsc.v16.i3.305


