Copyright
©The Author(s) 2024.
World J Stem Cells. Mar 26, 2024; 16(3): 287-304
Published online Mar 26, 2024. doi: 10.4252/wjsc.v16.i3.287
Published online Mar 26, 2024. doi: 10.4252/wjsc.v16.i3.287
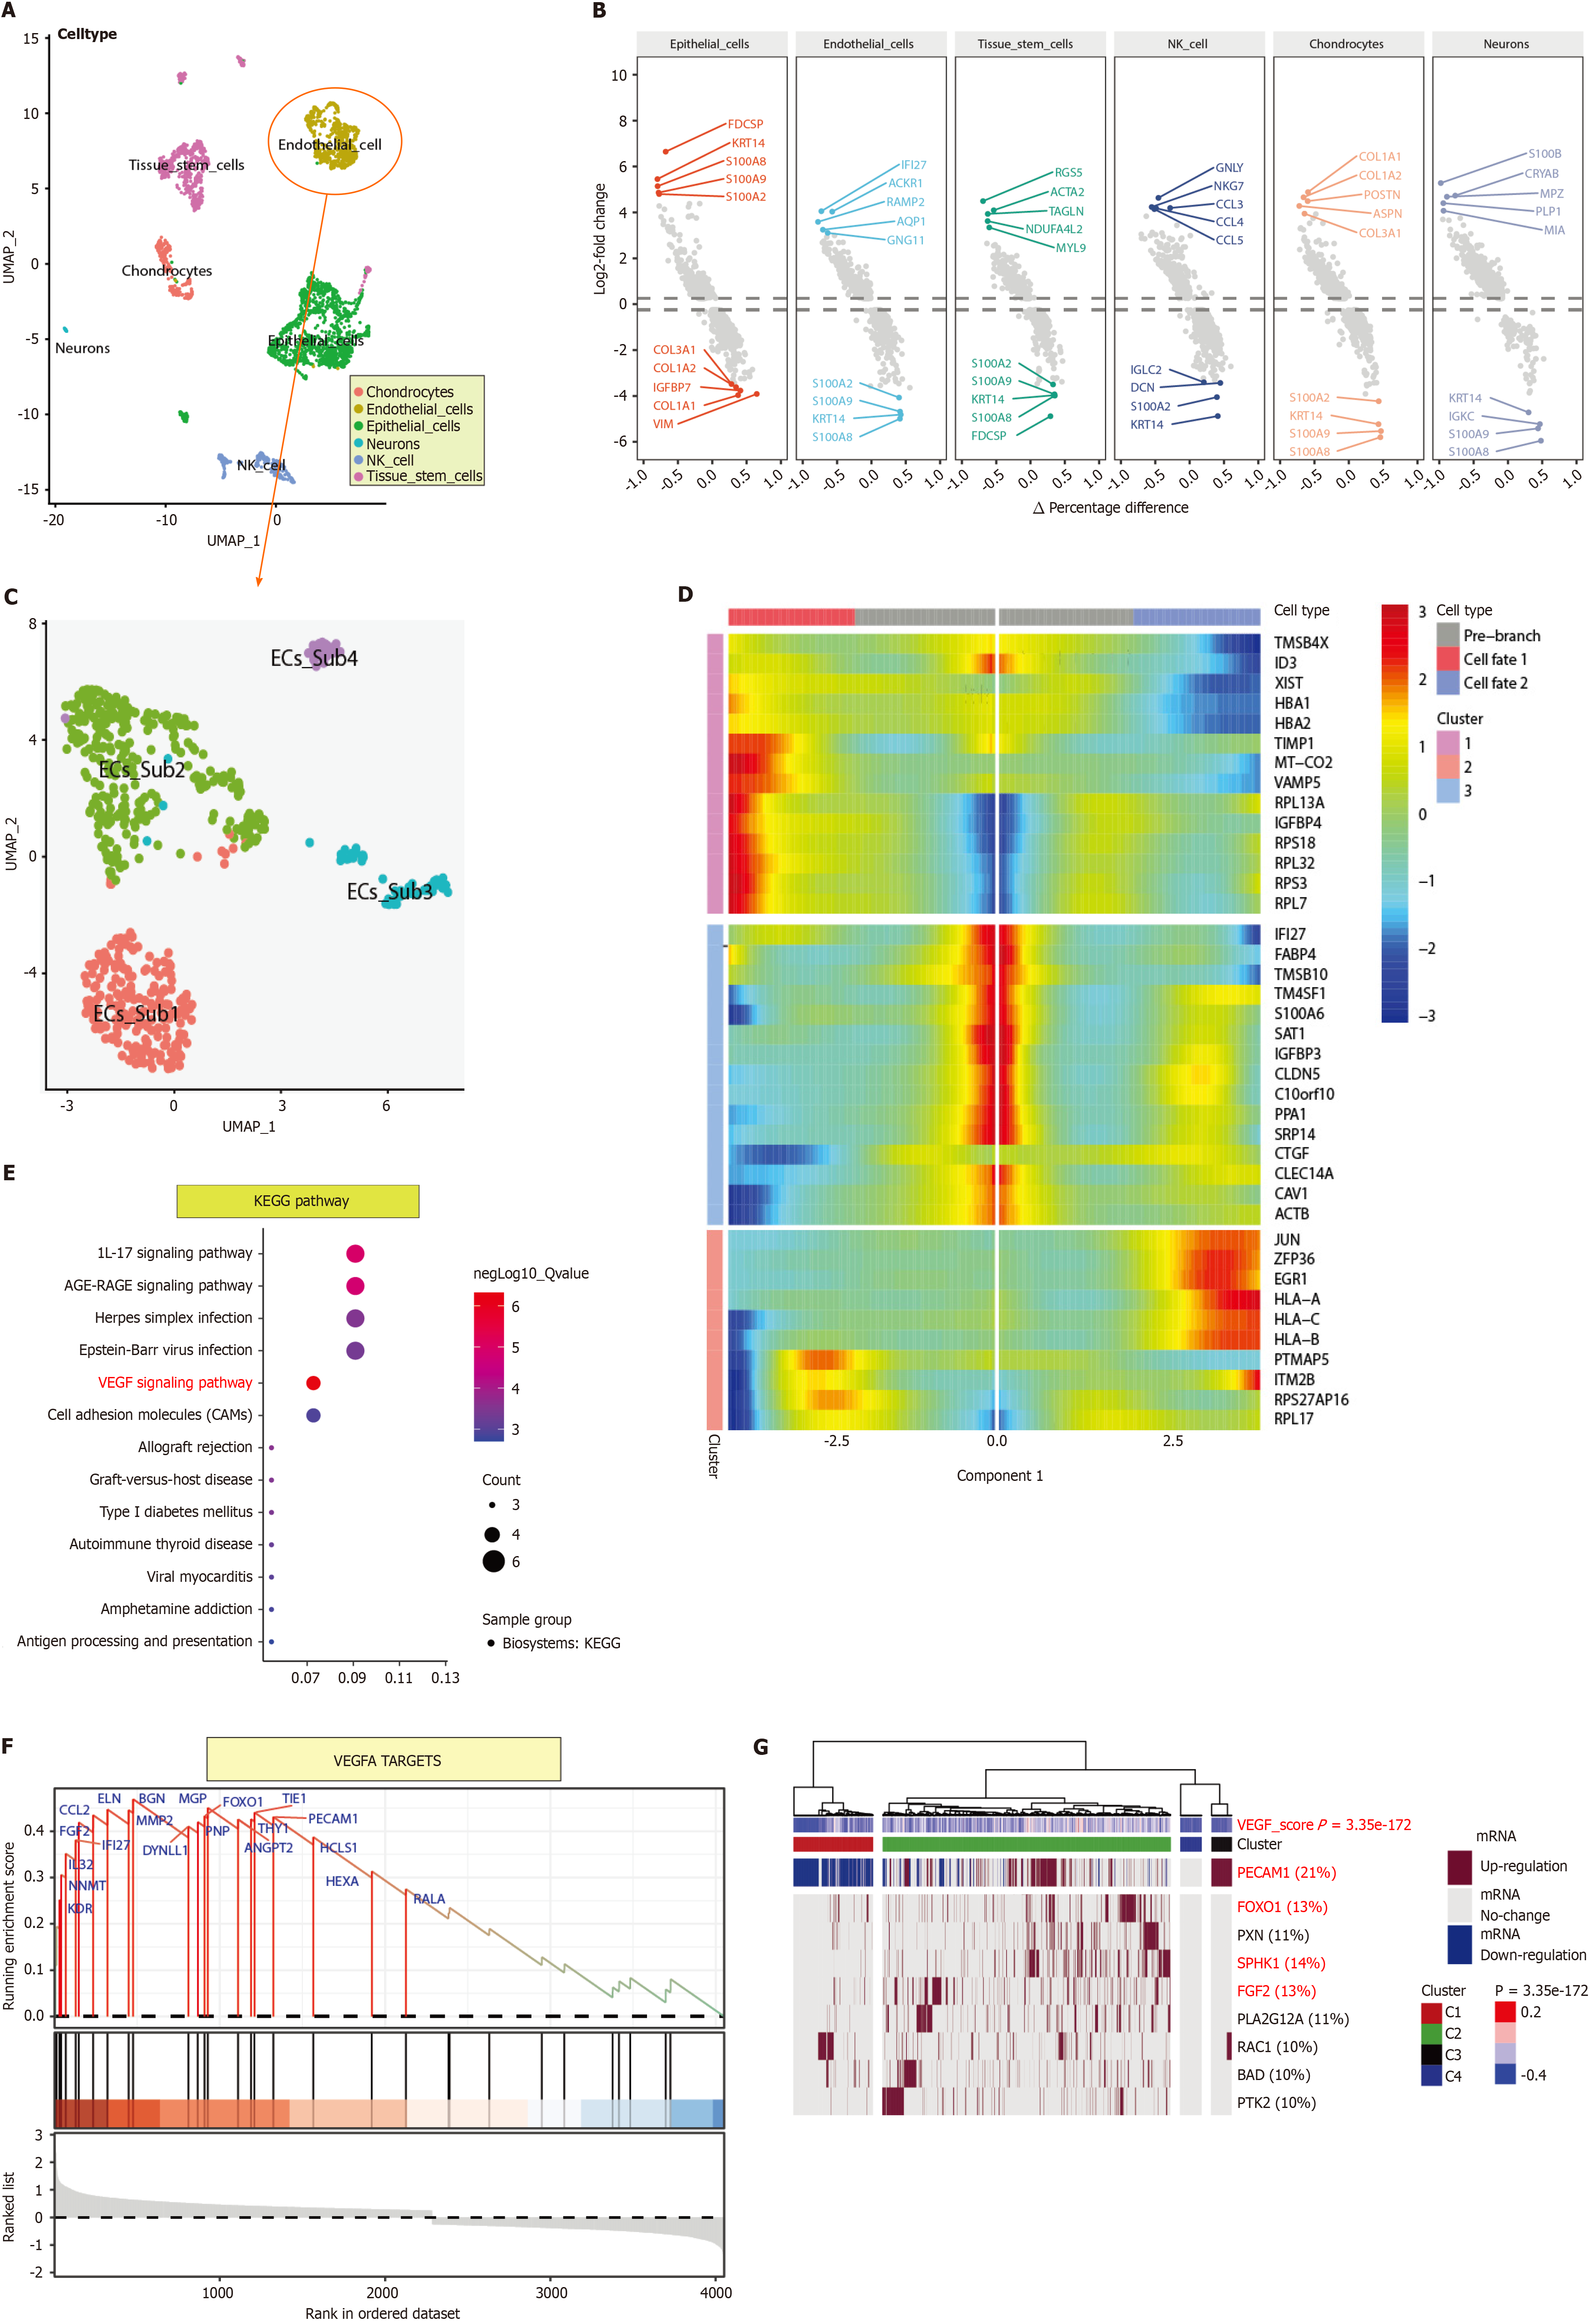
Figure 1 The single-cell atlas of human teeth.
A: Single-cell RNA sequencing data from human teeth were projected onto the UMAP map. Annotation-cell and nonannotation clusters are presented on the same UMAP plot; B: The top 5 upregulated and downregulated differentially expressed genes (DEGs) were subsequently detected in each cell cluster; C: The UMAP map shows all the endothelial cell subsets; D: Heatmap of DEGs associated with endothelial cell subset development according to pseudotime trajectory analysis. The prebranch, cell fate1, and cell fate2 subsets of endothelial cells exhibit distinct fates; E: Vascular endothelial growth factor A targets identified by gene set enrichment analysis for pseudotime trajectory-related DEGs; F: GSVA and Ternary Cluster analyses revealed a significant difference in the vascular endothelial growth factor signalling pathway among the dental pulp endothelial cells; G: The GSVA and Ternary Cluster analyses showed a significant difference in vascular endothelial growth factor signaling pathway among dental pulp endothelial cells. VEGFA: Vascular endothelial growth factor A; IL: Interleukin; KEGG: Kyoto Encyclopedia of Genes and Genomes.
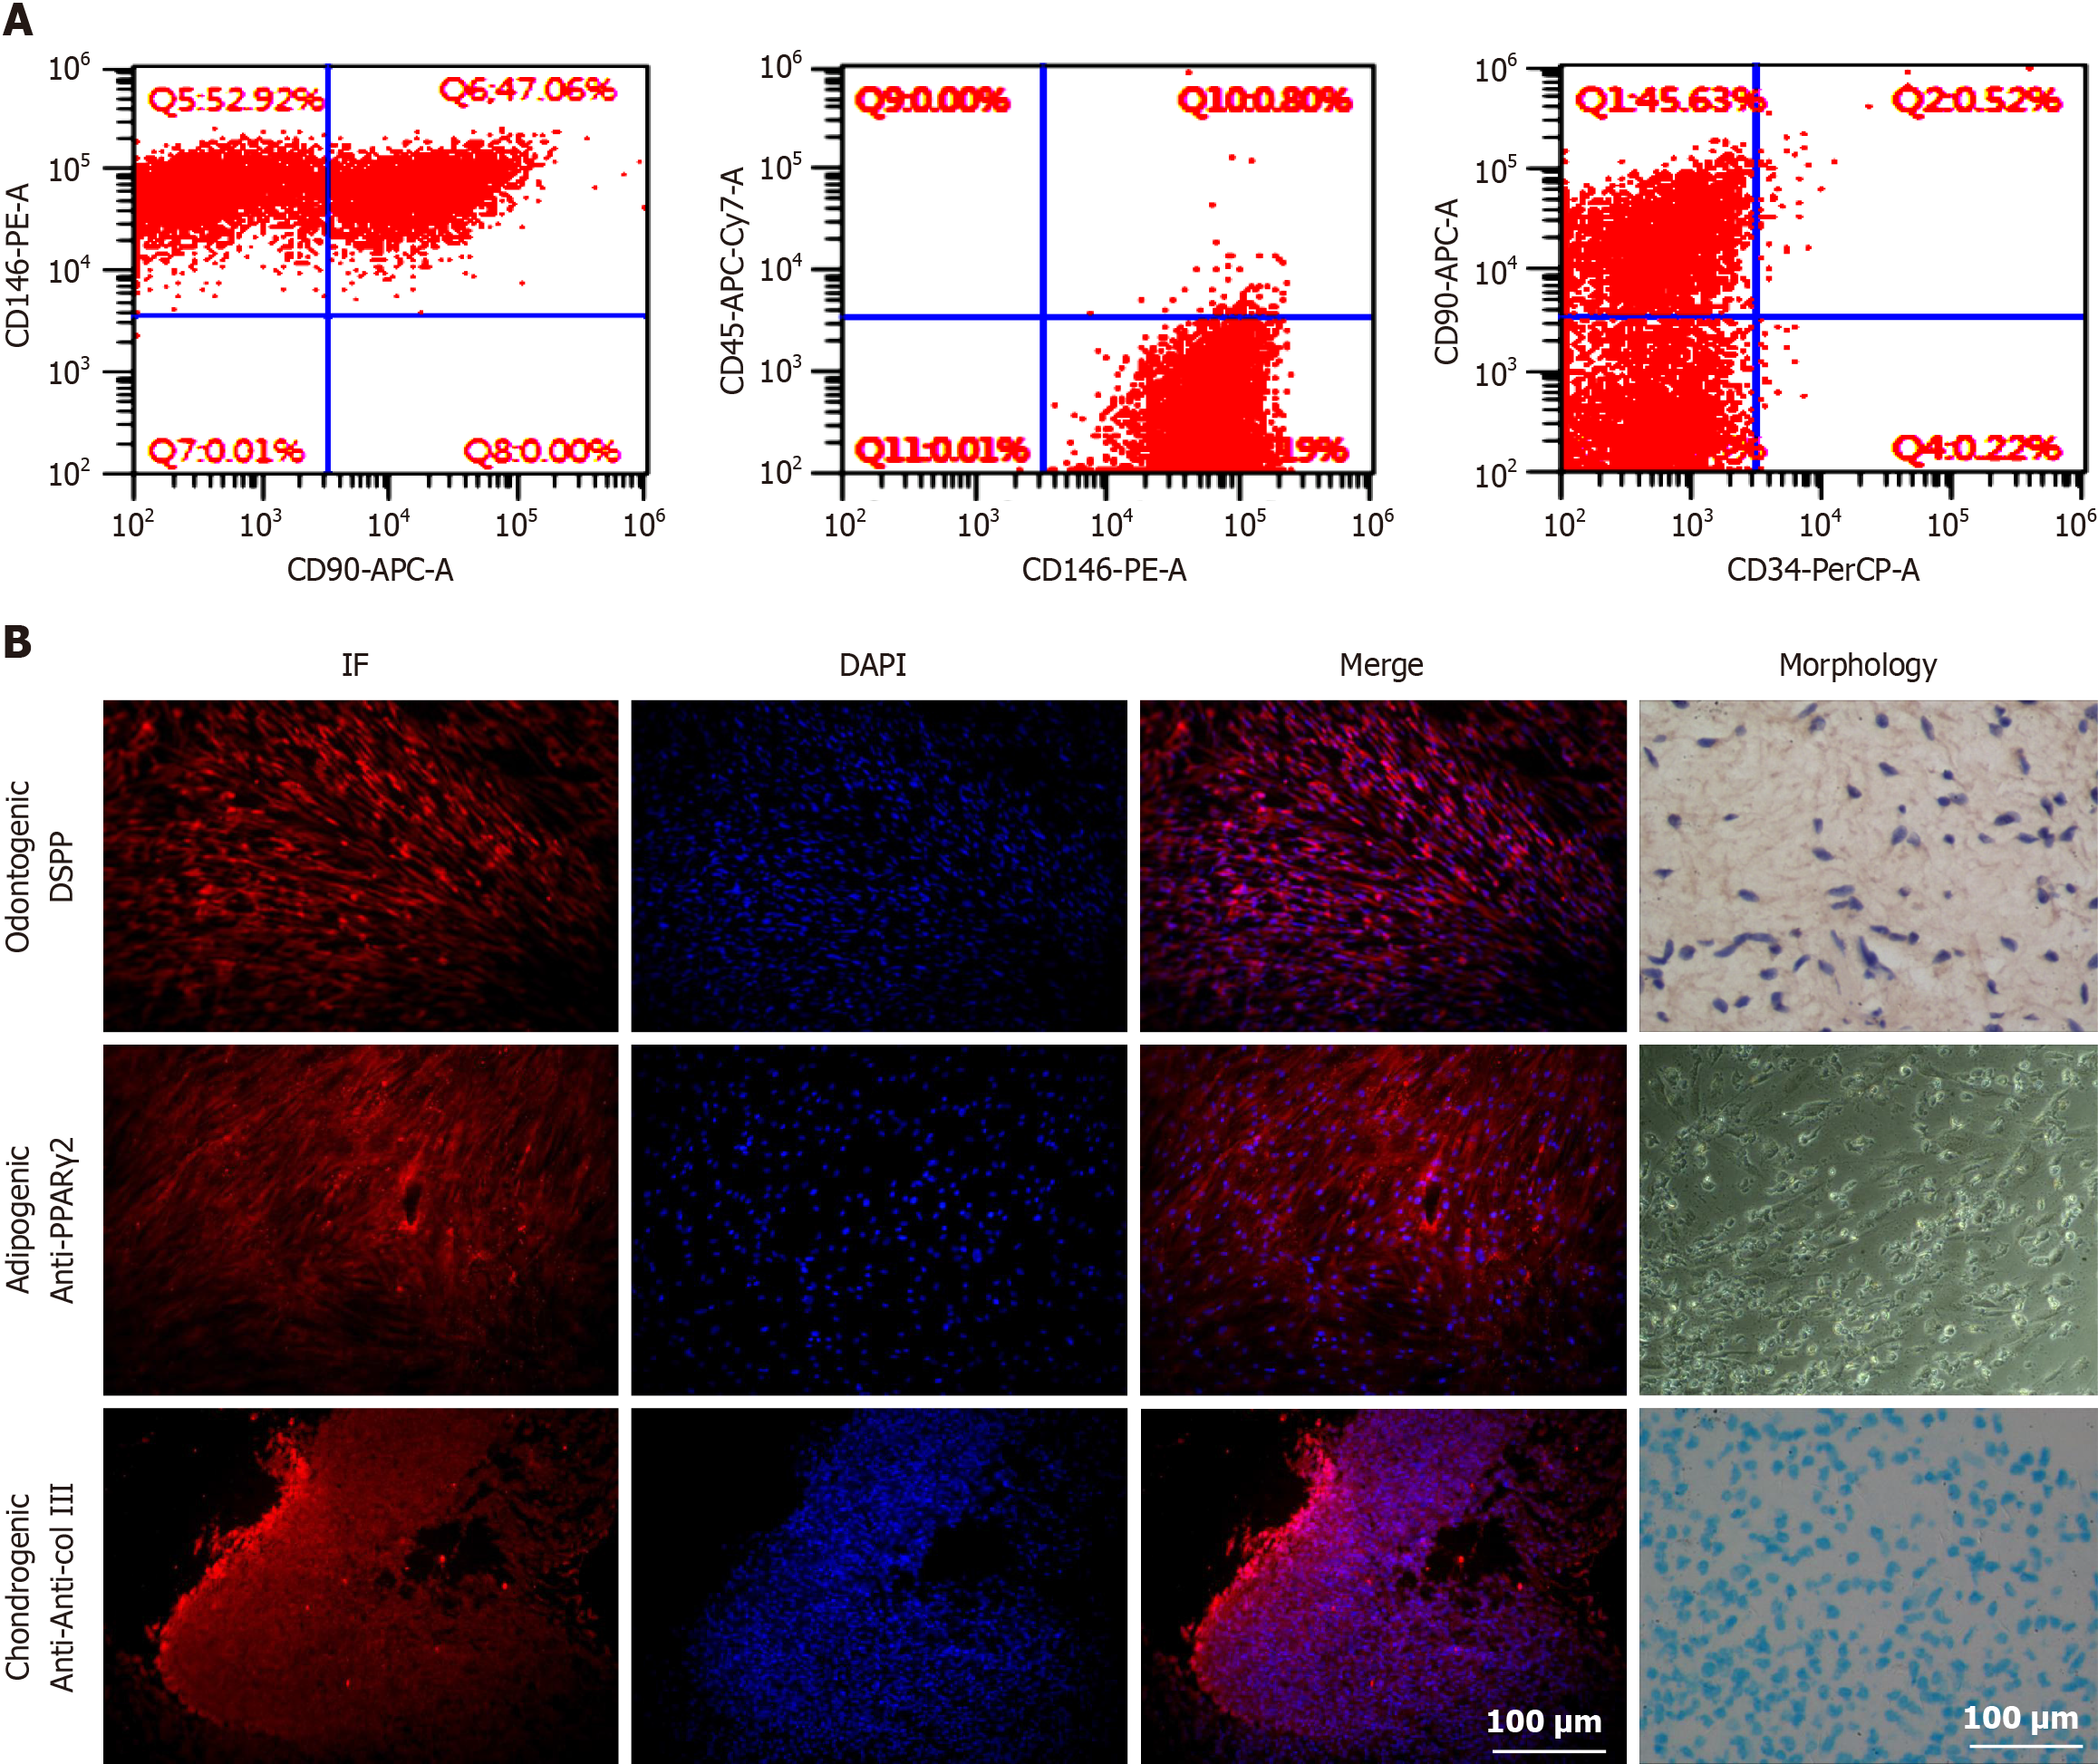
Figure 2 Human dental pulp stem cell culture and identification of multilineage differentiation ability.
A: Human dental pulp stem cell surface marker identification; B: Immunofluorescence staining for dentin sialophosphoprotein, peroxisome proliferator-activated receptor γ2, and collagen type III. Osteogenic, adipogenic, and chondrogenic differentiation were examined by assessing mineralised nodule formation, oil red O staining, and alcian blue staining, respectively, via pellet culture (morphology). Scale bar = 100 μm. DSPP: Dentin sialophosphoprotein; PPARγ2: Peroxisome proliferator-activated receptor γ2; col III: Collagen type III; IF: Immunofluorescence; DAPI: 4’,6-diamidino-2-phenylindole.
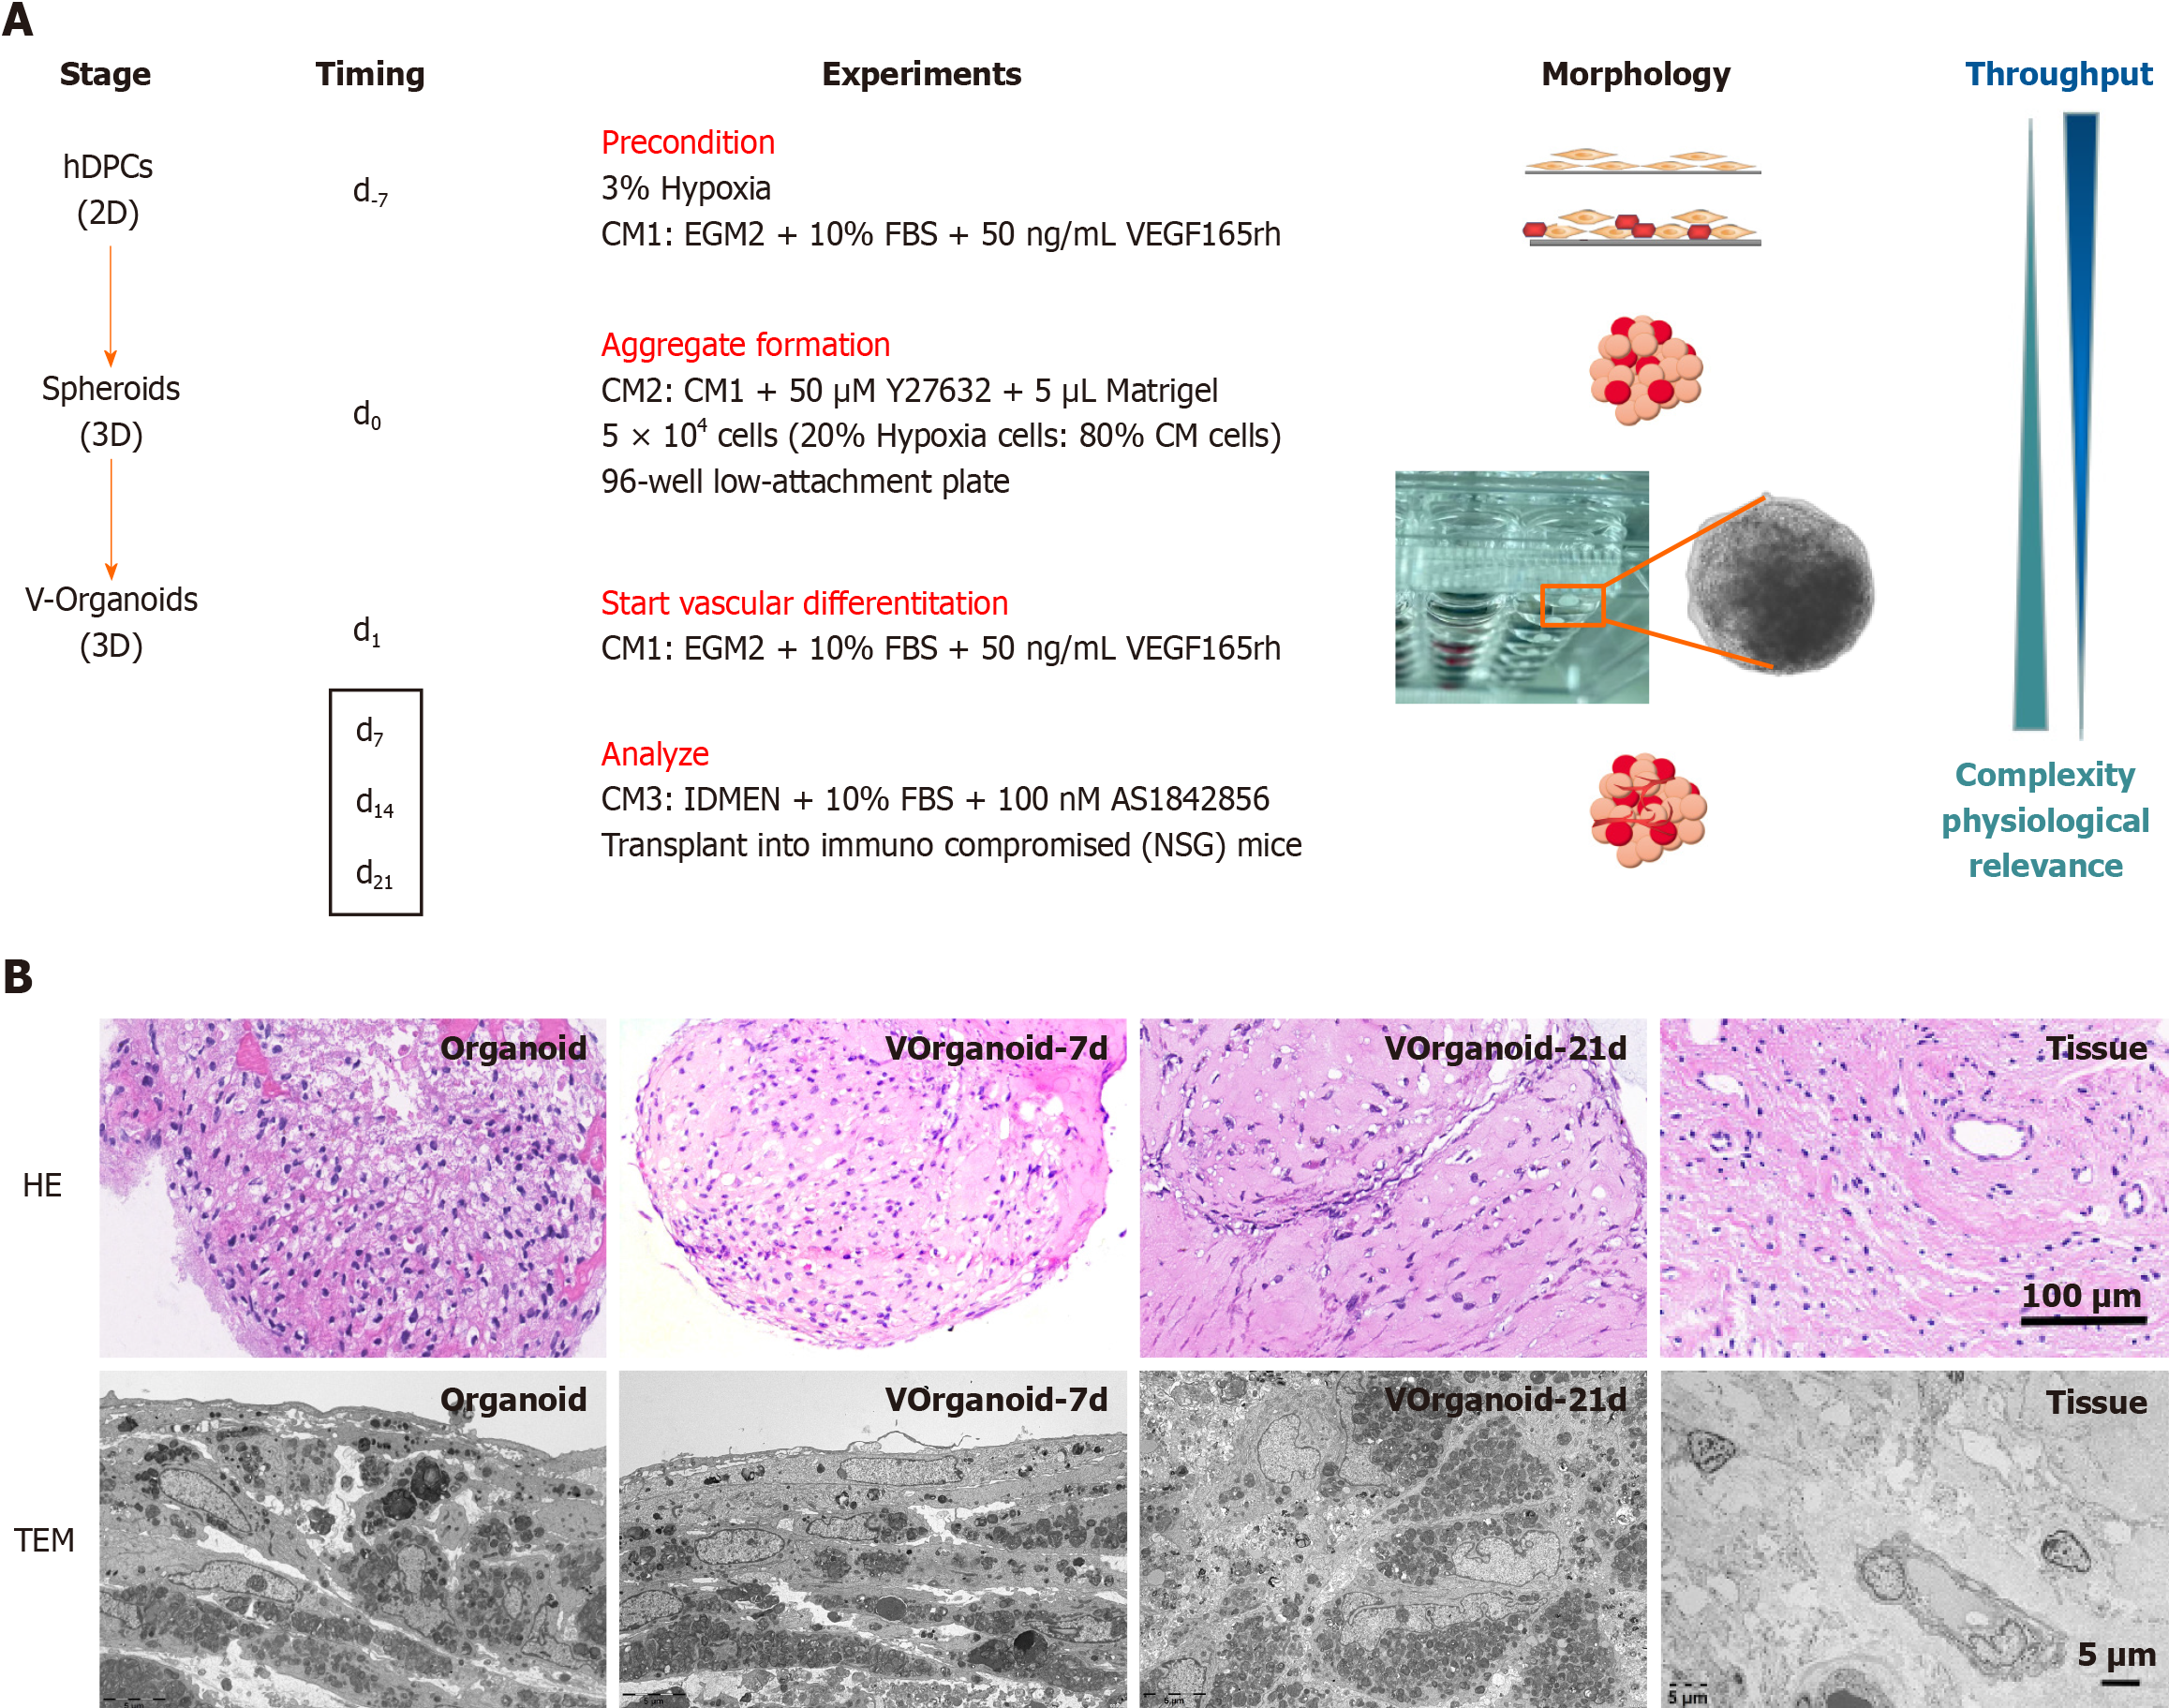
Figure 3 Strategies for the construction of a model for the study of prevascularized dental pulp organoids (Vorganoids).
A: Schematic diagram of the timeline for generating Vorganoids from human dental pulp stem cells; B: Morphological differences between normal tissues, organoids, and vorganoids. Scale bar for hematoxylin-eosin staining = 100 μm and for transchromatic electron microscope = 5 μm. CM: Condition medium; HE: Hematoxylin-eosin; TEM: Transchromatic electron microscope; hDPCs: Human dental pulp stem cells; VEGF: Vascular endothelial growth factor; CM: Conditioned medium; FBS: Foetal bovine serum.
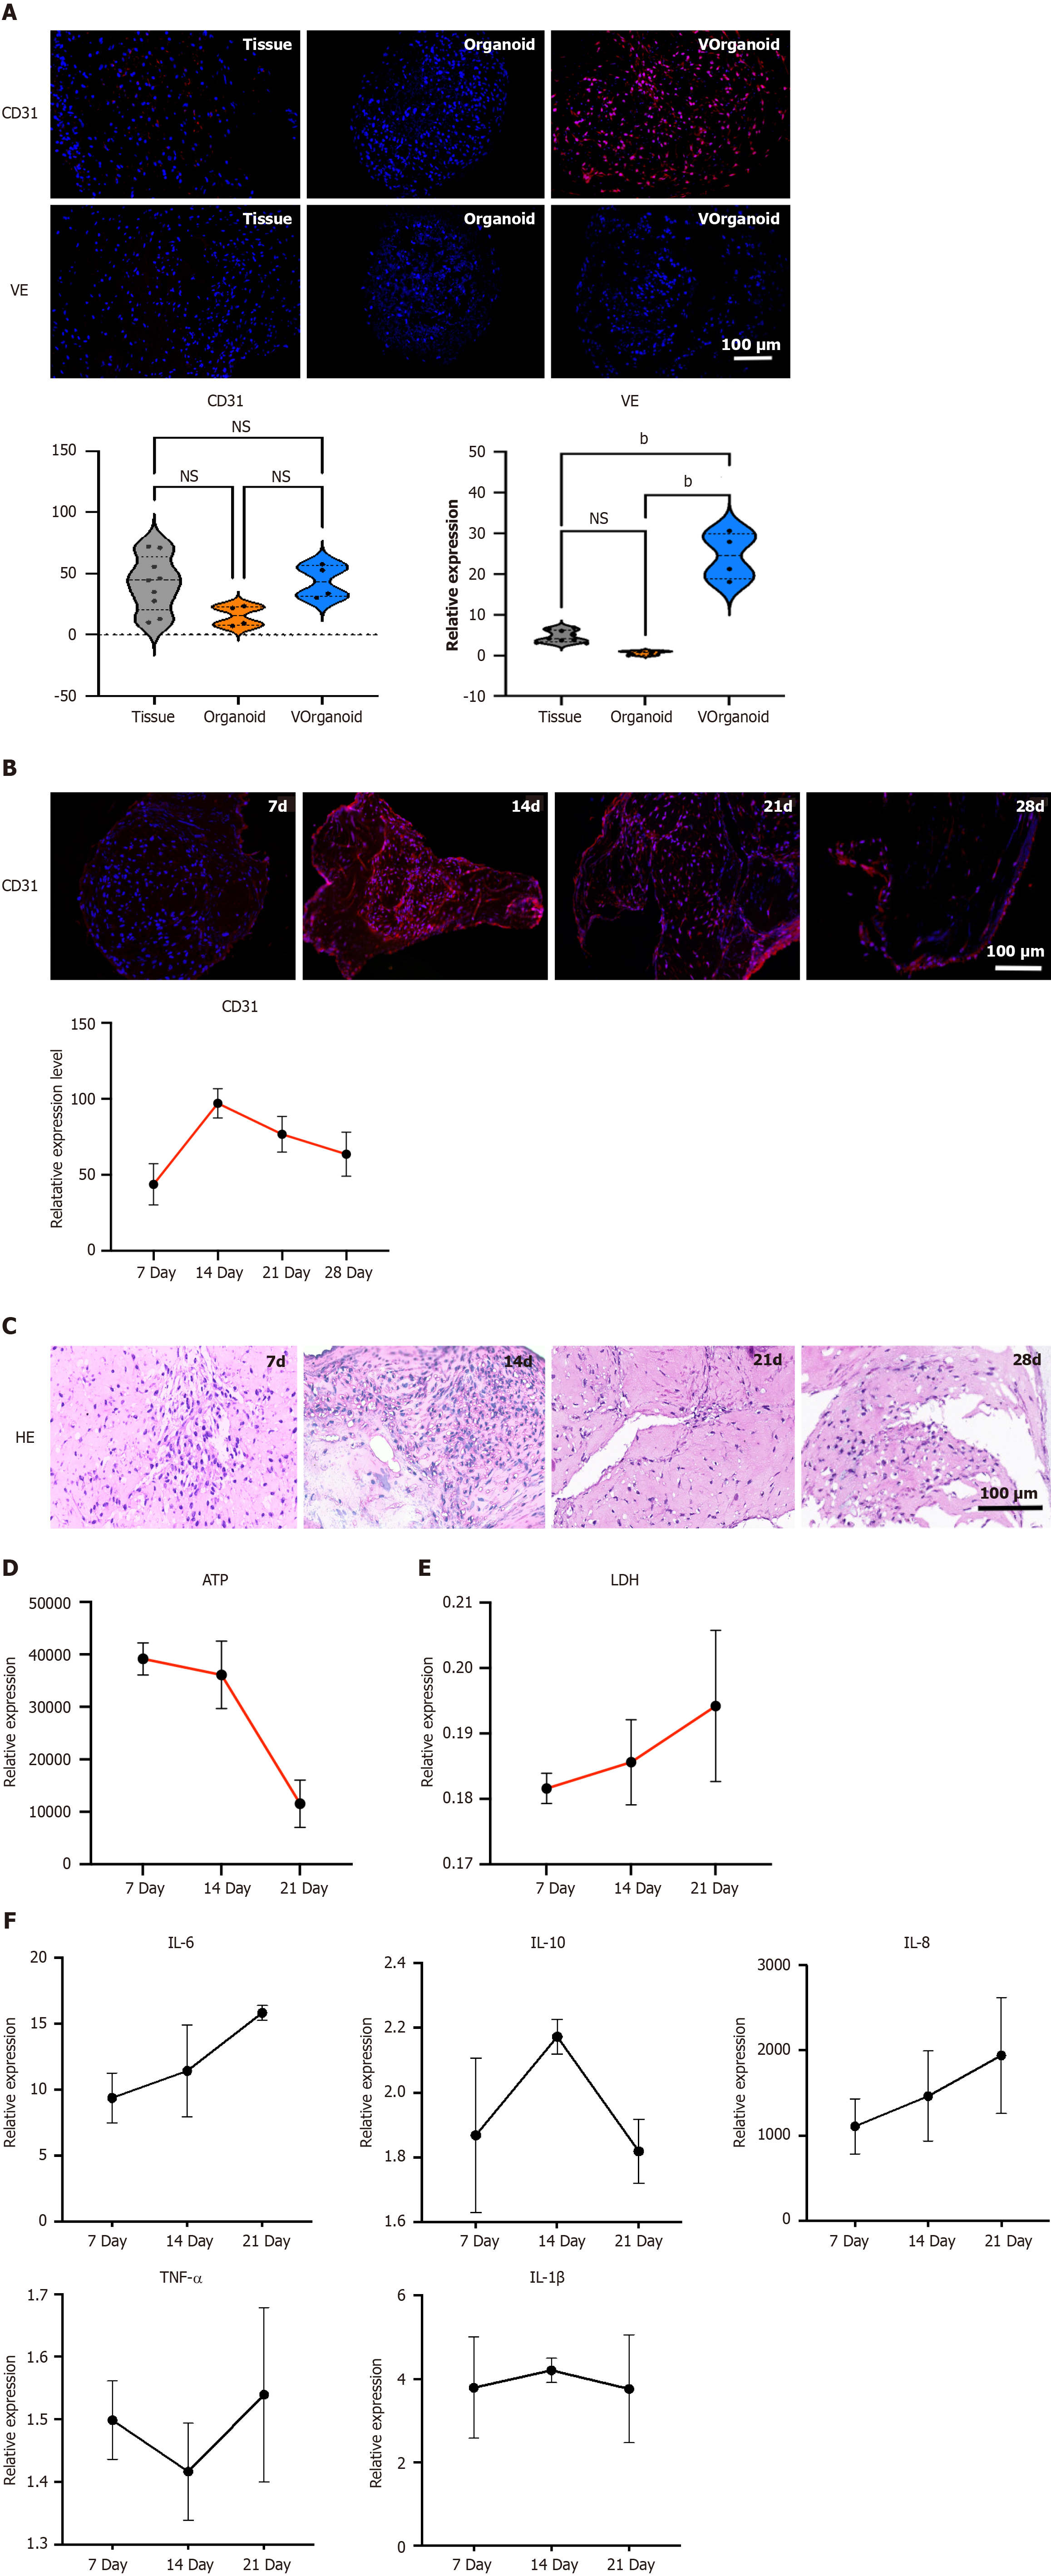
Figure 4 Morphological and functional identification of Vorganoids.
A: Immunofluorescence staining for vasculogenesis-related markers; B: CD31 expression pattern in Vorganoid cells during different culture durations; C: Morphological changes in Vorganoid cells during different culture durations; D and E: Analysis of adenosine triphosphate (D) and lactate dehydrogenase (E) levels in Vorganoids during different culture durations; F: Expression patterns of inflammatory markers in Vorganoids analysed via enzyme-linked immunosorbent assay. Significant difference between the groups, bP < 0.01, Scale bar = 100 μm. HE: Hematoxylin-eosin; ATP: Adenosine triphosphate; LDH: Lactate dehydrogenase; IL: Interleukin; TNF: Tumour necrosis factor; NS: Not significant.
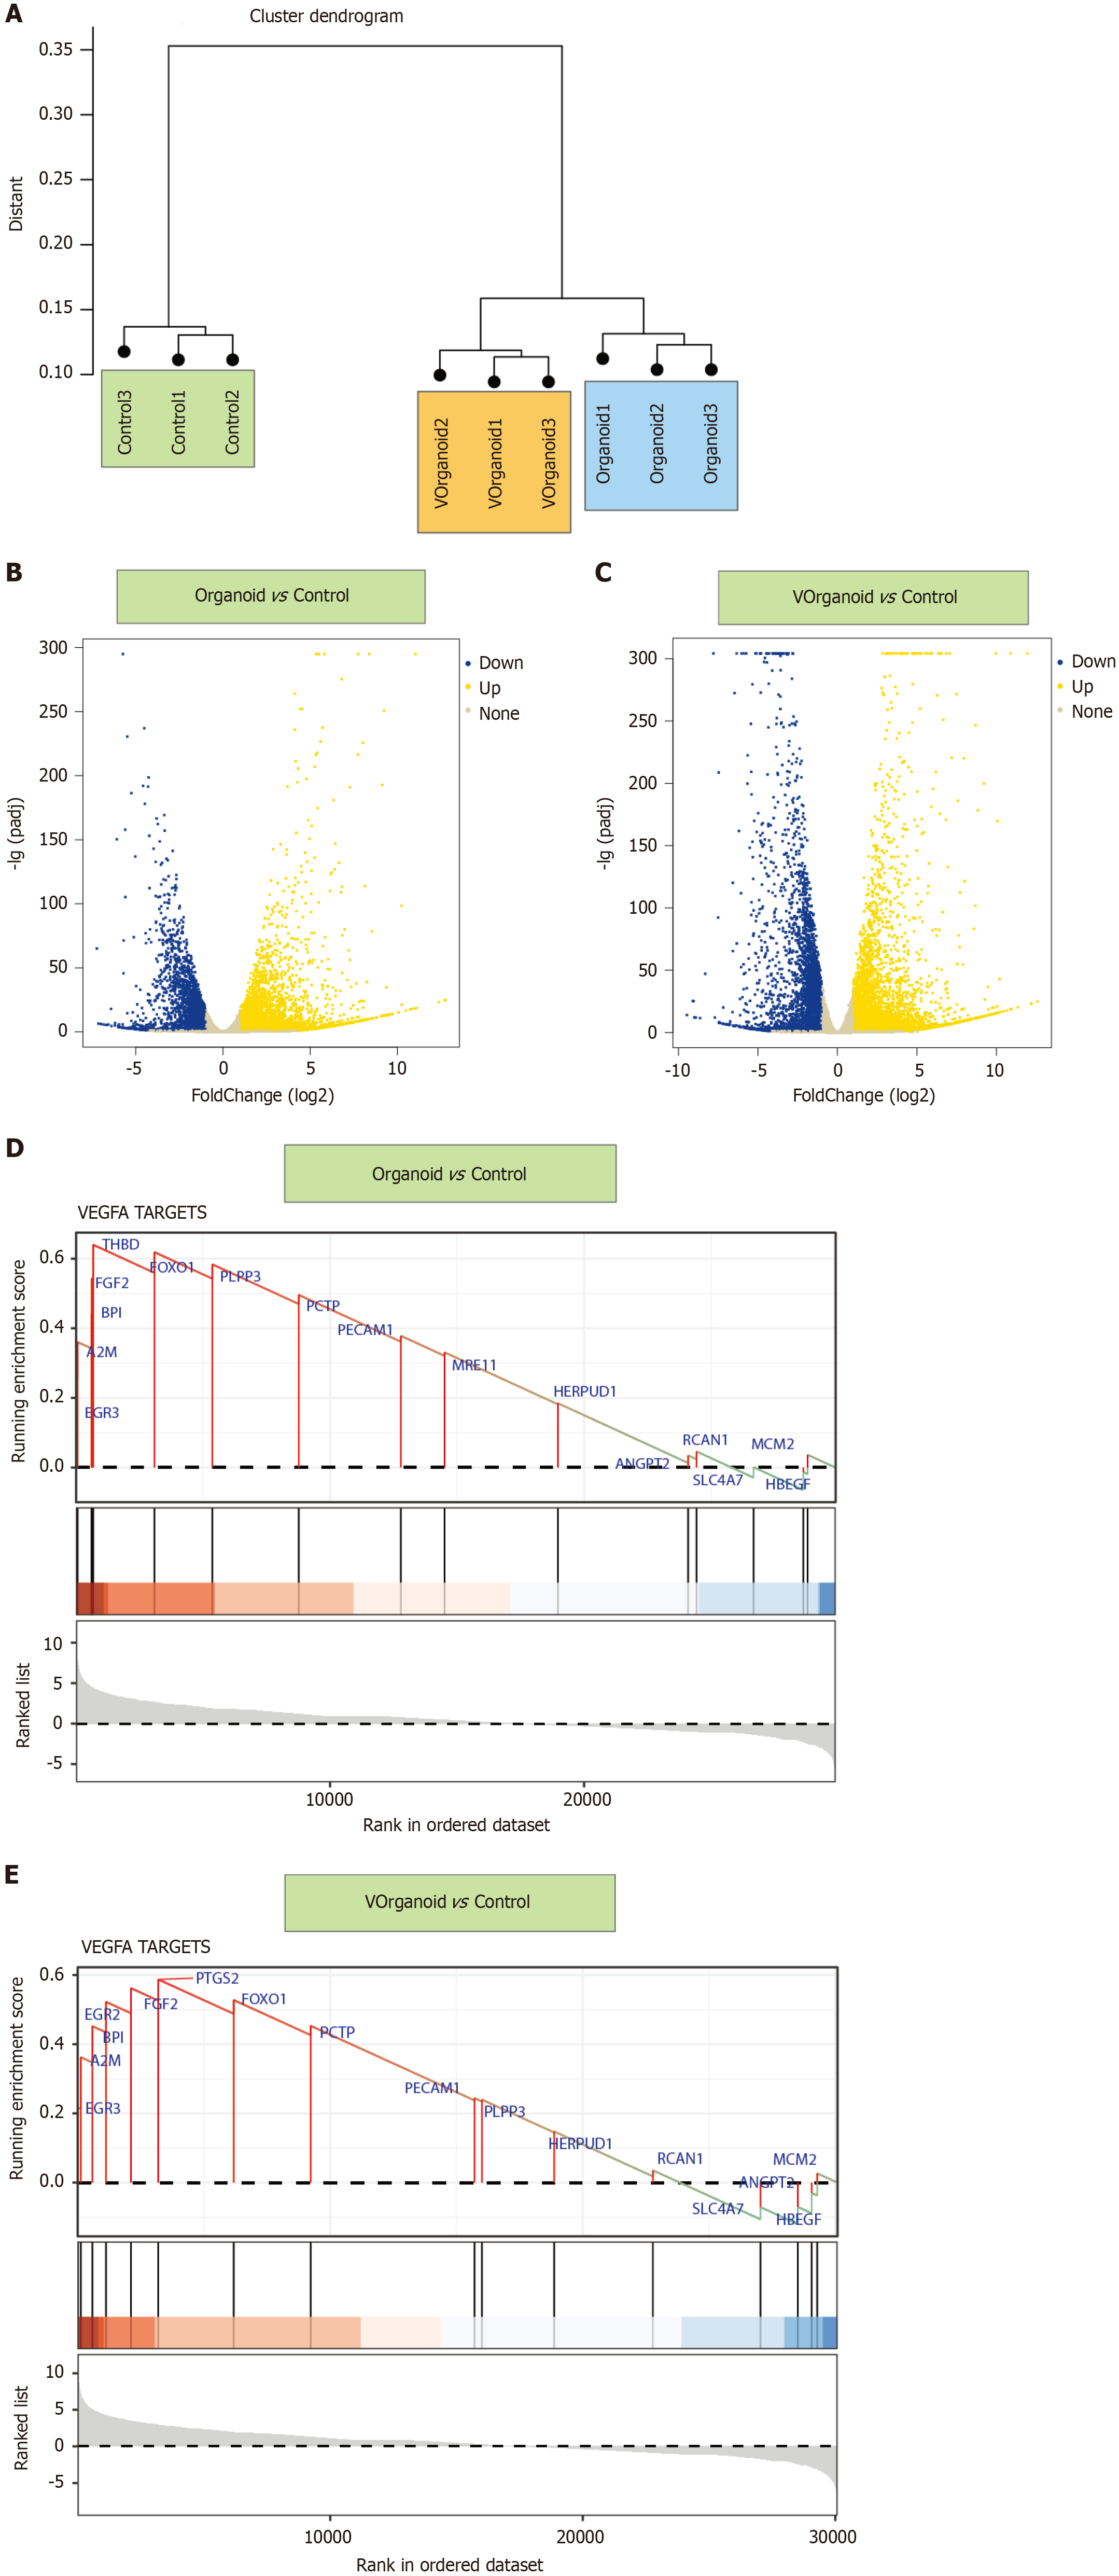
Figure 5 Functional enrichment analysis results for differentially expressed genes in the organoid vs control and Vorganoid vs control comparisons.
A: The sample cluster dendrogram of different states of dentin-pulp-like organoid development; B and C: Volcano map showing the differentially expressed genes identified via differential comparison of the organoid vs control (B) and Vorganoid vs control (C) groups; D and E: The vascular endothelial growth factor A targets identified by gene set enrichment analysis enrichment analysis in the organoid vs control (D) and Vorganoid vs control (E) groups. VEGFA: Vascular endothelial growth factor A.
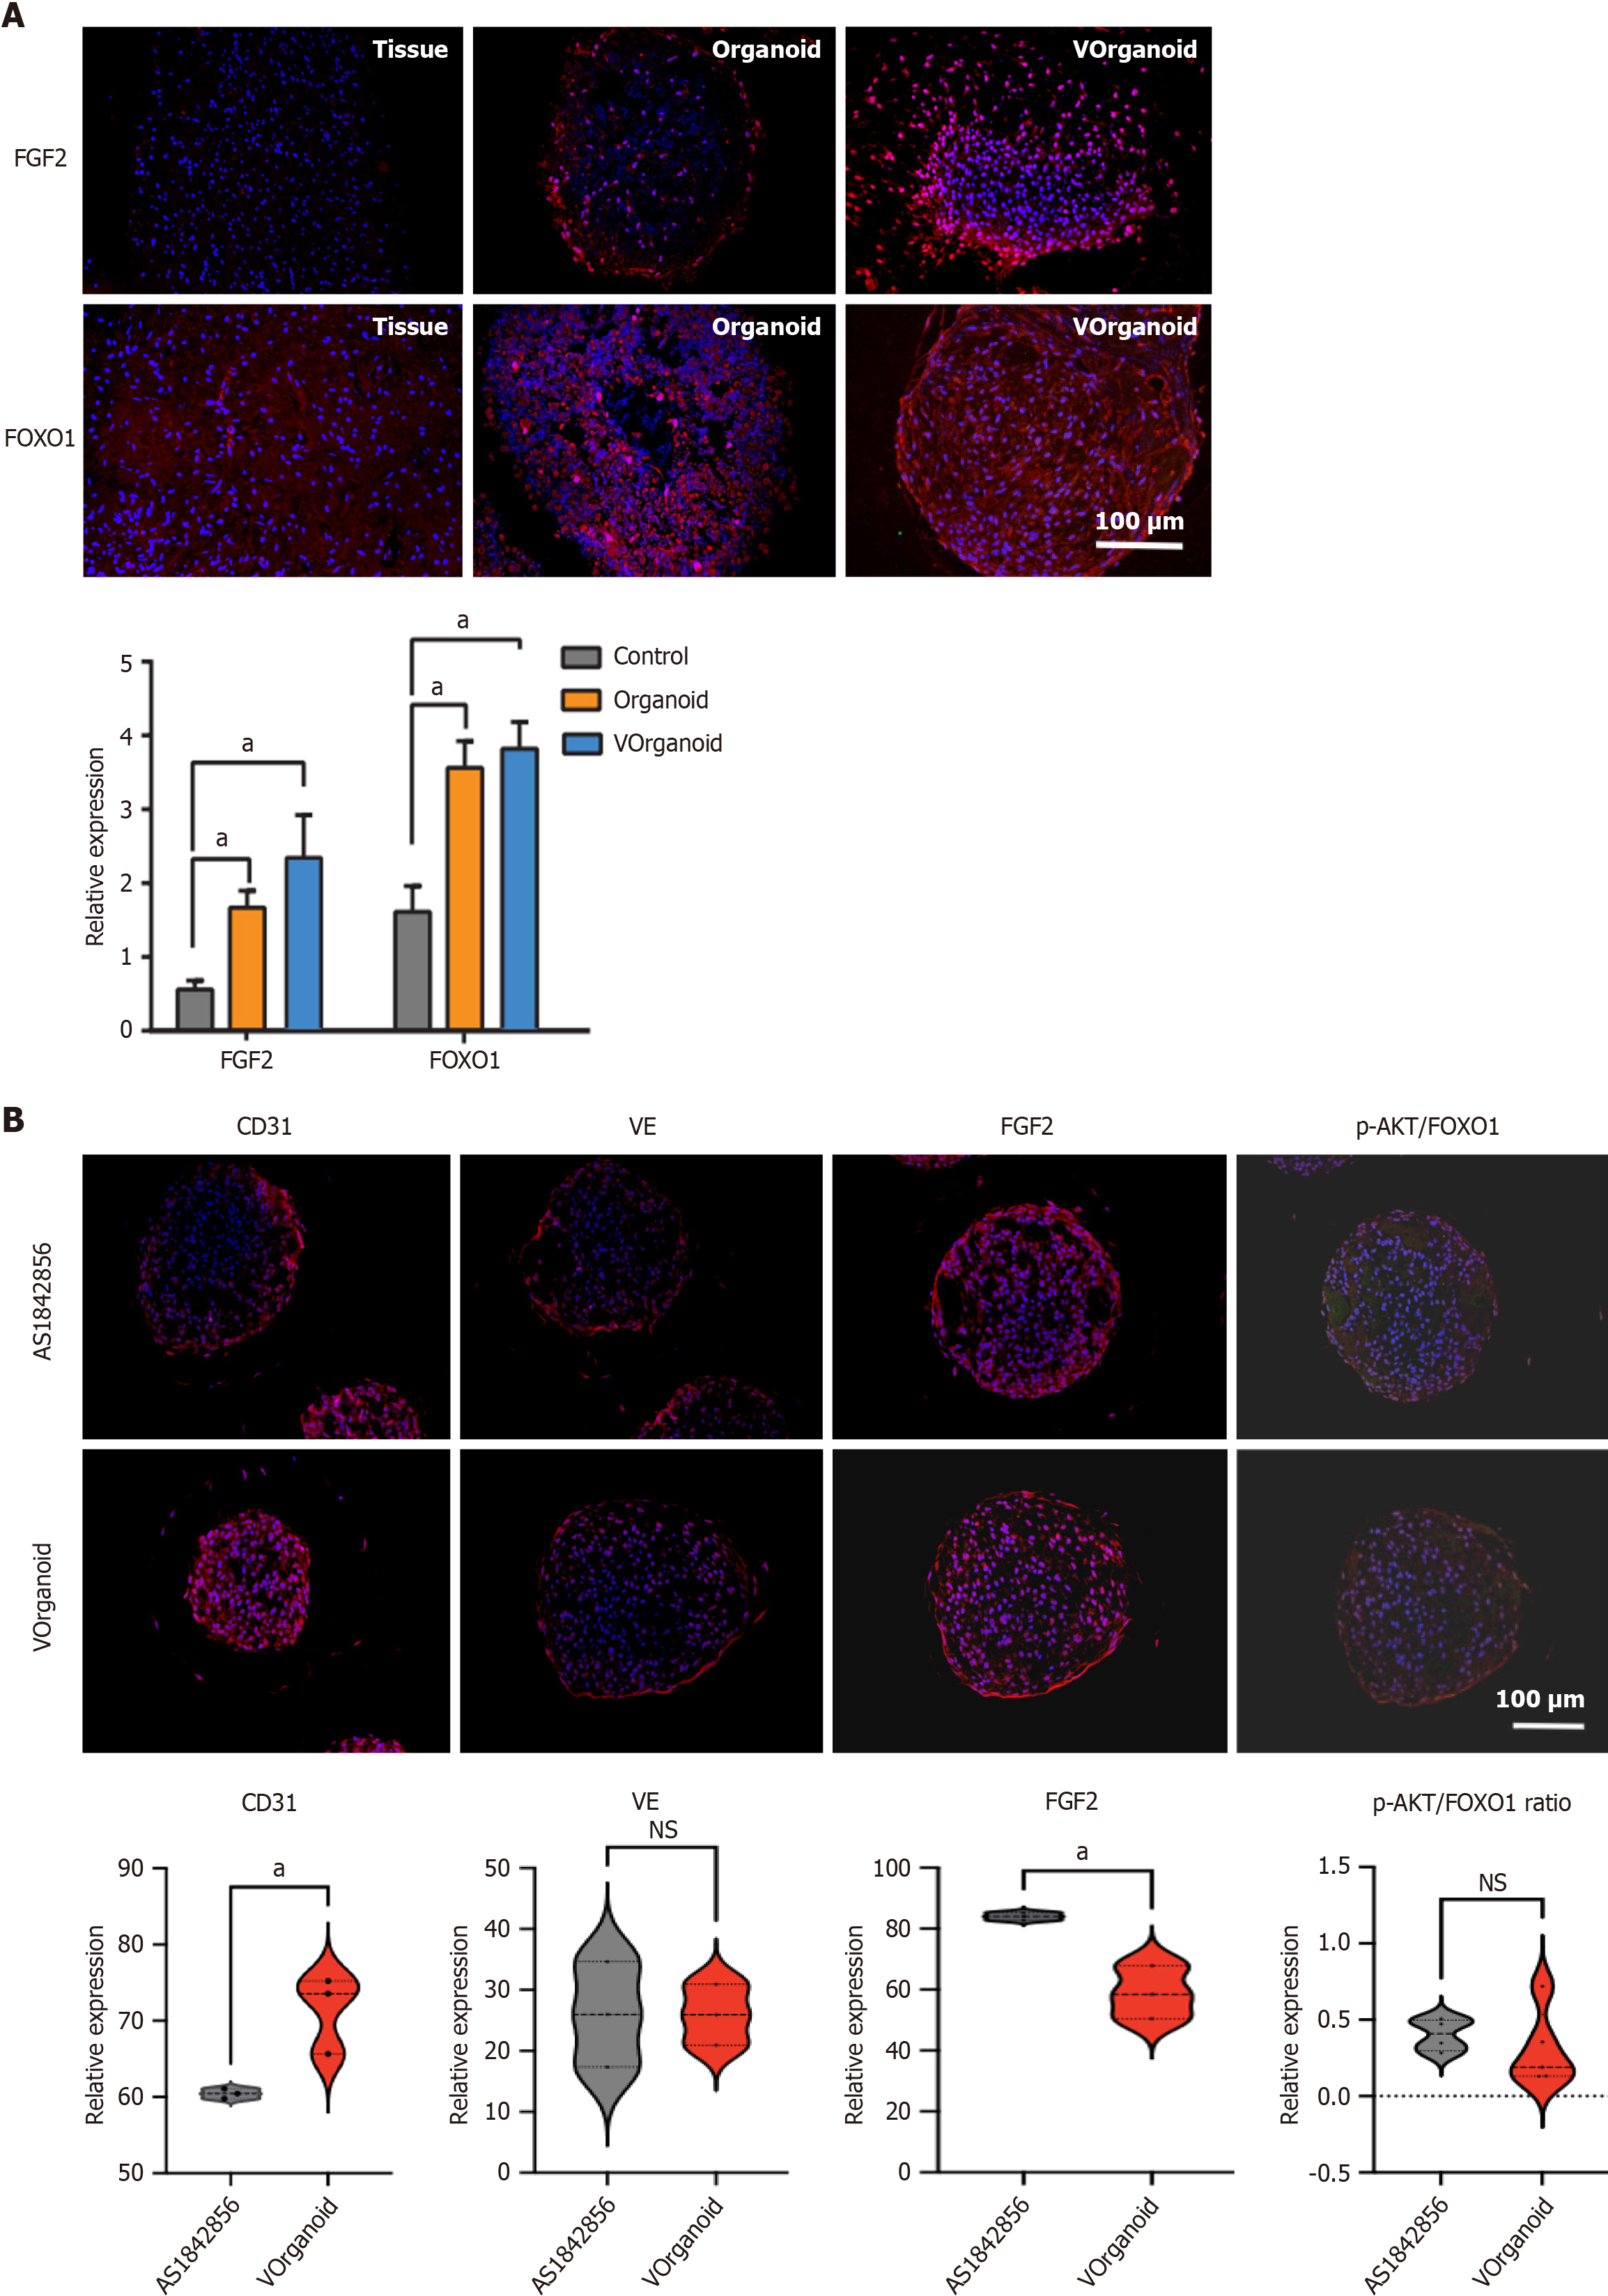
Figure 6 Target gene identification and validation.
A and B: Immunofluorescence staining and quantification. Significant difference between the groups, aP < 0.05. Scale bar = 100 μm. FGF2: Fibroblast growth factor 2; FOXO1: Forkhead box protein O1; NS: Not significant.
Figure 7 Generation of Vorganoids through differentiated human dental pulp stem cell assembly.
hDPSCs: Human dental pulp stem cells; CM: Conditioned medium; FOXO1: Forkhead box protein O1.
- Citation: Liu F, Xiao J, Chen LH, Pan YY, Tian JZ, Zhang ZR, Bai XC. Self-assembly of differentiated dental pulp stem cells facilitates spheroid human dental organoid formation and prevascularization. World J Stem Cells 2024; 16(3): 287-304
- URL: https://www.wjgnet.com/1948-0210/full/v16/i3/287.htm
- DOI: https://dx.doi.org/10.4252/wjsc.v16.i3.287


