Copyright
©The Author(s) 2024.
World J Stem Cells. Mar 26, 2024; 16(3): 267-286
Published online Mar 26, 2024. doi: 10.4252/wjsc.v16.i3.267
Published online Mar 26, 2024. doi: 10.4252/wjsc.v16.i3.267
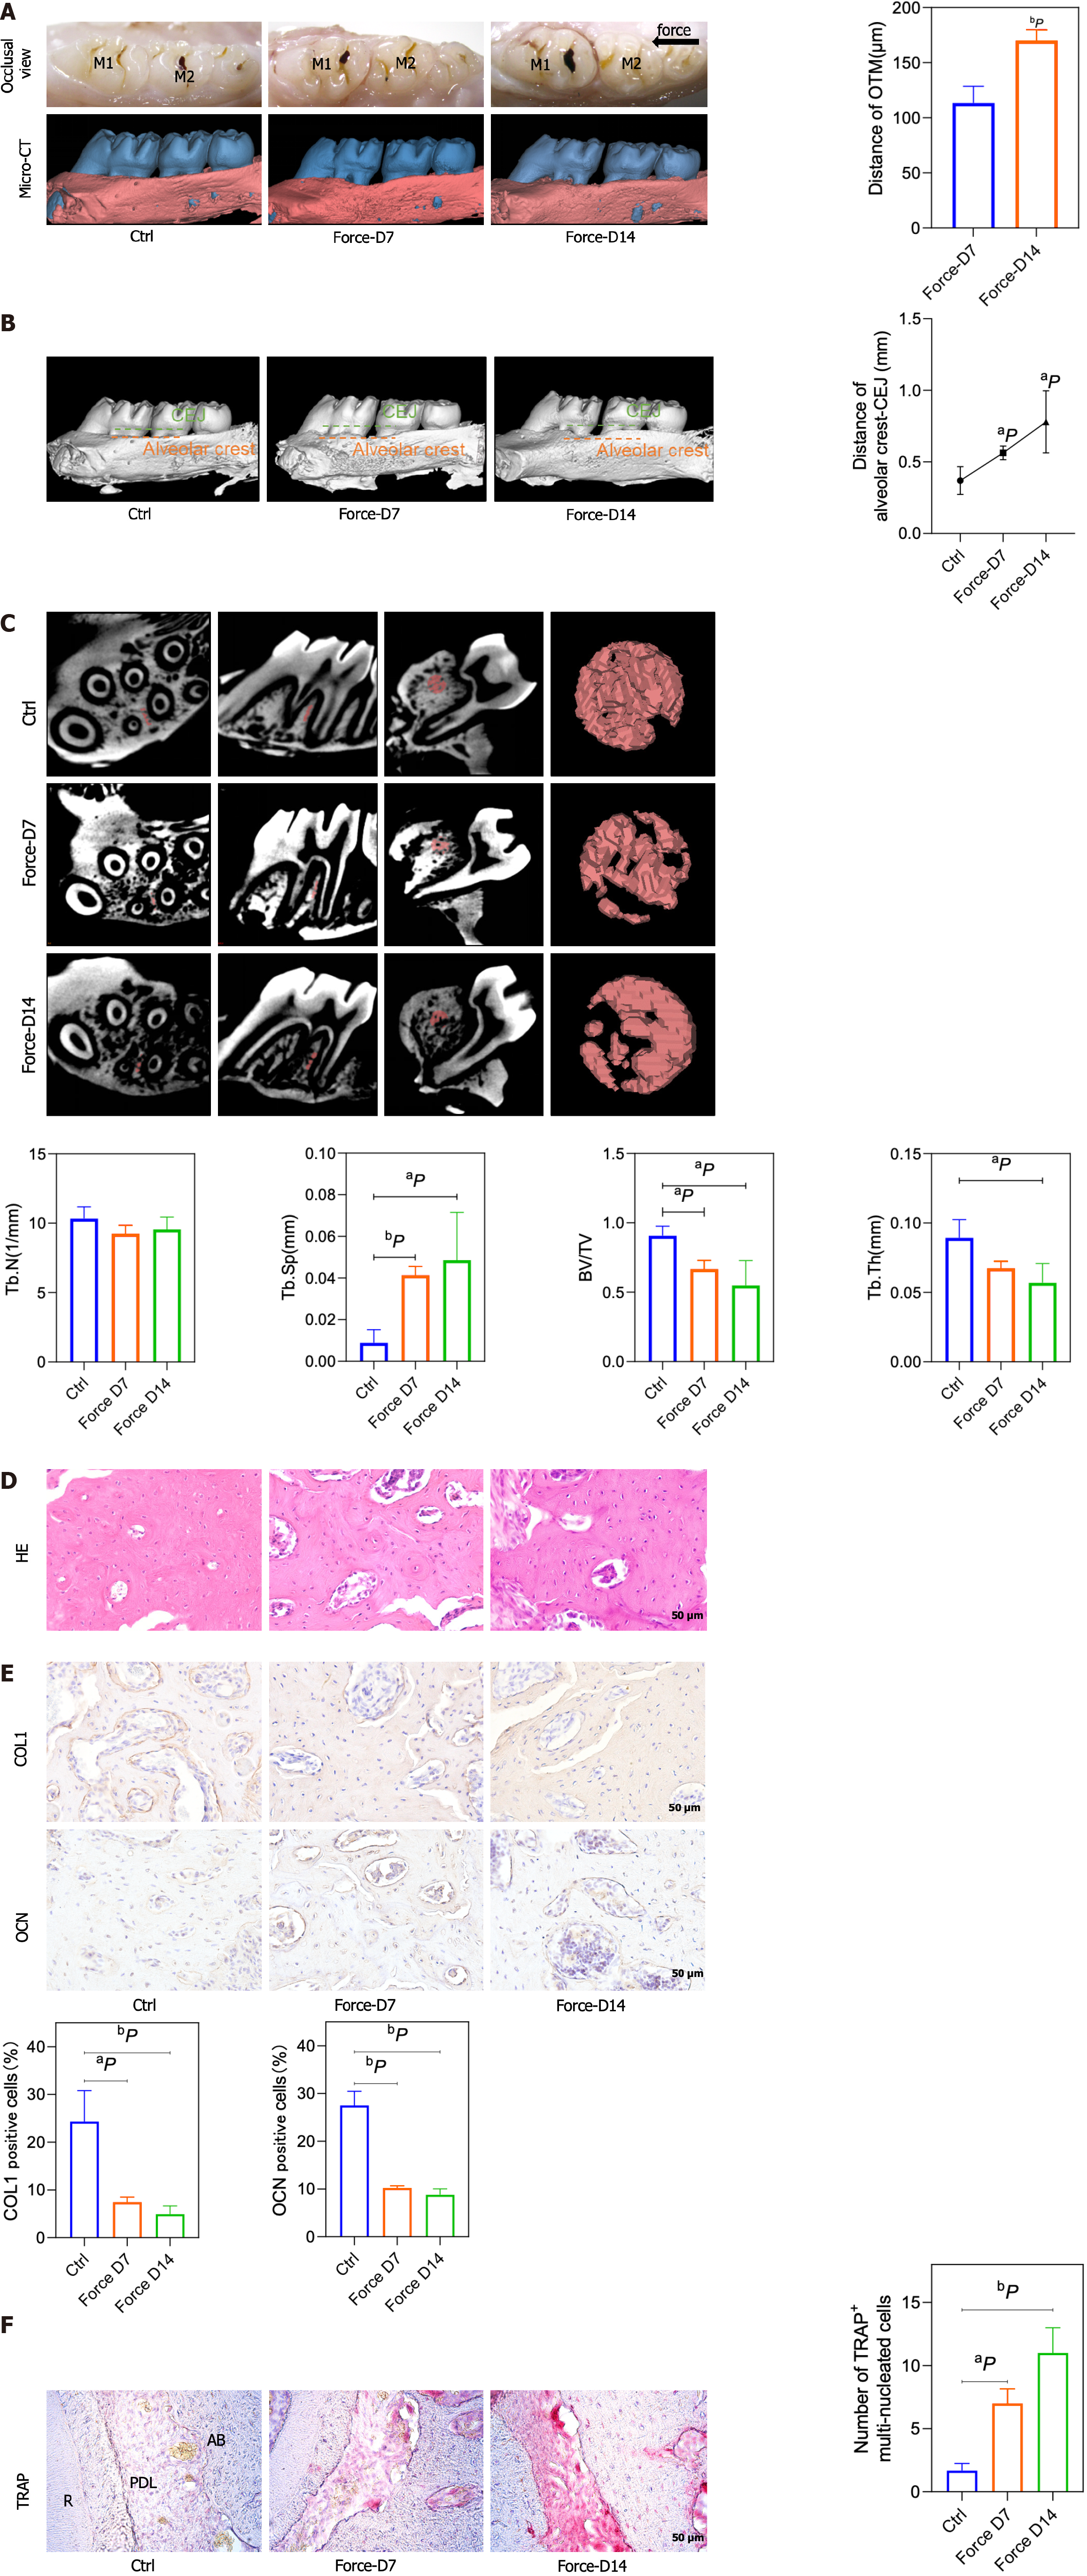
Figure 1 The bone density decreased, and the alveolar bone height decreased on the compression side.
A: Representative pictures of the rat tooth movement model and 3D model images reconstructed with Mimics software (left) and the statistical diagram of the tooth movement distance (right); B: Representative images of 3D models reconstructed from micro-computed tomography images showing the distance from the alveolar crest to the cemento-enamel junction (left) and the corresponding statistical analysis (right); C: Representative region of interest (ROI) selection diagrams (left) and statistical analysis (right). A certain volume of alveolar bone on the compressed side of the middle 1/2 root of the distal buccal root of the first molar was selected for subsequent analysis. The statistical analysis of the BV/TV, Tb.Th, Tb.N, Tb.Sp and BS/BV values of the ROI region was performed with Siemens software; D: Representative images of hematoxylin and eosin staining; E: Representative images of immunohistochemical staining for type 1 collagen and osteocalcin (left) and quantitative analyses (right); F: Representative images of tartrate-resistant acid phosphatase (TRAP) staining (left) and counting of TRAP-positive multinuclear (> 3 nuclei) cells (right). aP < 0.05 vs control group, bP < 0.01 vs control group. CEJ: Cementum-enamel boundary; HE: Hematoxylin and eosin; TRAP: Tartrate-resistant acid phosphatase; COL1: Type 1 collagen; OCN: Osteocalcin; CT: Computed tomography.
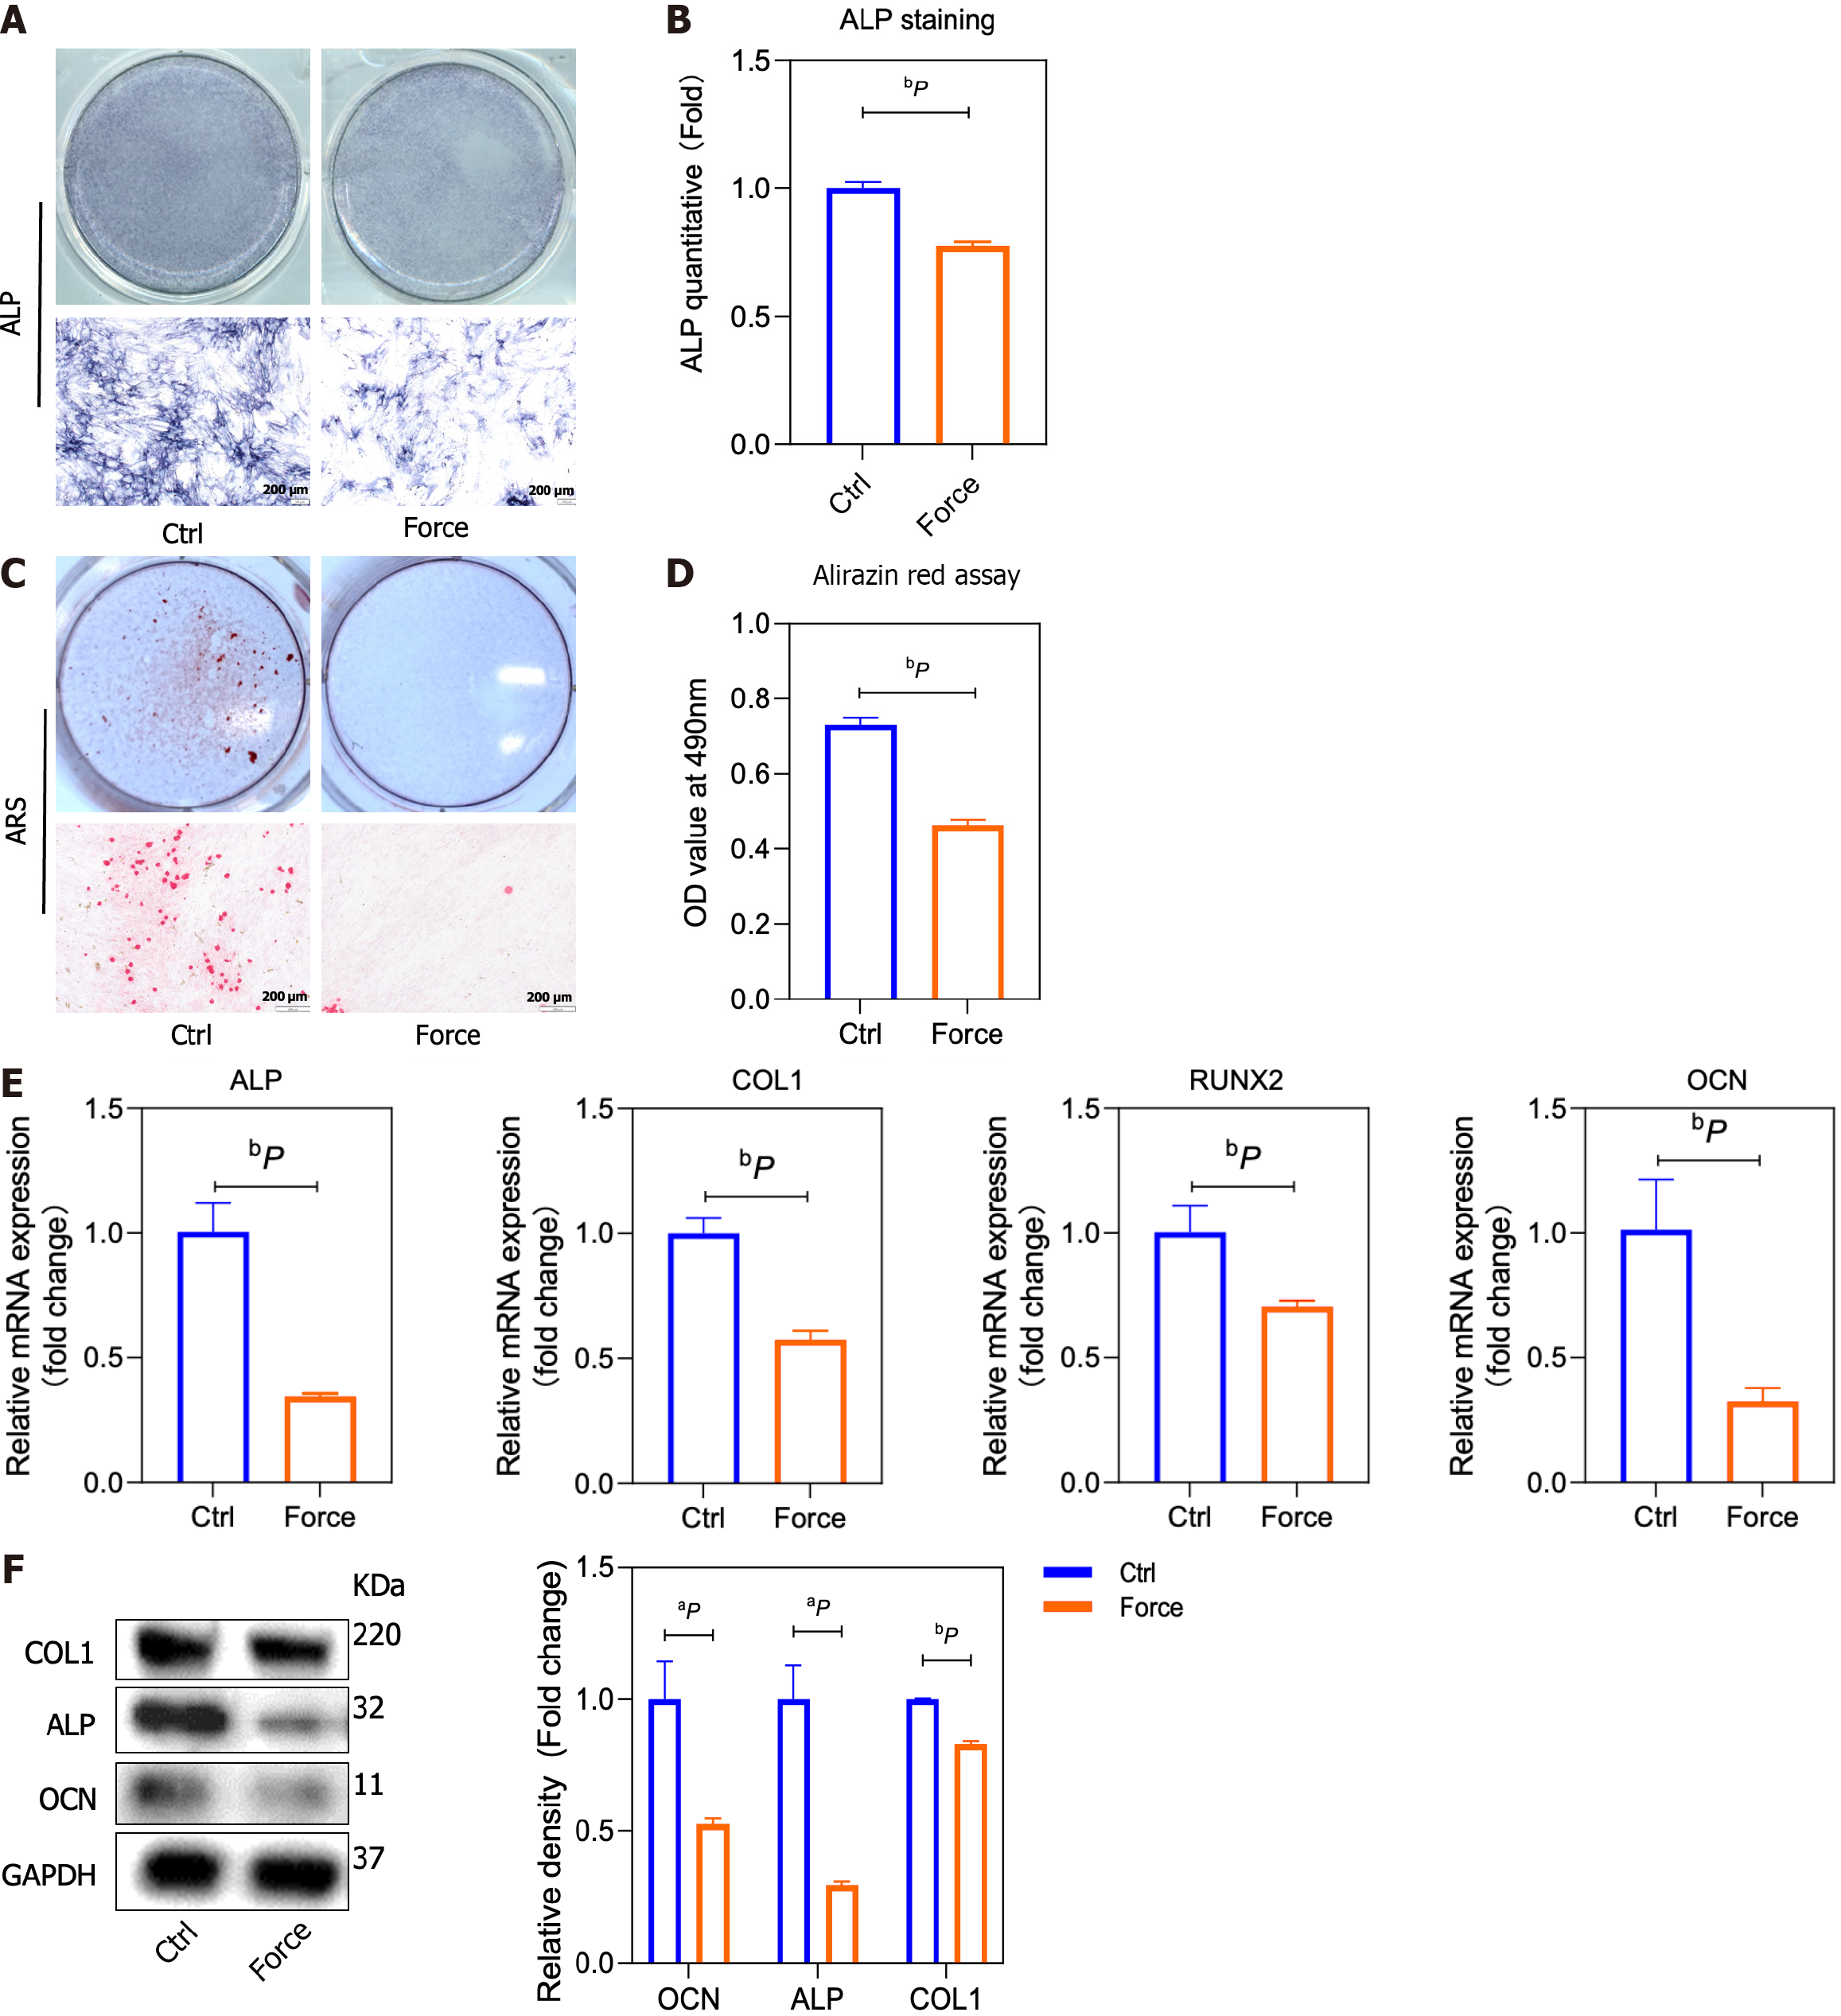
Figure 2 Static pressure inhibits the osteogenic differentiation of bone marrow mesenchymal stem cells in vitro.
A and B: Representative alkaline phosphatase (ALP) staining images and statistical analysis; C and D: Representative alizarin red staining images and quantitative data from the alirazin red assay; E: mRNA expression of ALP, type 1 collagen (COL1), runt-related transcription factor 2, and osteocalcin (OCN) folded to control group by quantitative reverse transcription-polymerase chain reaction; F: COL1, ALP, and OCN protein expression in bone marrow mesenchymal stem cells analyzed by Western blotting (left), and the band intensities measured with ImageJ software (right). aP < 0.05 vs control group, bP < 0.01 vs control group. ALP: Alkaline phosphatase; RUNX2: Runt-related transcription factor 2; COL1: Type 1 collagen; OCN: Osteocalcin; ARS: Alizarin red staining.
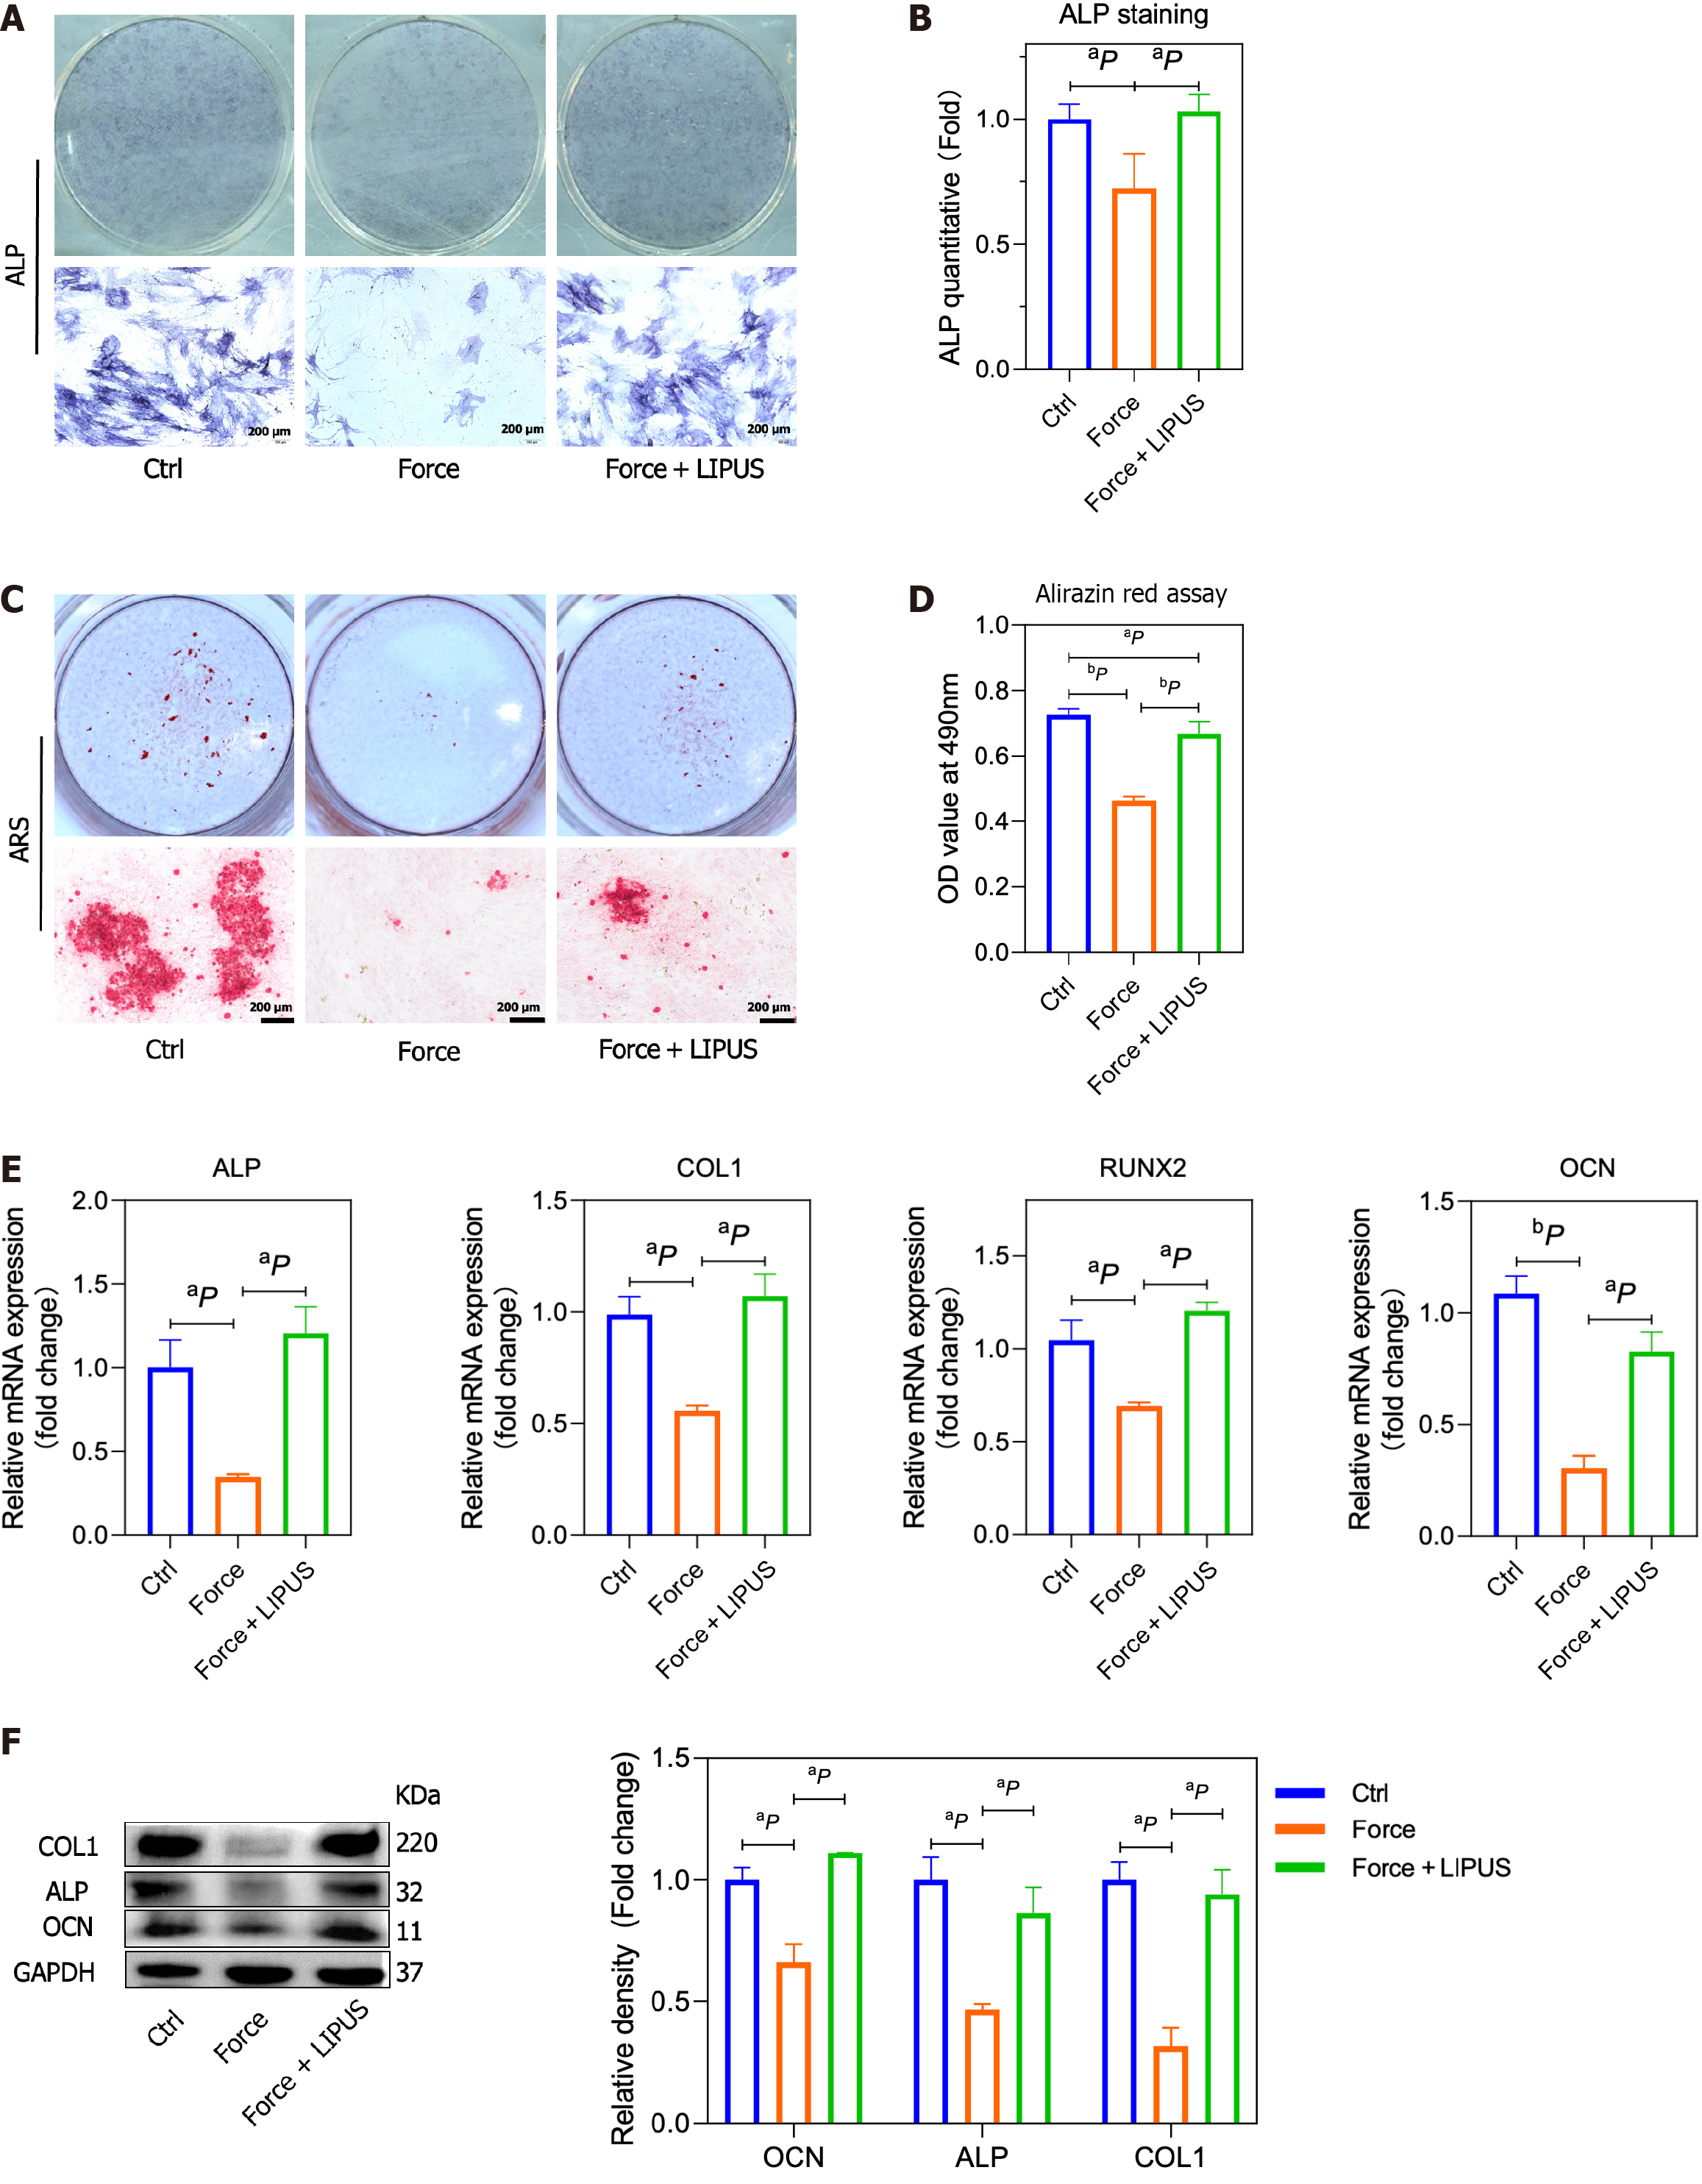
Figure 3 Low-intensity pulsed ultrasound promotes the osteogenesis of bone marrow mesenchymal stem cells.
A and B: Representative alkaline phosphatase (ALP) staining images and statistical analysis; C and D: Representative alizarin red staining images and quantitative data from the alirazin red assay; E: mRNA expression of ALP, type 1 collagen (COL1), runt-related transcription factor 2, and osteocalcin (OCN) folded to control group by quantitative reverse transcription-polymerase chain reaction; F: COL1, ALP, and OCN protein expression in rat alveolar bone tissues analyzed via Western blotting (left), and the band intensities measured via ImageJ software (right). aP < 0.05 vs control group, bP < 0.01 vs control group. ALP: Alkaline phosphatase; RUNX2: Runt-related transcription factor 2; COL1: Type 1 collagen; OCN: Osteocalcin; LIPUS: Low-intensity pulsed ultrasound; ARS: Alizarin red staining.
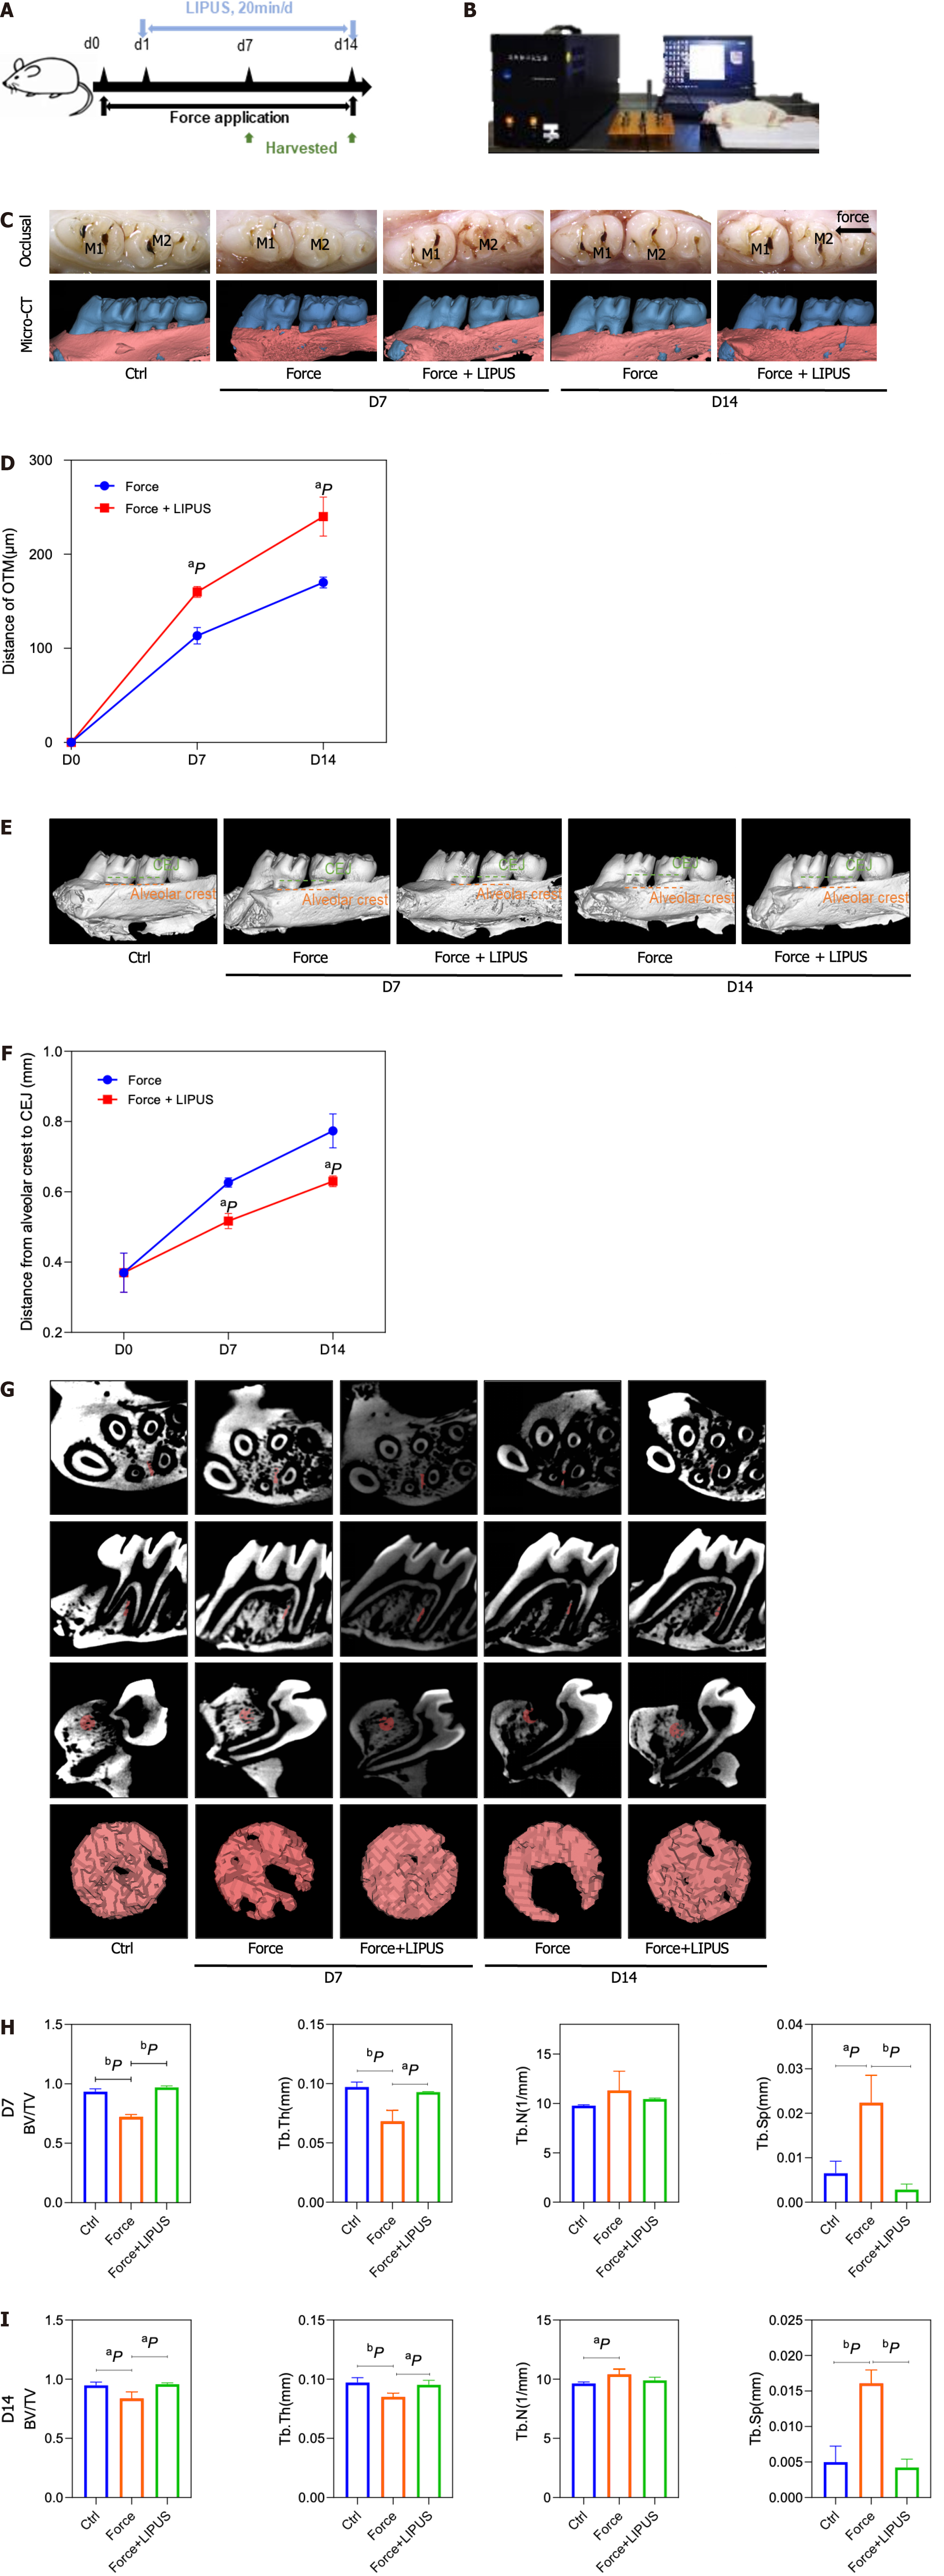
Figure 4 Low-intensity pulsed ultrasound accelerates tooth movement, inhibits alveolar bone resorption, and promotes bone formation.
A: Schematic diagram of the animal experiment procedure. The orthodontic tooth movement model was established on day 0. From day 1 to the end point, the force + low-intensity pulsed ultrasound (LIPUS) group was stimulated with LIPUS for 20 min every day until the samples were harvested on days 7 and 14; B: Schematic representation of LIPUS stimulating the maxillary first molar at the corresponding position on the buccal side; C-F: Representative images (C) and 3D reconstructed model images (E). Tooth movement distances (D) and distances from the alveolar crest to the cementum-enamel boundary (F) were measured with Mimics software; G-I: Representative region of interest (ROI) region selection diagrams and statistical analysis of the BV/TV, Tb.Th, Tb.N, Tb.Sp, and BS/BV values of the ROI. aP < 0.05 vs control group, bP < 0.01 vs control group. CT: Computed tomography; LIPUS: Low-intensity pulsed ultrasound.
Figure 5 Low-intensity pulsed ultrasound promotes bone formation.
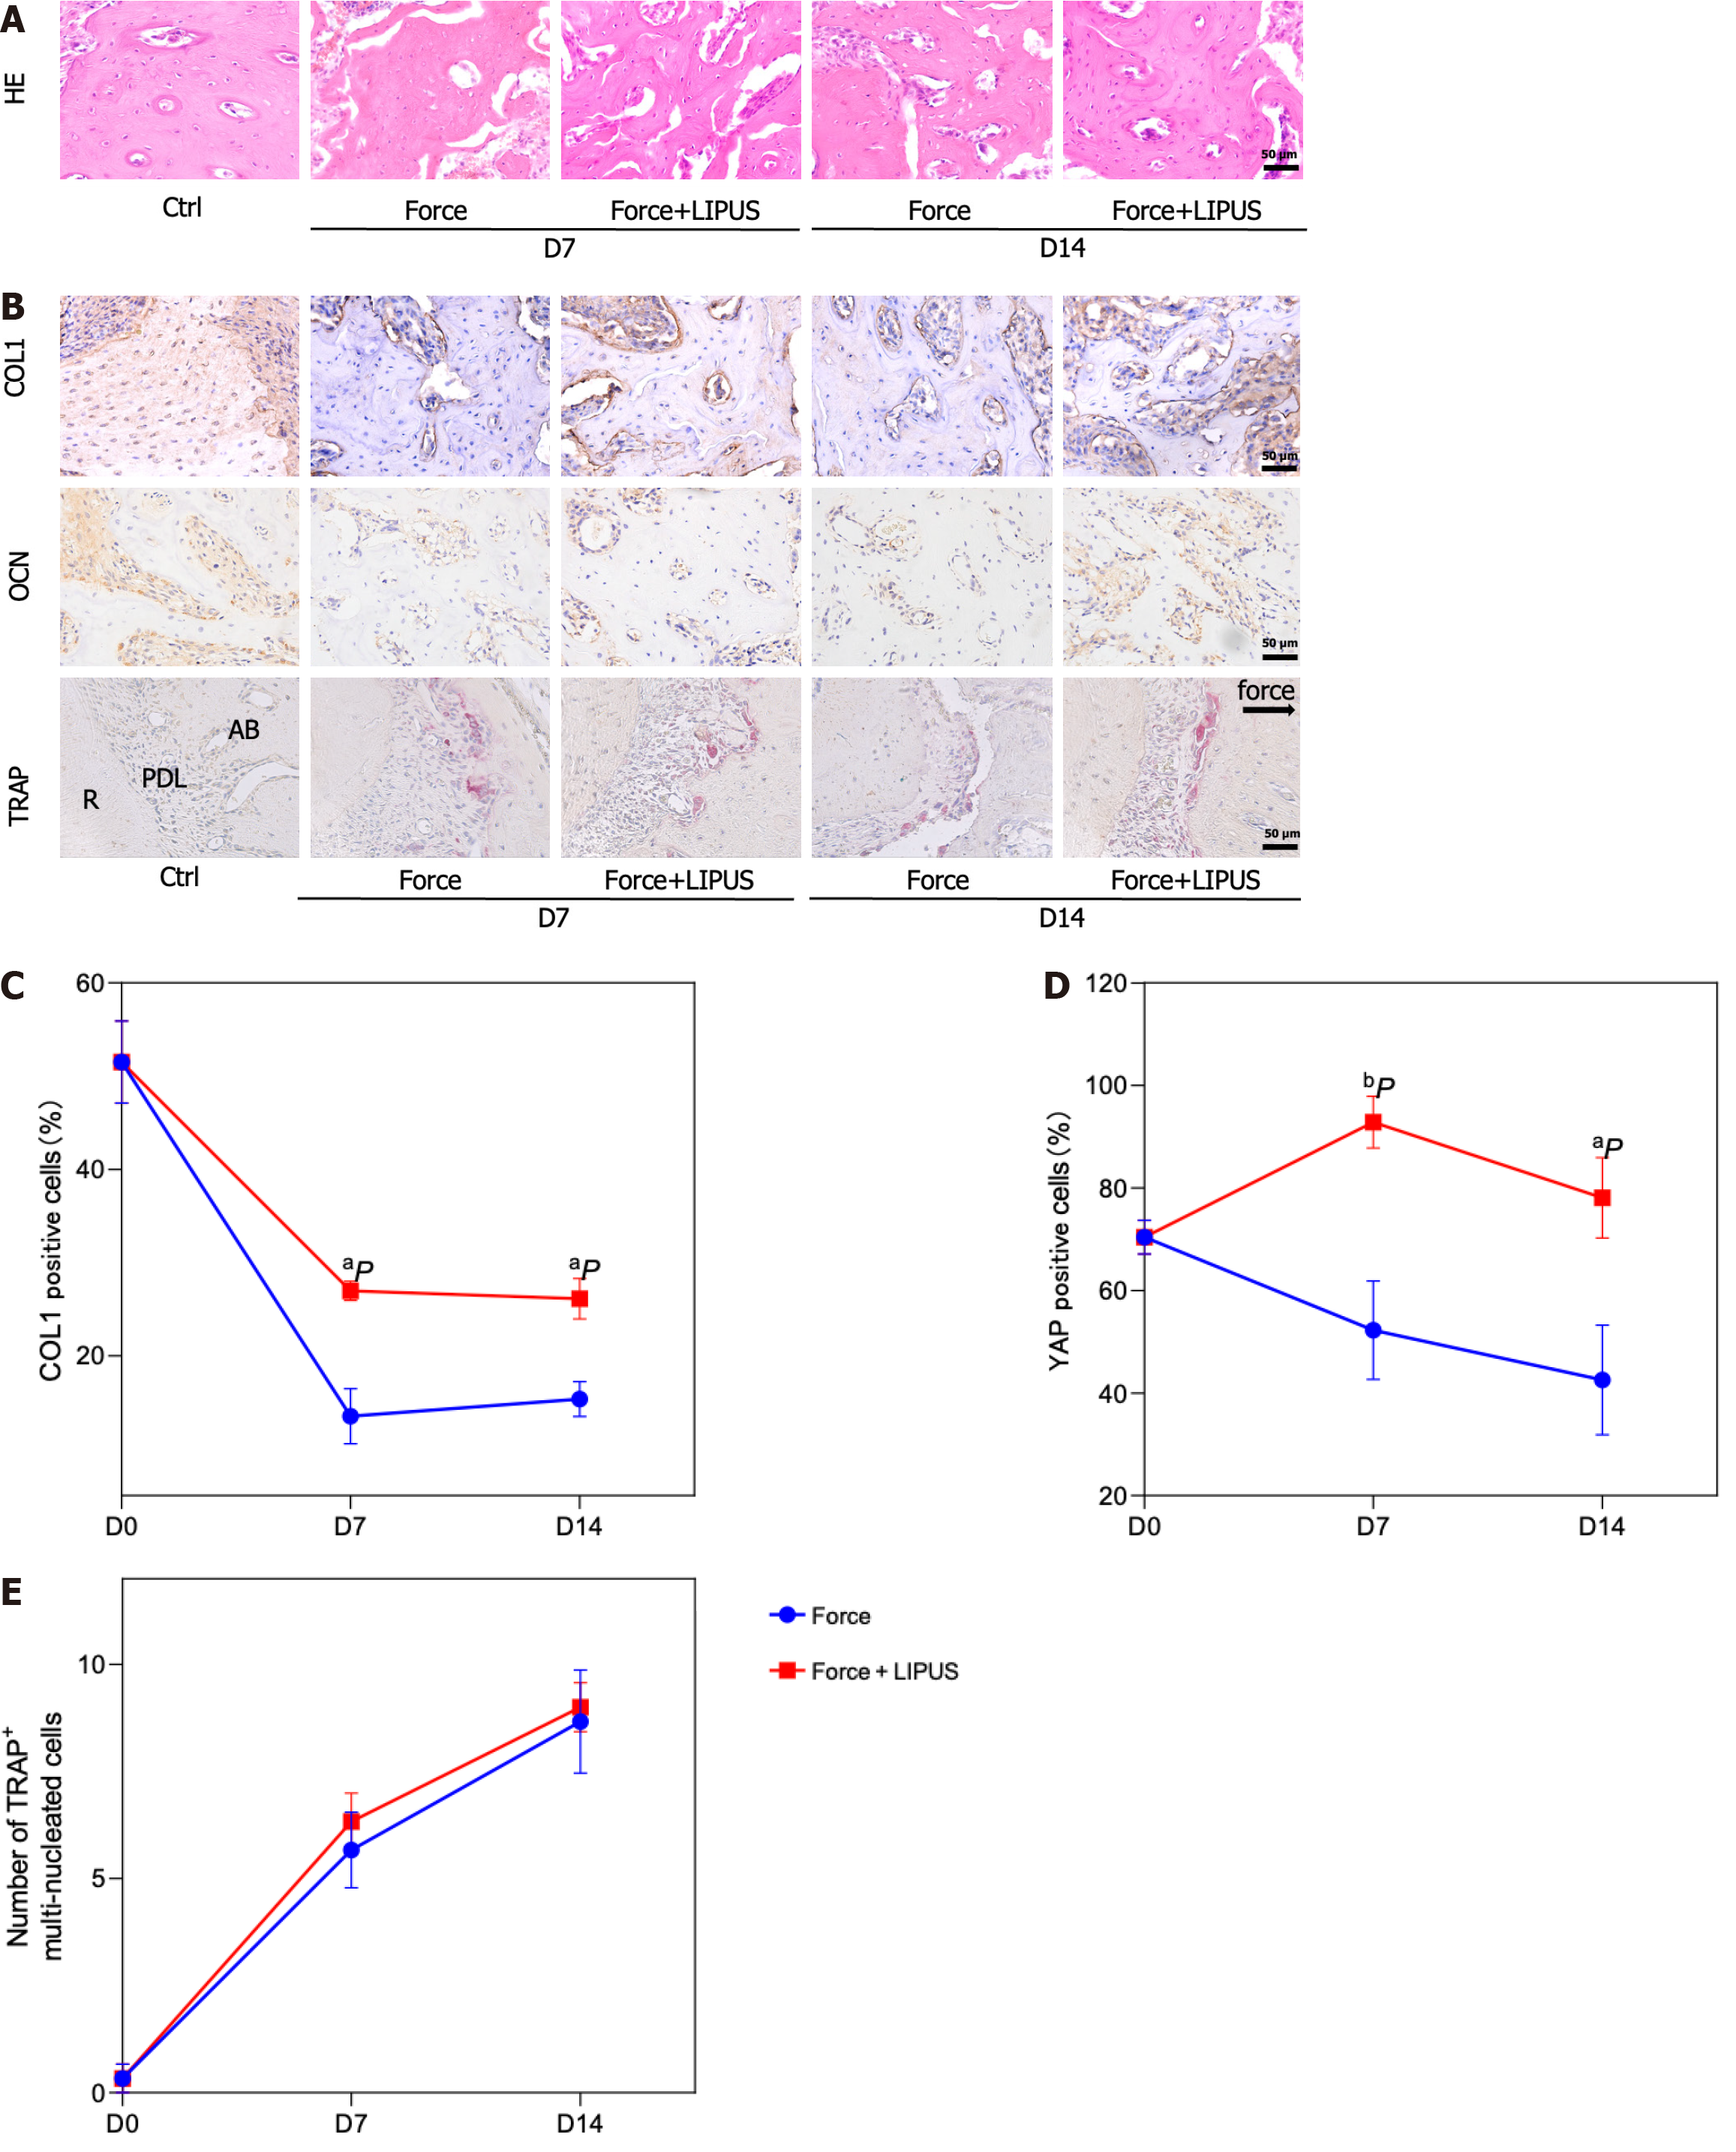
A: Representative images of hematoxylin and eosin staining; B: Representative images of immunohistochemical staining for type 1 collagen and osteocalcin and tartrate-resistant acid phosphatase staining (TRAP); C-E: Statistical analyses of the immunohistochemical staining and TRAP staining results. aP < 0.05 vs control group, bP < 0.01 vs control group. HE: Hematoxylin and eosin; TRAP: Tartrate-resistant acid phosphatase; COL1: Type 1 collagen; OCN: Osteocalcin; LIPUS: Low-intensity pulsed ultrasound.
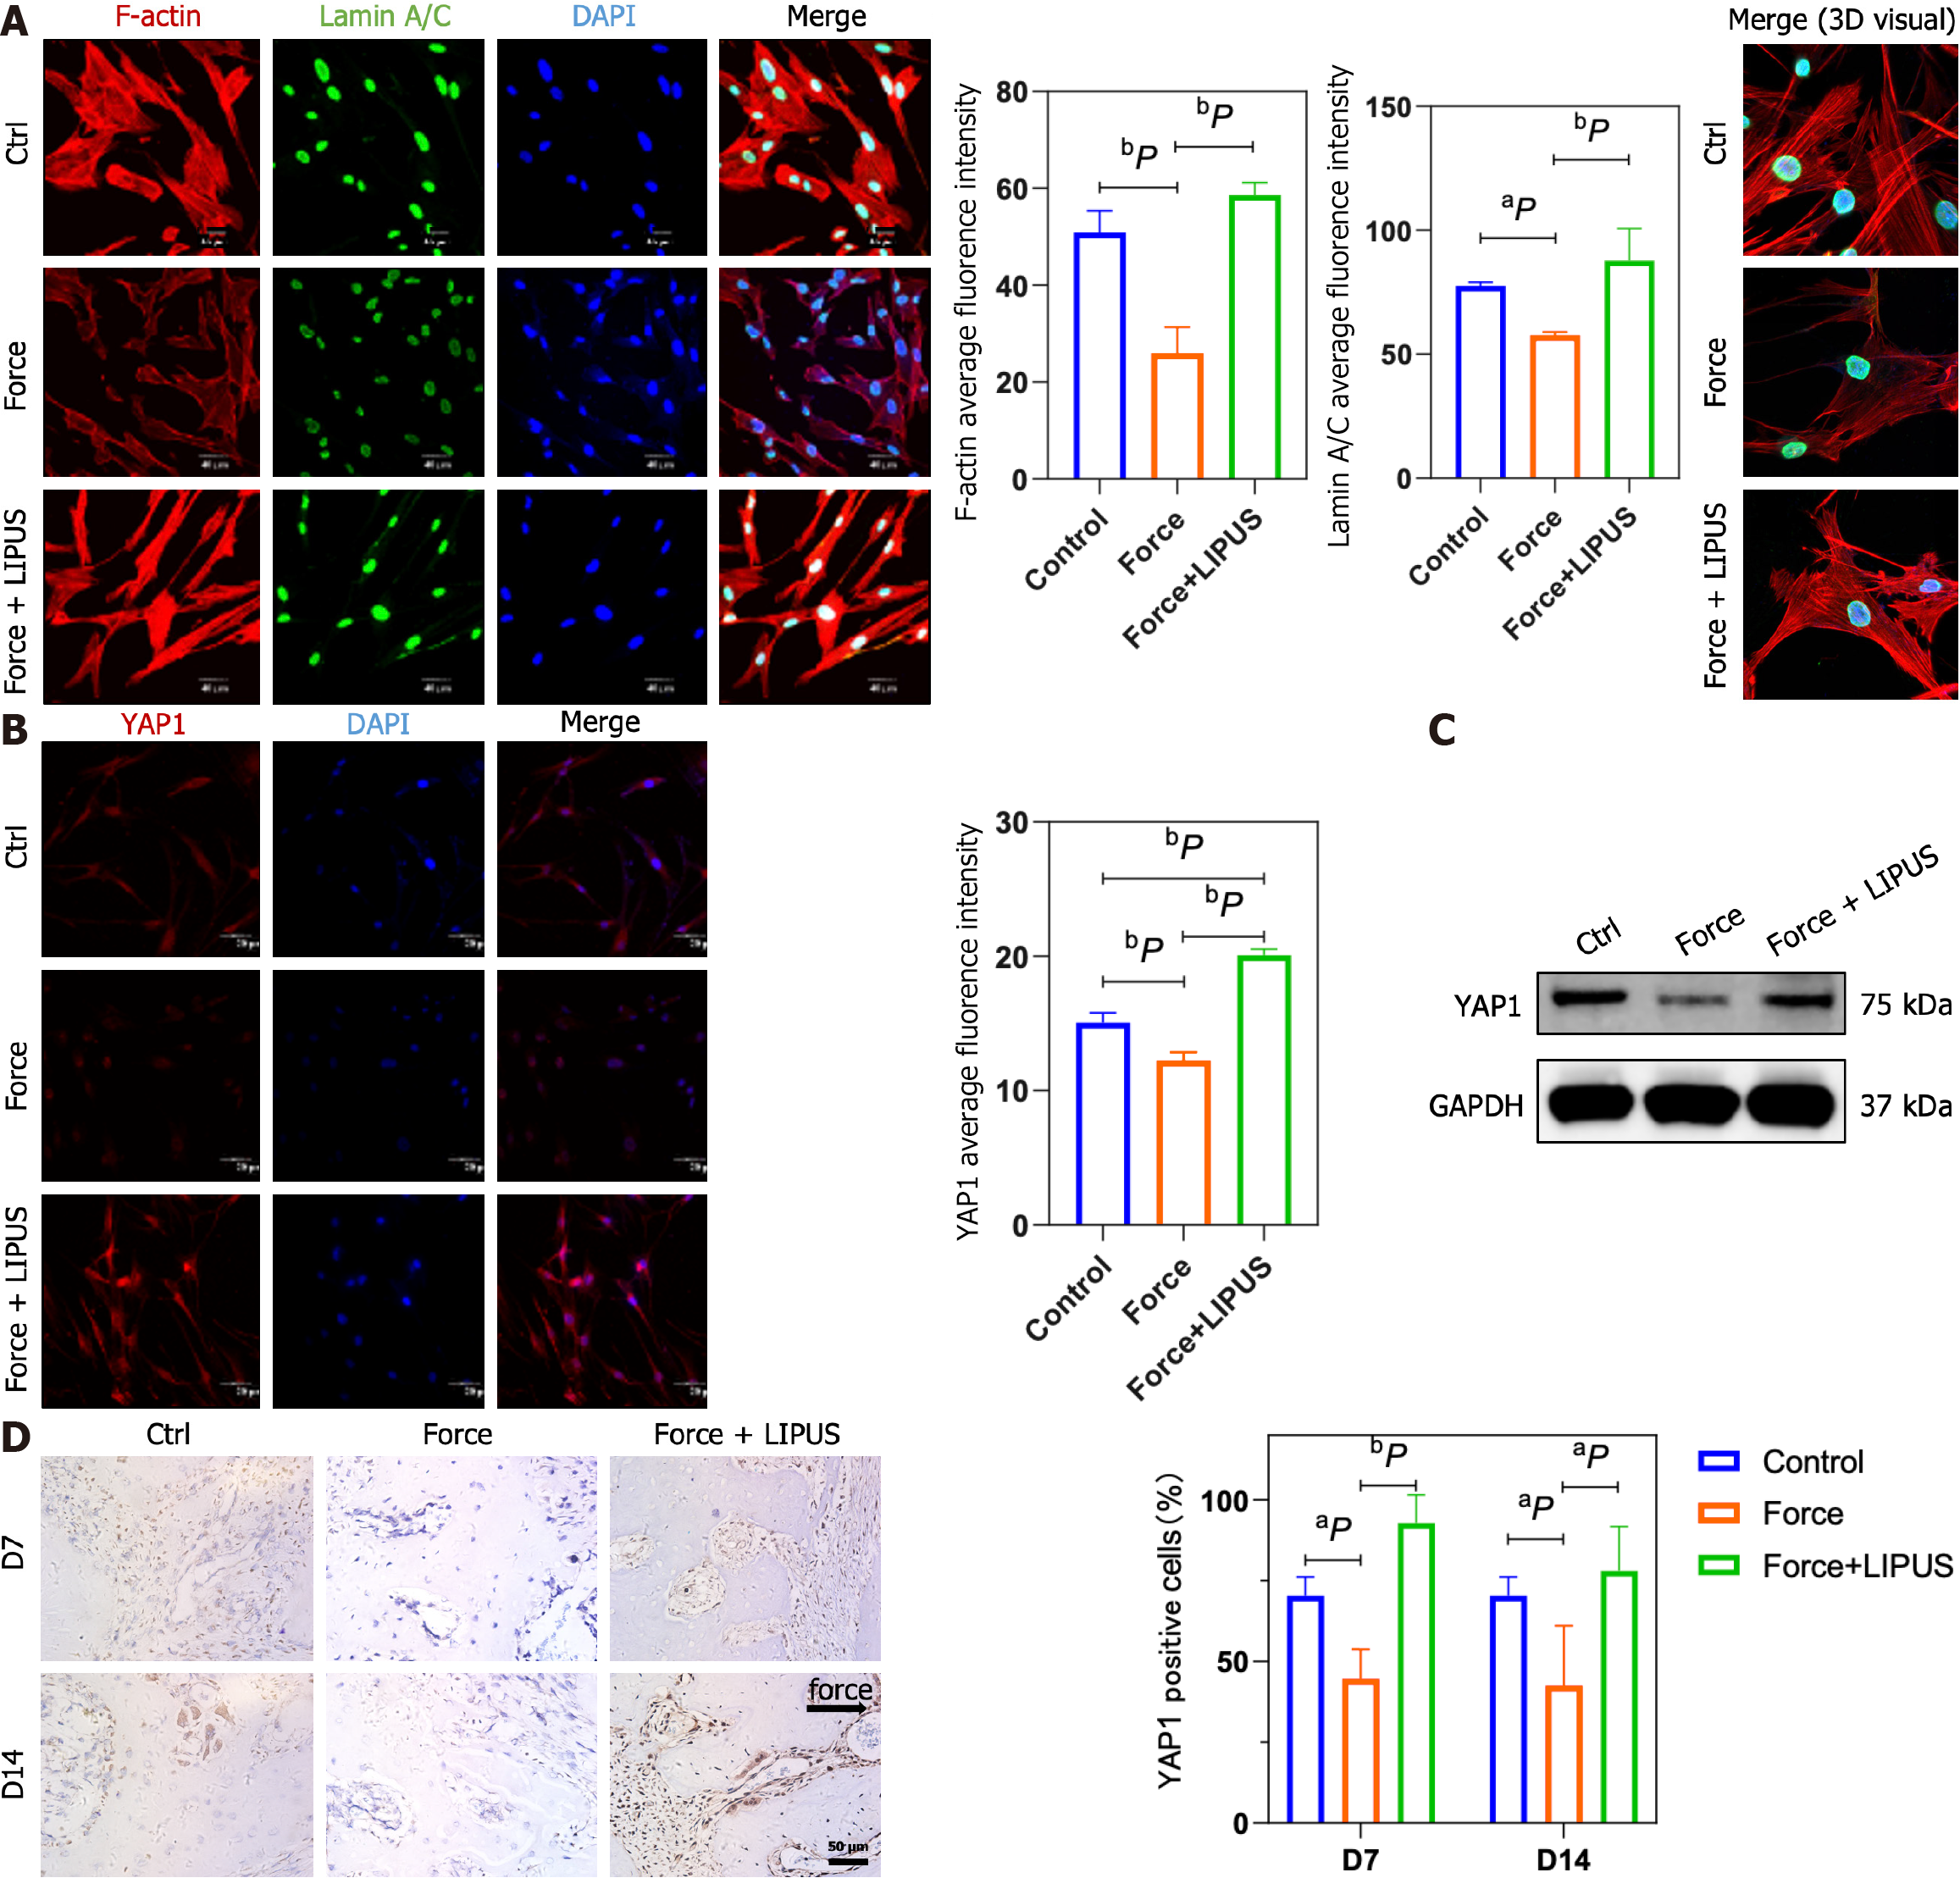
Figure 6 Low-intensity pulsed ultrasound reverses the stress-induced decrease in LaminA/C, F-actin, and Yes-associated protein expression.
A: Representative immunofluorescence images of F-actin (red), LaminA/C (green), and DAPI (blue) staining (left) and statistical analyses (middle), as well as representative 3D merged images constructed with Imaris software (right); B: Representative immunofluorescence images of Yes-associated protein (YAP1) (red) and DAPI (blue) staining (left) and statistical analyses (right); C: YAP1 protein expression analyzed by Western blotting; D: Representative images of immunohistochemical staining for YAP1 (left) and statistical analysis (right). aP < 0.05 vs control group, bP < 0.01 vs control group. LIPUS: Low-intensity pulsed ultrasound; YAP1: Yes-associated protein.
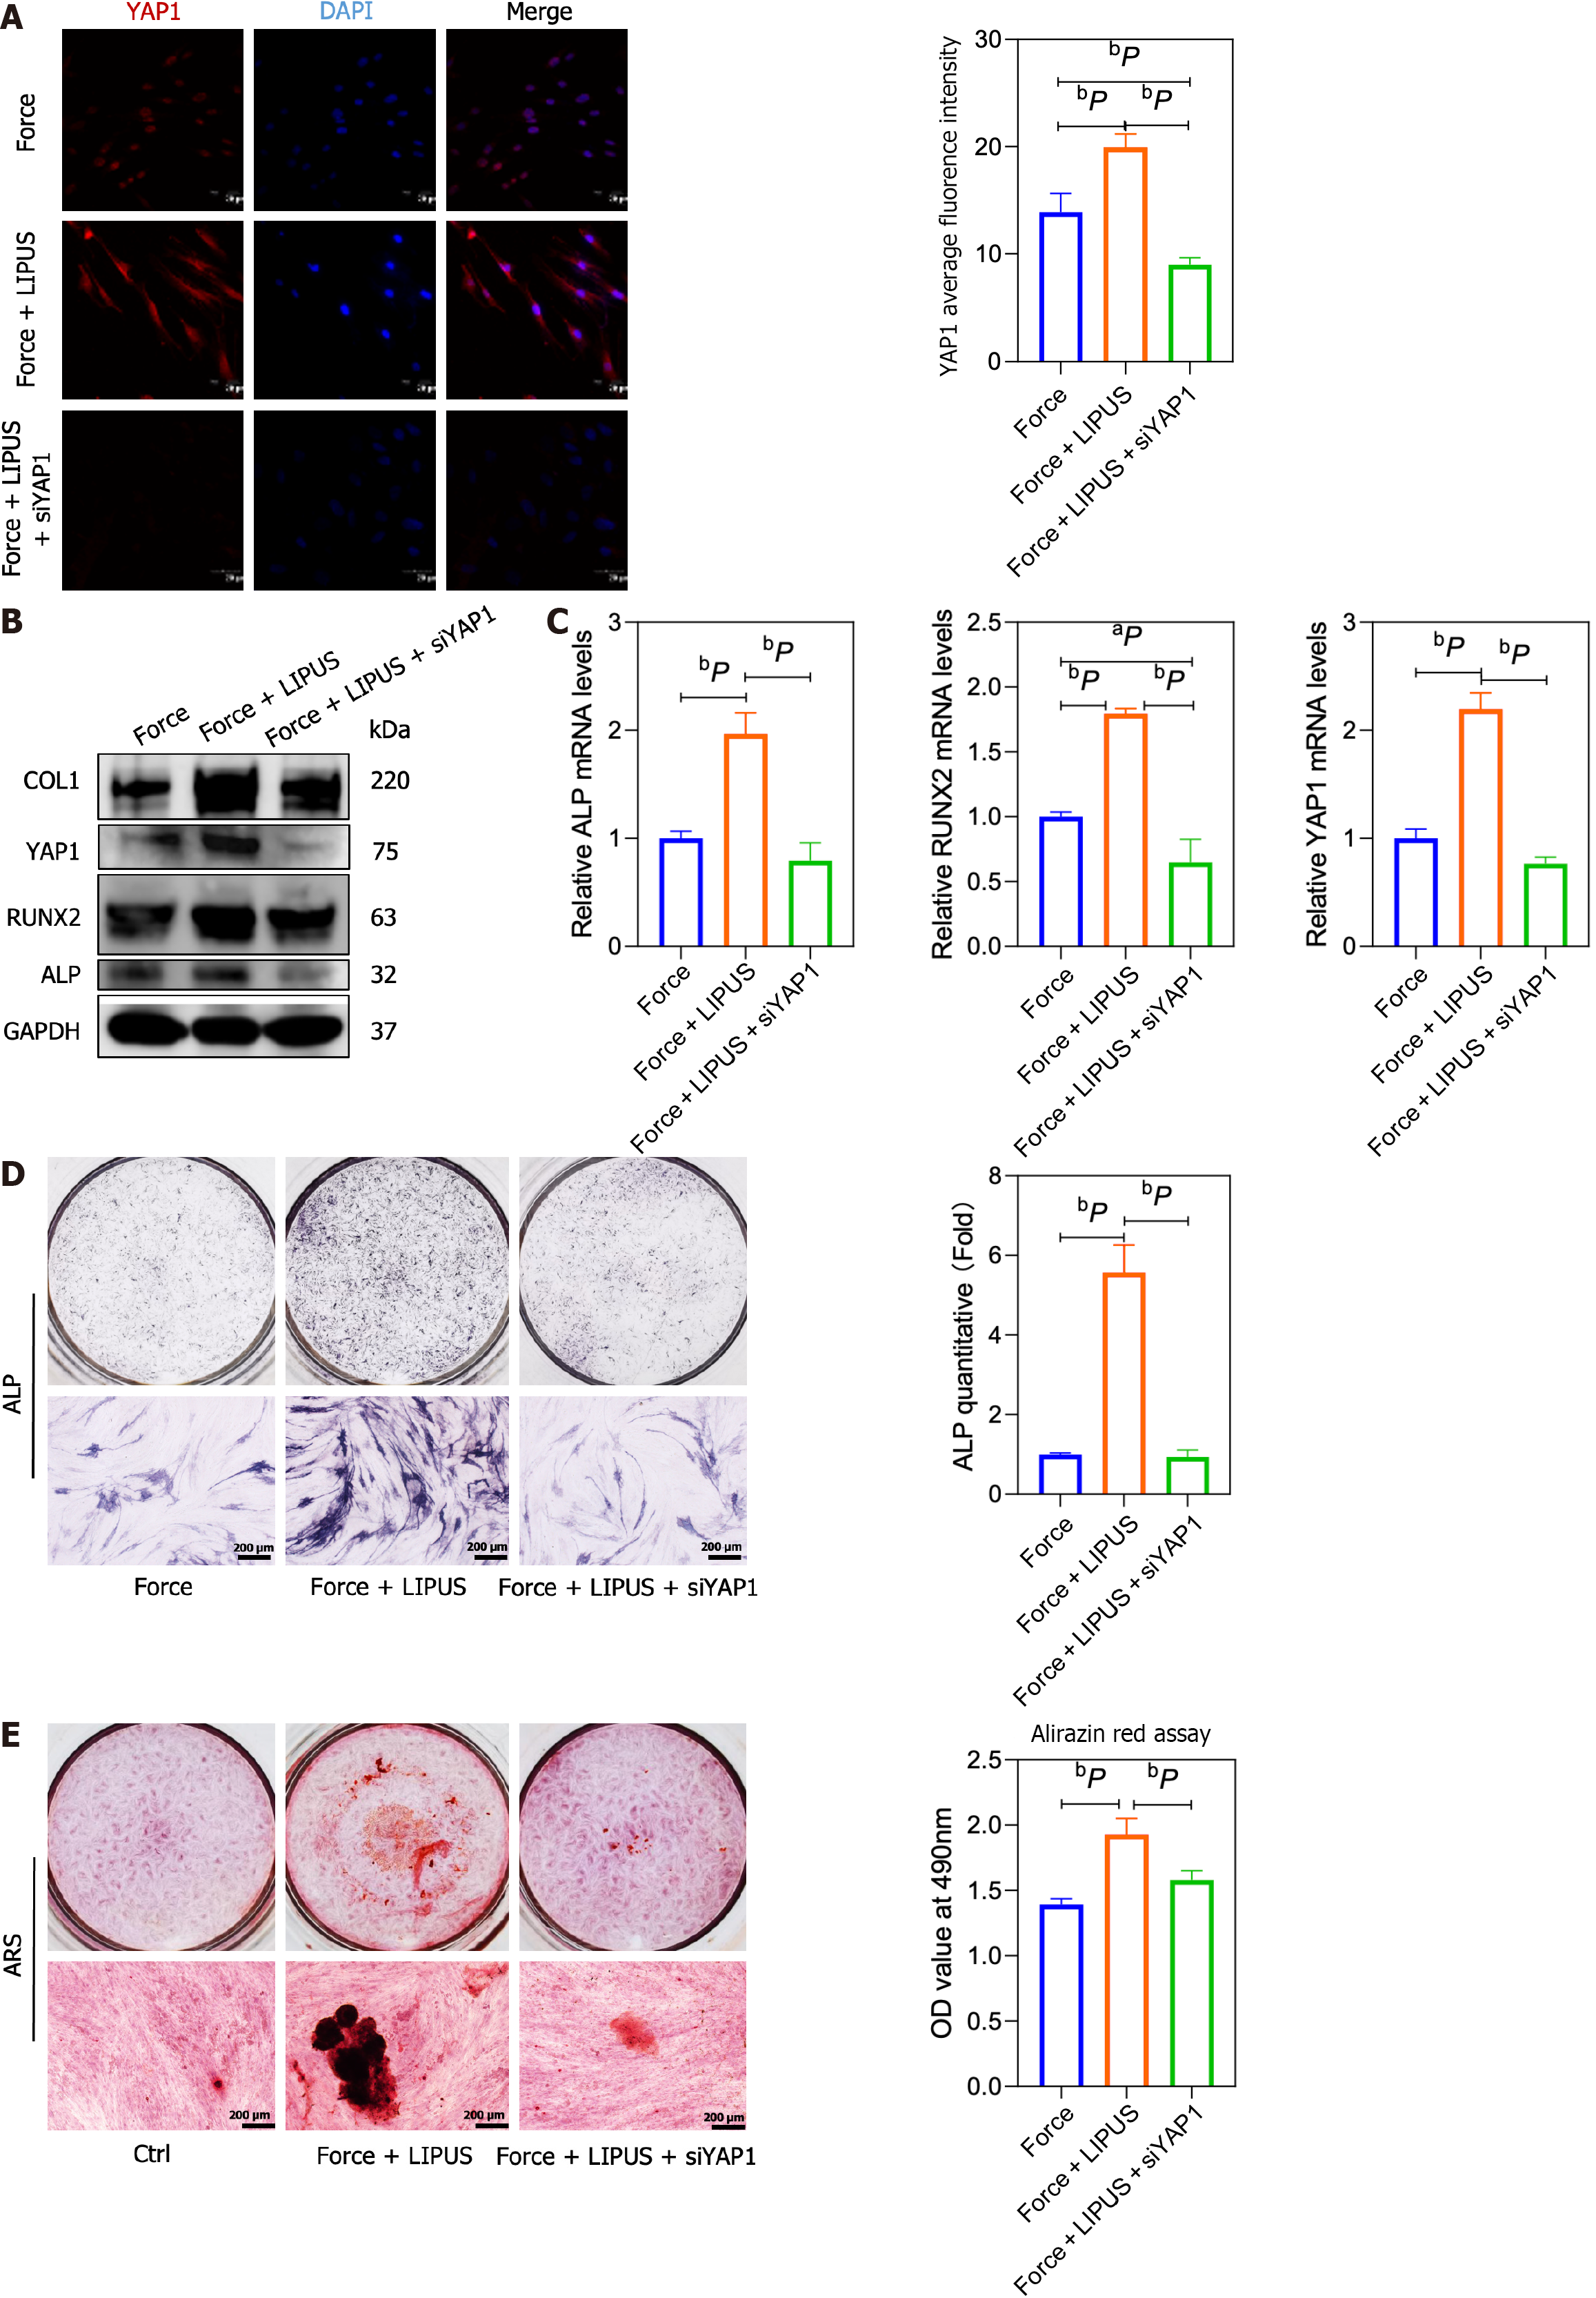
Figure 7 siYAP1 blocks the effect of low-intensity pulsed ultrasound-induced osteogenic differentiation of bone marrow mesenchymal stem cells.
A: Representative immunofluorescence images of Yes-associated protein (YAP1) (red) and DAPI (blue) staining (left) and statistical analyses (right); B: Western blotting results for type 1 collagen, YAP1, runt-related transcription factor 2 (RUNX2), and alkaline phosphatase (ALP); C: mRNA expression of ALP, RUNX2, and YAP1 in the force group by quantitative reverse transcription-polymerase chain reaction; D and E: Representative ALP and alizarin red staining staining images and statistical analysis. aP < 0.05 vs control group, bP < 0.01 vs control group. ALP: Alkaline phosphatase; COL1: Type 1 collagen; LIPUS: Low-intensity pulsed ultrasound; RUNX2: Runt-related transcription factor 2; YAP1: Yes-associated protein; ARS: Alizarin red staining.
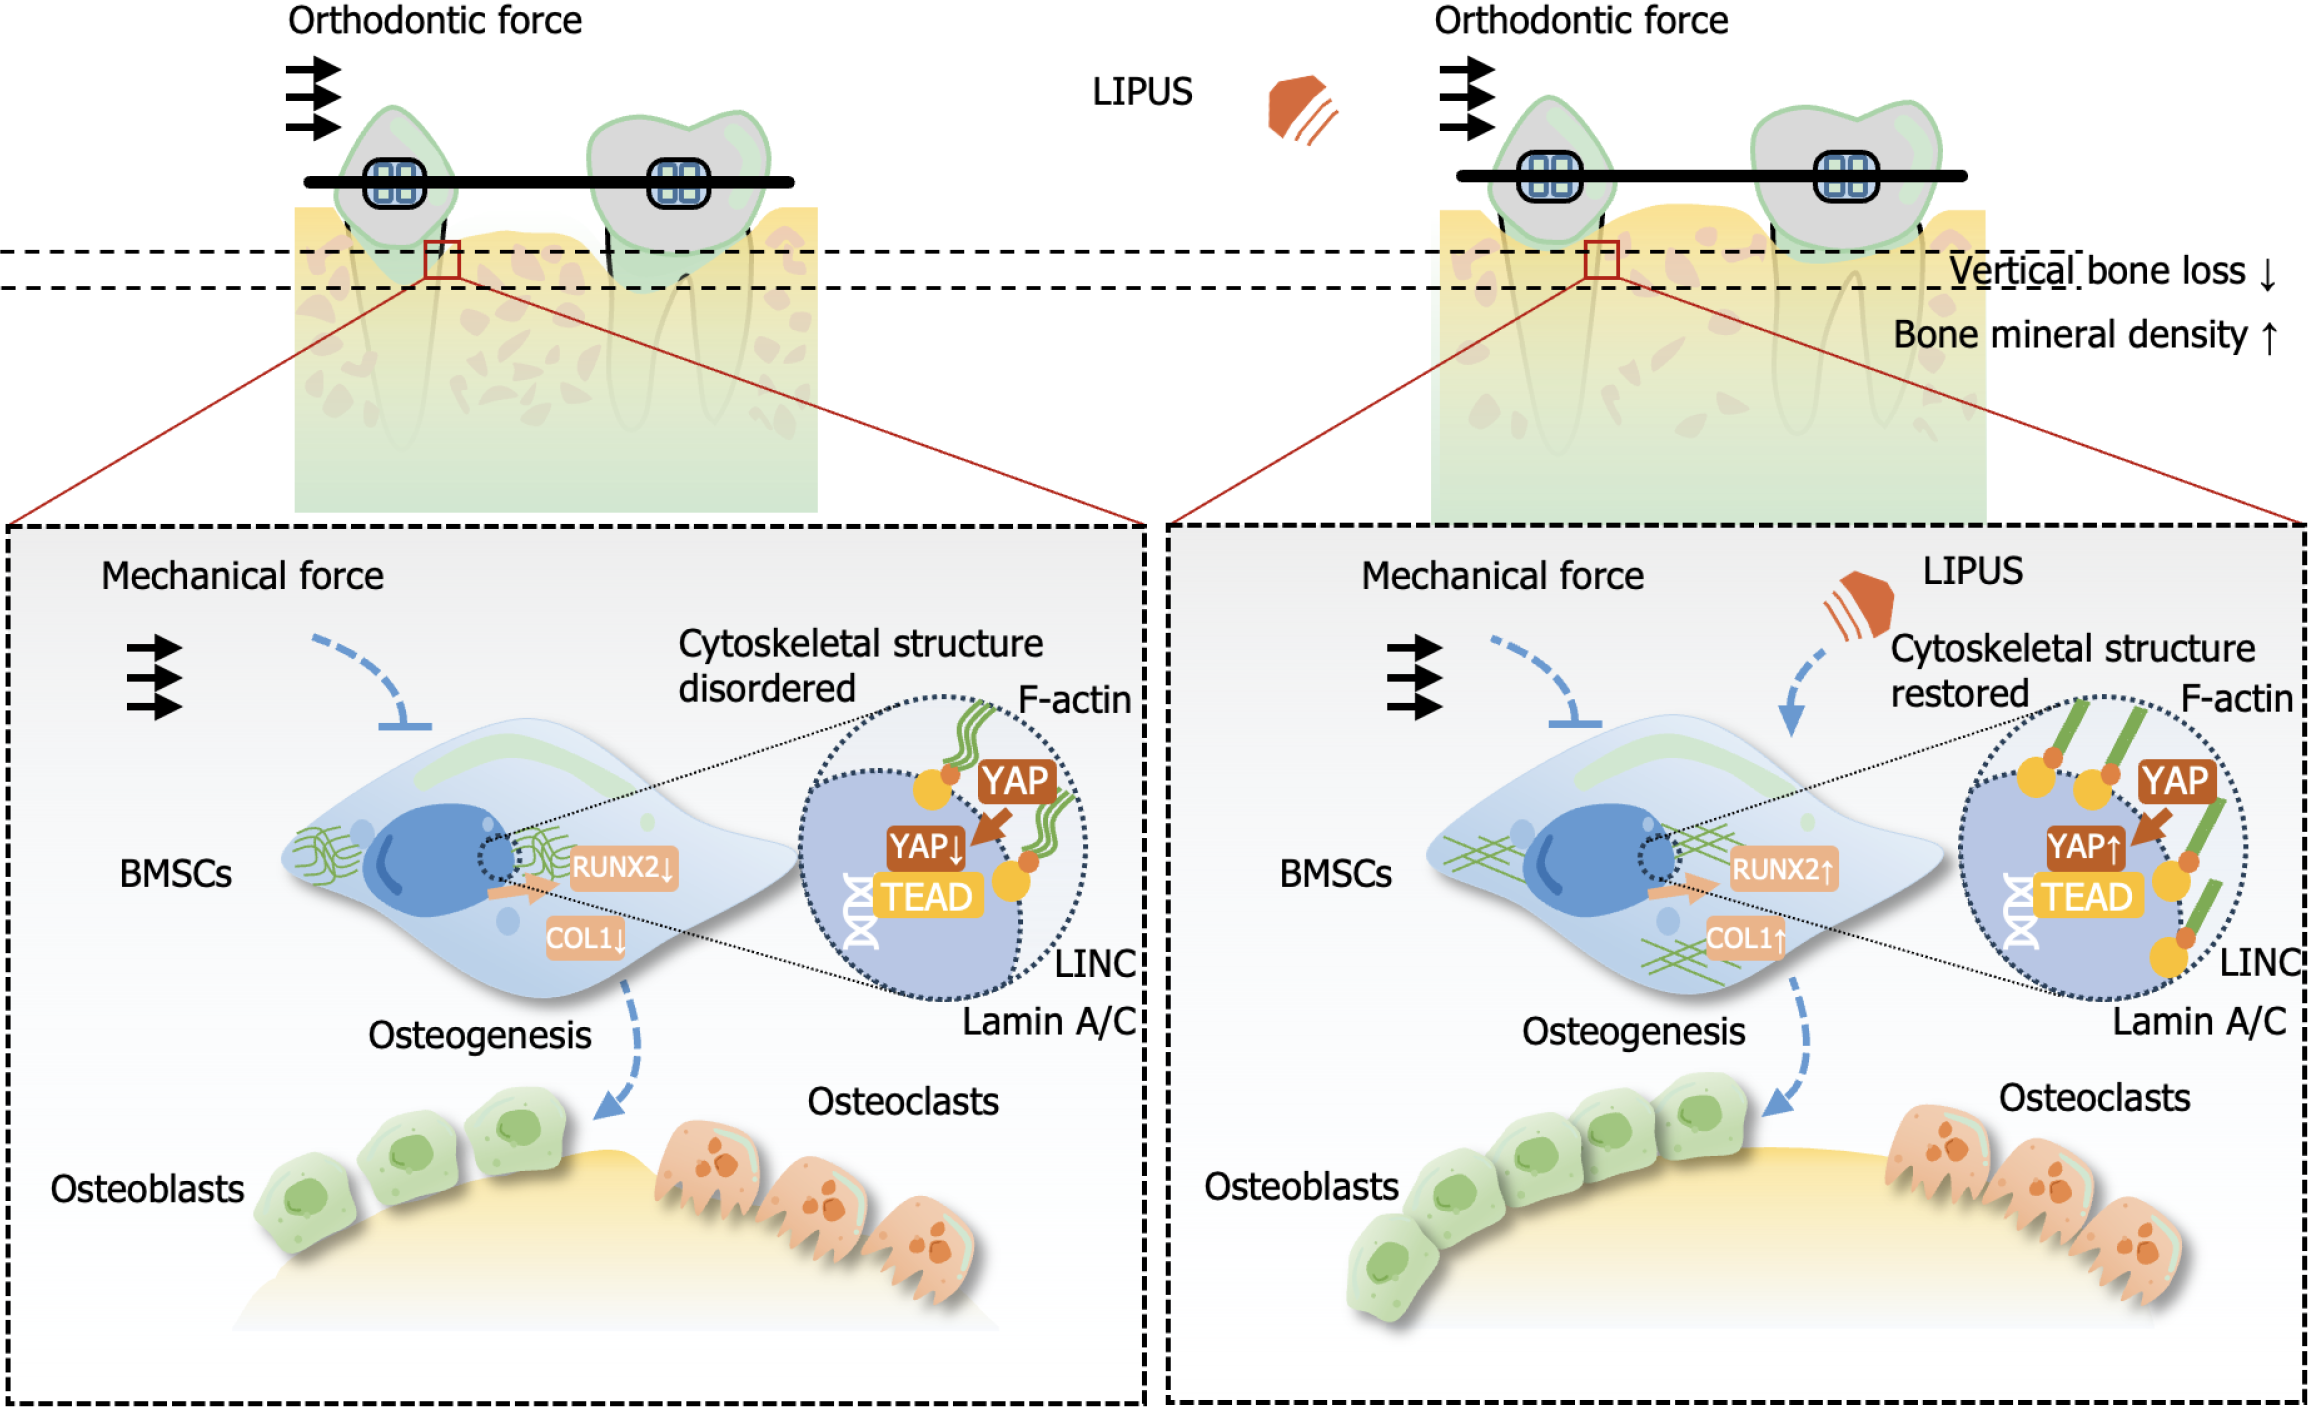
Figure 8 Putative mechanism of the effect of low-intensity pulsed ultrasound on alveolar bone during orthodontic treatment.
Low-intensity pulsed ultrasound has little effect on osteoclast differentiation but may rescue osteogenic gene expression suppressed by static force and promote osteoblastic differentiation by reordering the cytoskeleton, upregulating the expression of F-actin and Lamin A/C, and increasing the nuclear translocation of Yes-associated protein 1, thereby contributing to alveolar bone homeostasis and morphology while accelerating tooth movement during orthodontic treatment. COL1: Type 1 collagen; LIPUS: Low-intensity pulsed ultrasound; RUNX2: Runt-related transcription factor 2; BMSC: Bone marrow mesenchymal stem cell; YAP1: Yes-associated protein.
- Citation: Wu T, Zheng F, Tang HY, Li HZ, Cui XY, Ding S, Liu D, Li CY, Jiang JH, Yang RL. Low-intensity pulsed ultrasound reduces alveolar bone resorption during orthodontic treatment via Lamin A/C-Yes-associated protein axis in stem cells. World J Stem Cells 2024; 16(3): 267-286
- URL: https://www.wjgnet.com/1948-0210/full/v16/i3/267.htm
- DOI: https://dx.doi.org/10.4252/wjsc.v16.i3.267


