Copyright
©The Author(s) 2024.
World J Stem Cells. Feb 26, 2024; 16(2): 207-227
Published online Feb 26, 2024. doi: 10.4252/wjsc.v16.i2.207
Published online Feb 26, 2024. doi: 10.4252/wjsc.v16.i2.207
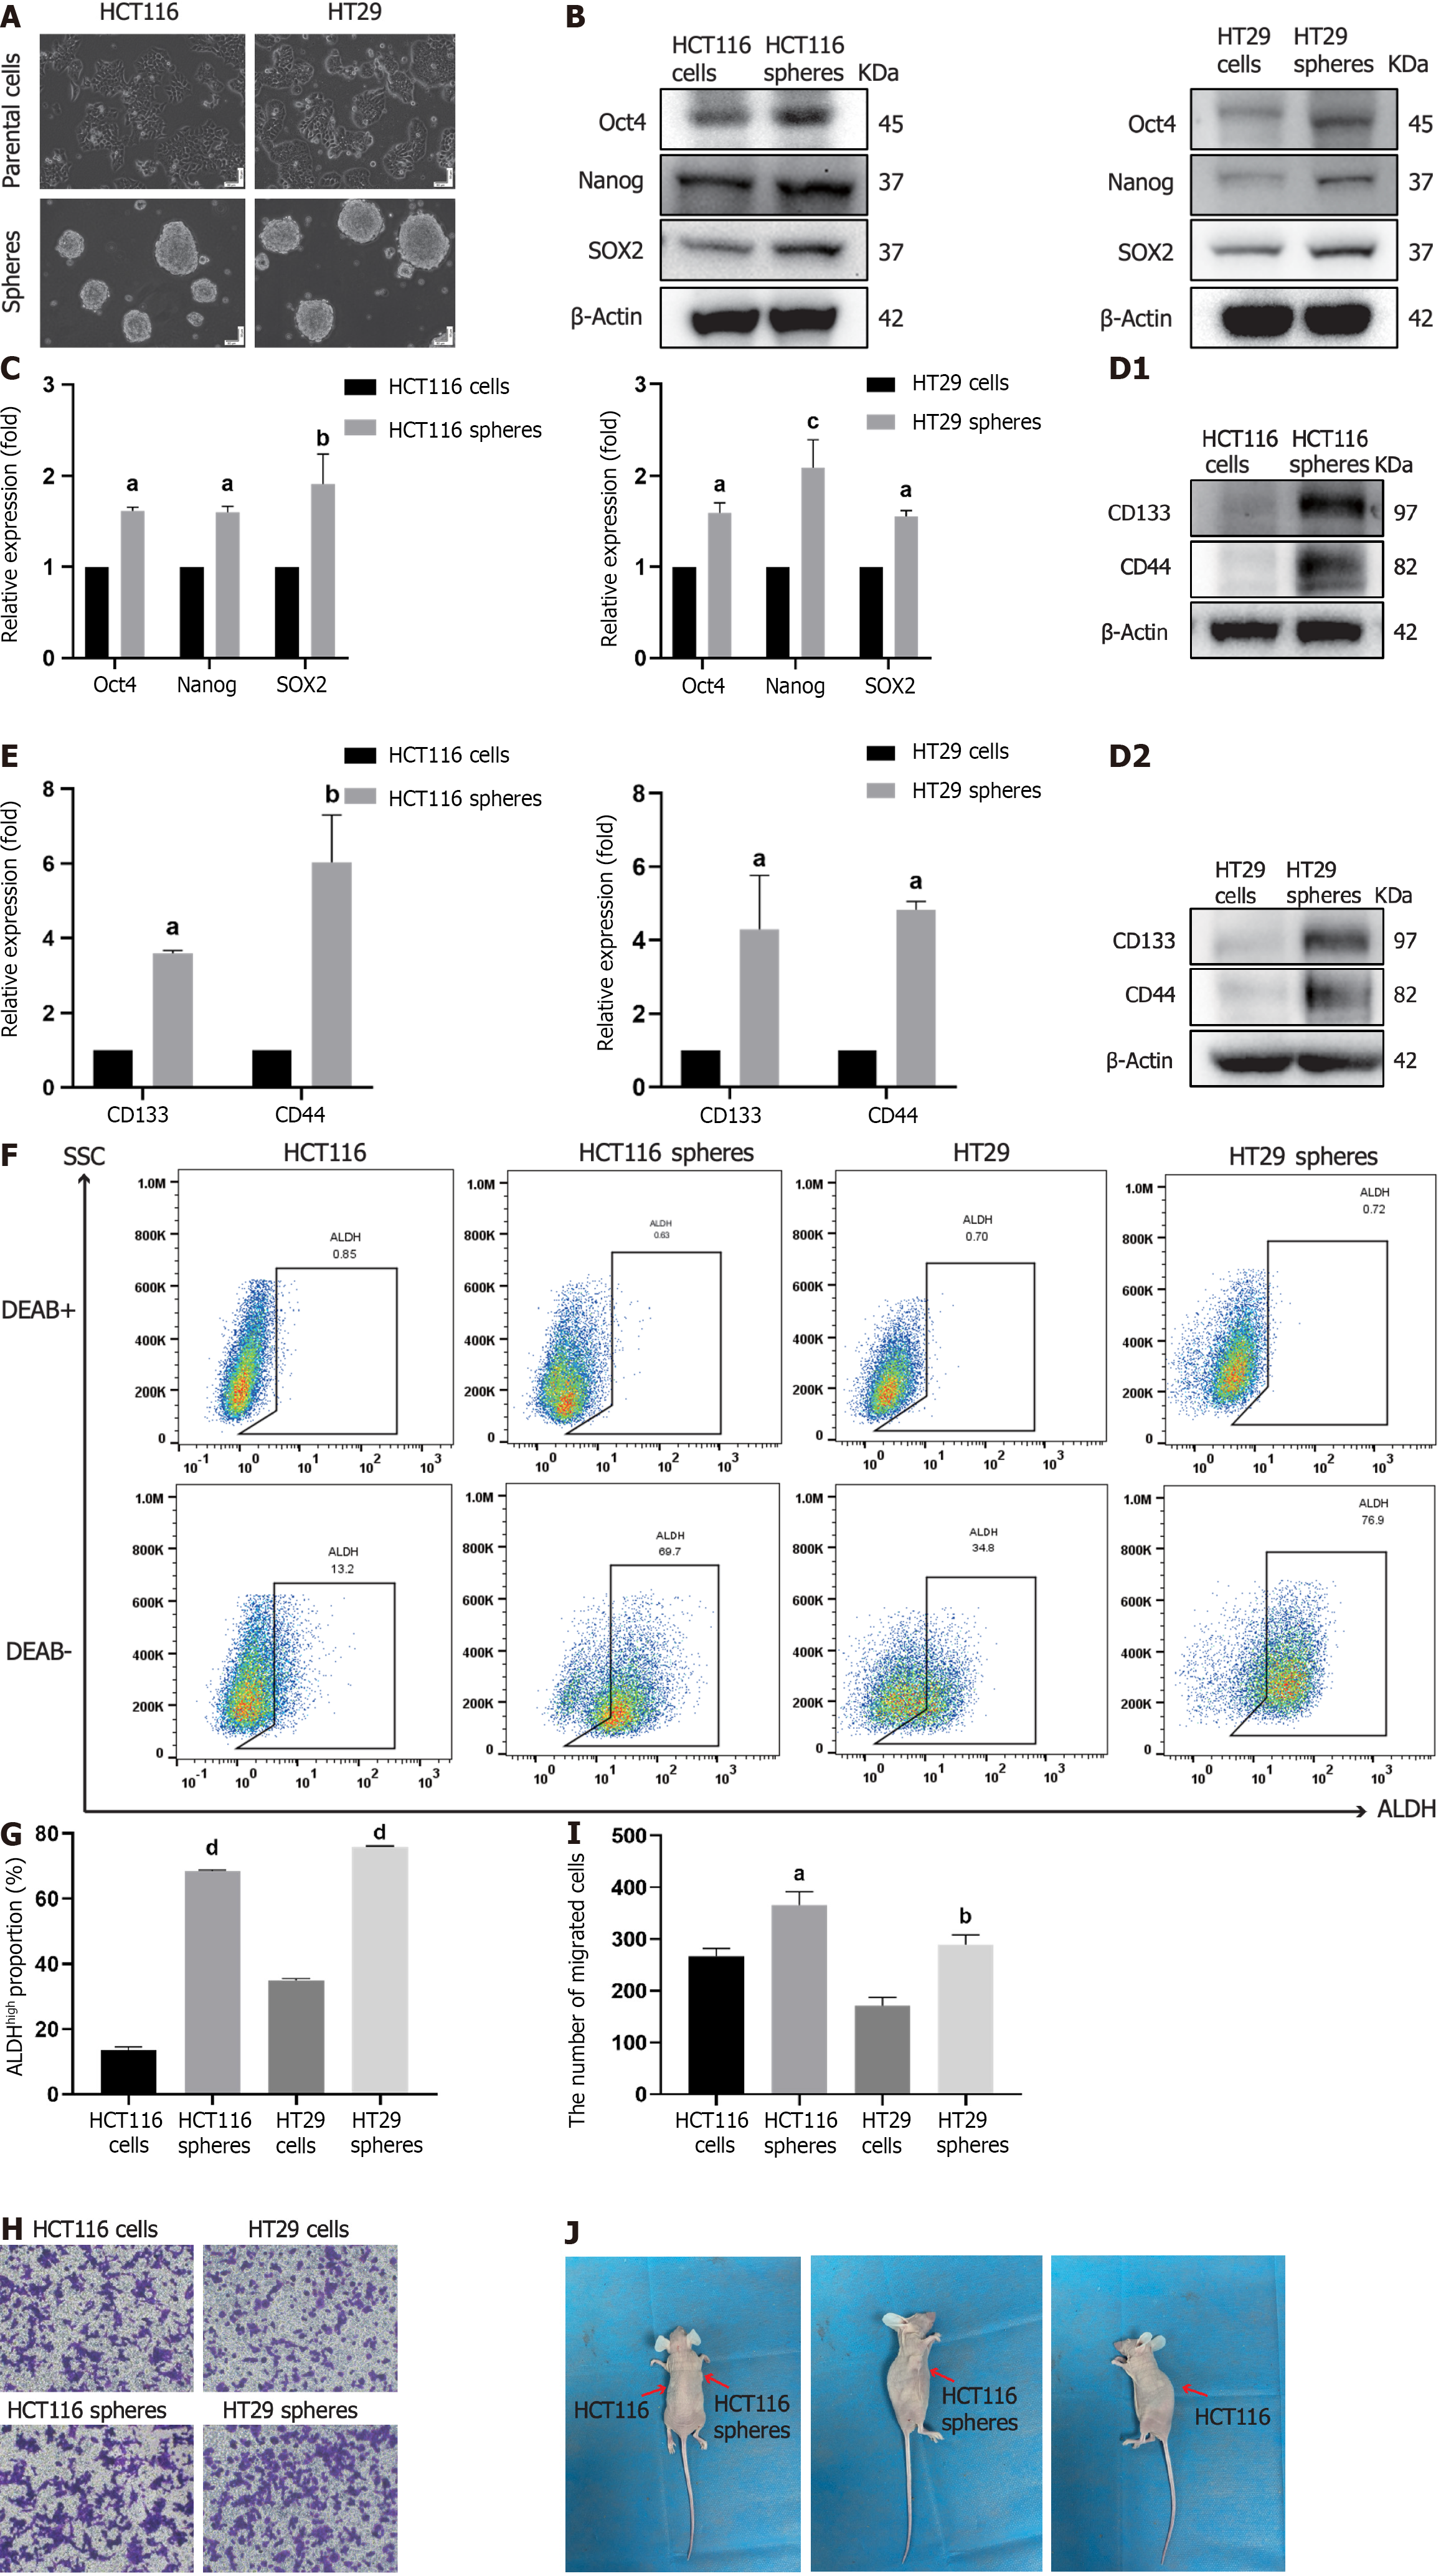
Figure 1 Spherical cells derived from colorectal cancer cell lines exhibit cancer stem cell characteristics.
A: Microscopy images of colorectal cancer parental cells and specified serum free cultured spheres; B-E: The protein expression levels of Oct4, Nanog, and SOX2 (B), CD133 and CD44 (D) in parental cells and sphere cells are shown. Densitometric analysis of Oct4, Nanog, and SOX2 (C) and CD133 and CD44 (E) normalized against β-Actin; F and G: ALDH+ cells were measured using flow cytometry and relative statistical analysis; H and I: Transwell migration assay of parental cells and sphere cells and relative statistical analysis; J: Representative pictures showing the tumorigenic capacities of parental cells and sphere cells derived from HCT116 cells. Scale bar = 50 μm. n = 3. aP < 0.05, bP < 0.01, cP < 0.001, dP < 0.0001 compared to the HCT116 cell group and HT29 cell group. ALDH: Aldehyde dehydrogenase.
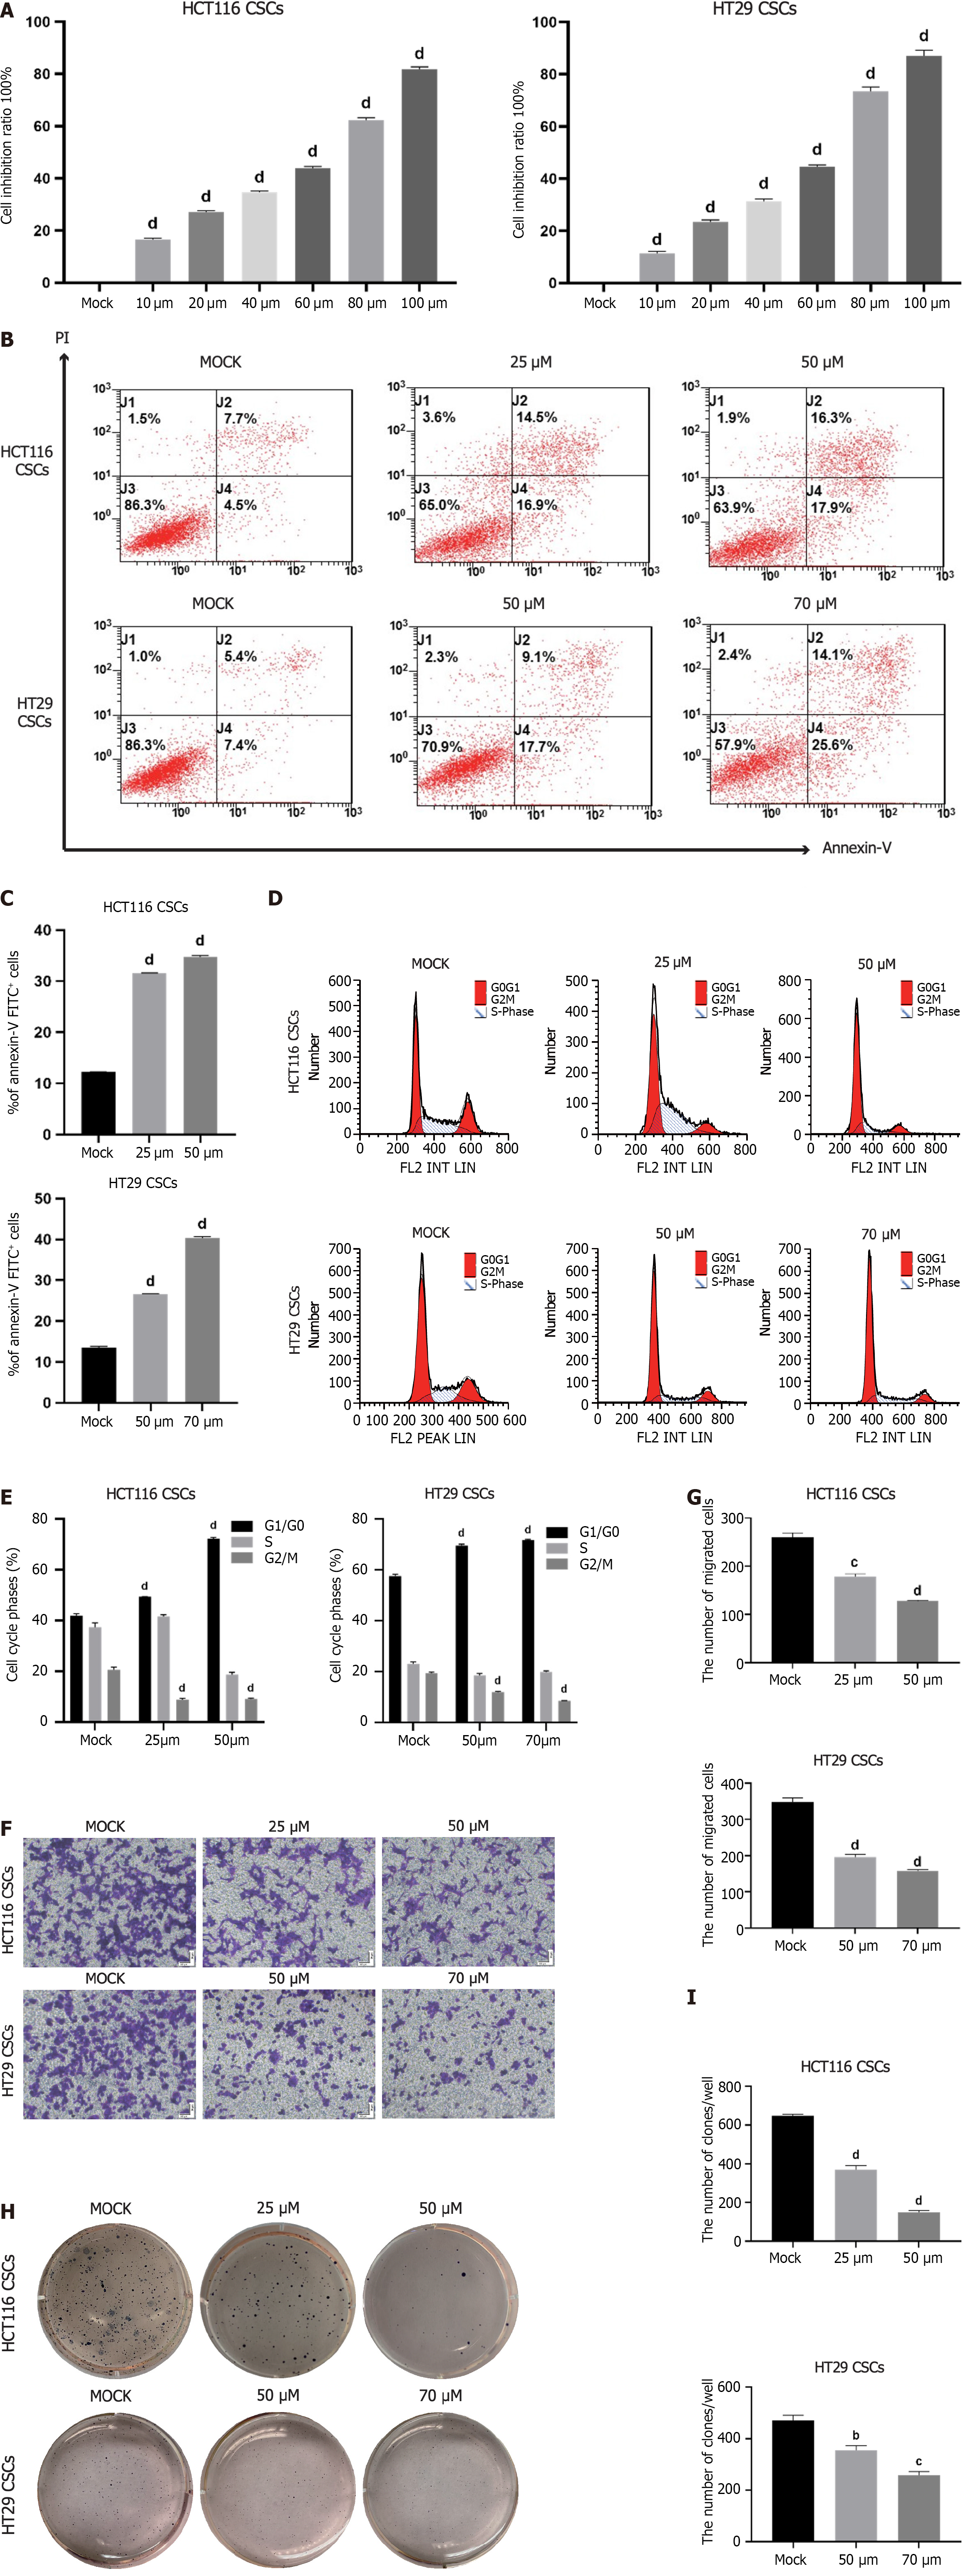
Figure 2 VX-509 inhibits the growth, migration, invasion and clonogenicity of colorectal cancer-derived cancer stem cells.
A: The viability of colorectal cancer-derived cancer stem cells (CSCs) treated with different concentrations of VX-509 was measured by a cell counting kit-8 assay; B and C: Flow cytometry analysis of early and late apoptotic rates and relative statistical analysis; D: Cell cycle distribution was measured using flow cytometry; E: Histograms of the proportions of G0/G1-, S- and G2/M-phase cells; F and G: The effects of different concentrations of VX-509 on the migration of HCT116 CSCs and HT29 CSCs detected by transwell assays and relative statistical analysis; H and I: The effects of different concentrations of VX-509 on the proliferation and tumorigenesis of HCT116 CSCs and HT29 CSCs detected by soft agar colony formation assays and relative statistical analysis. Scale bar = 50 μm. n = 3. bP < 0.01, cP < 0.001, dP < 0.0001 compared to the HCT116 cancer stem cells Mock group and HT29 cancer stem cells Mock group. CSC: Cancer stem cell.
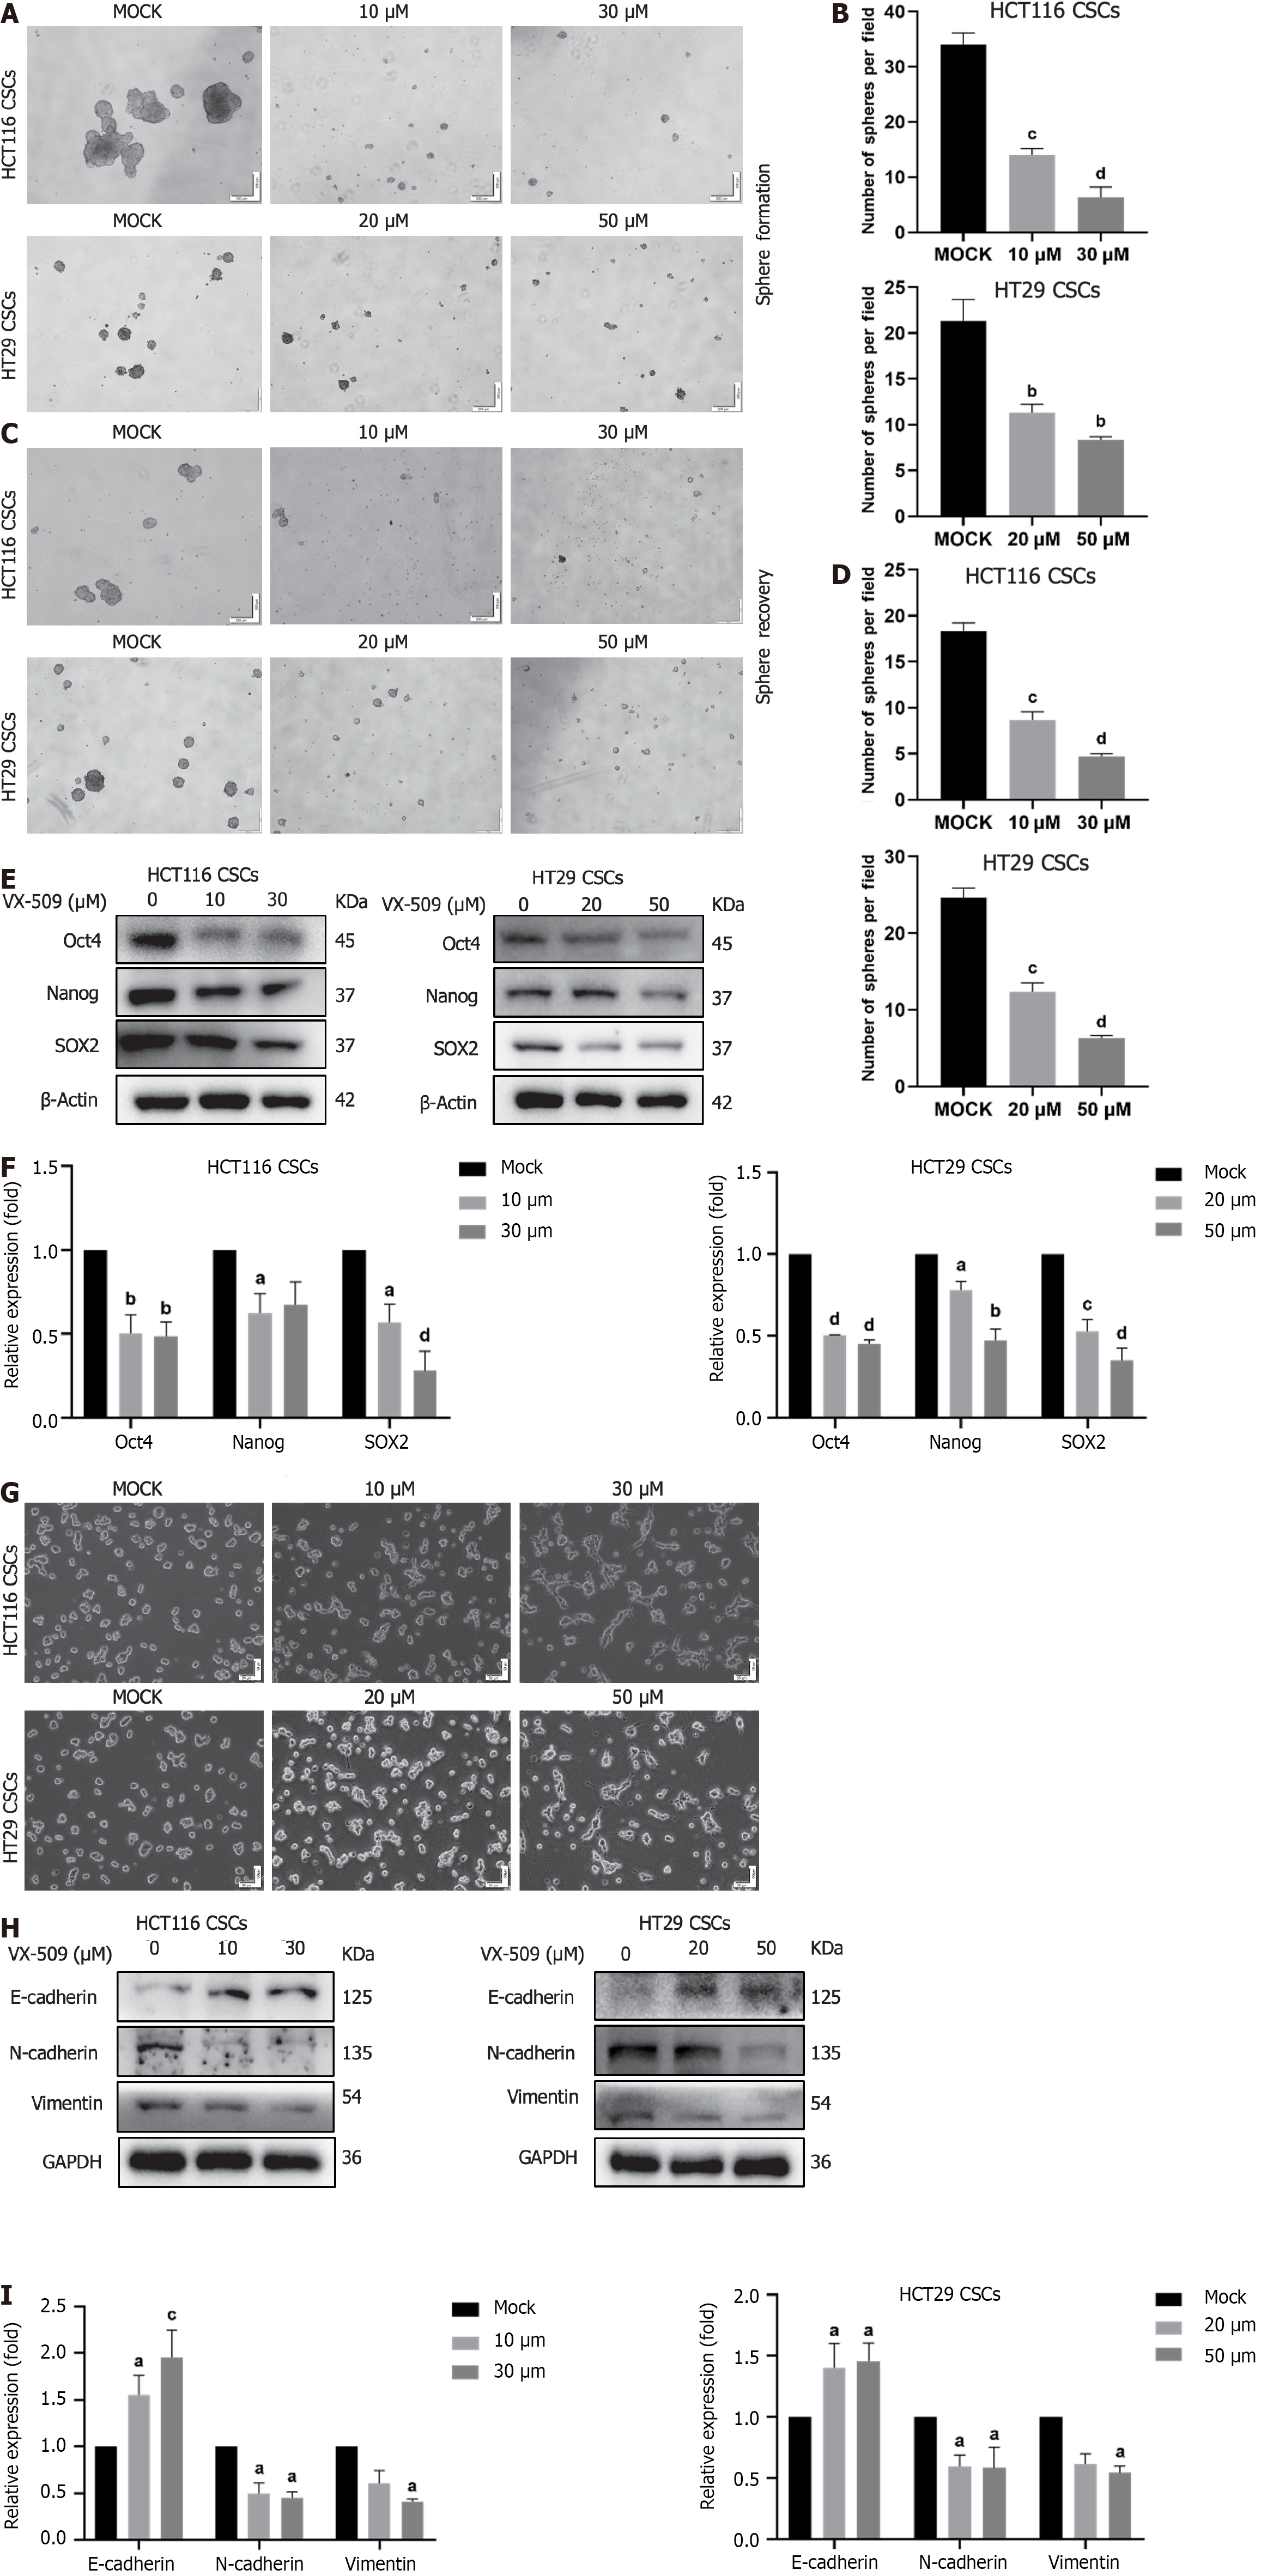
Figure 3 VX-509 inhibits the cancer stem cells characteristics of colorectal cancer-derived cancer stem cells and has an inverse effect on the epithelial-mesenchymal transition progression.
A-D: Representative morphology after VX-509 treatment (A, sphere formation assay) or pretreatment (C, sphere recovery assay) and relative statistical analysis (B and D); E: Western blot analysis of Oct4, Nanog, and SOX2 in colorectal cancer (CRC)-derived cancer stem cells (CSCs) treated with different concentrations of VX-509; F: Densitometric analysis of Oct4, Nanog, and SOX2, normalized against β-actin; G: Representative morphology of CRC-derived CSCs in regular 6-well plates after different concentrations of VX-509 treatment; H and I: The effects of different concentrations of VX-509 on the protein expression of E-cadherin, N-cadherin, and vimentin in CRC-derived CSCs were detected by western blot and relative statistical analysis, normalized against GAPDH. Scale bar = 50, 200 μm. n = 3. aP < 0.05, bP < 0.01, cP < 0.001, dP < 0.0001 compared to the HCT116 cancer stem cells Mock group and HT29 cancer stem cells Mock group. CSC: Cancer stem cell.
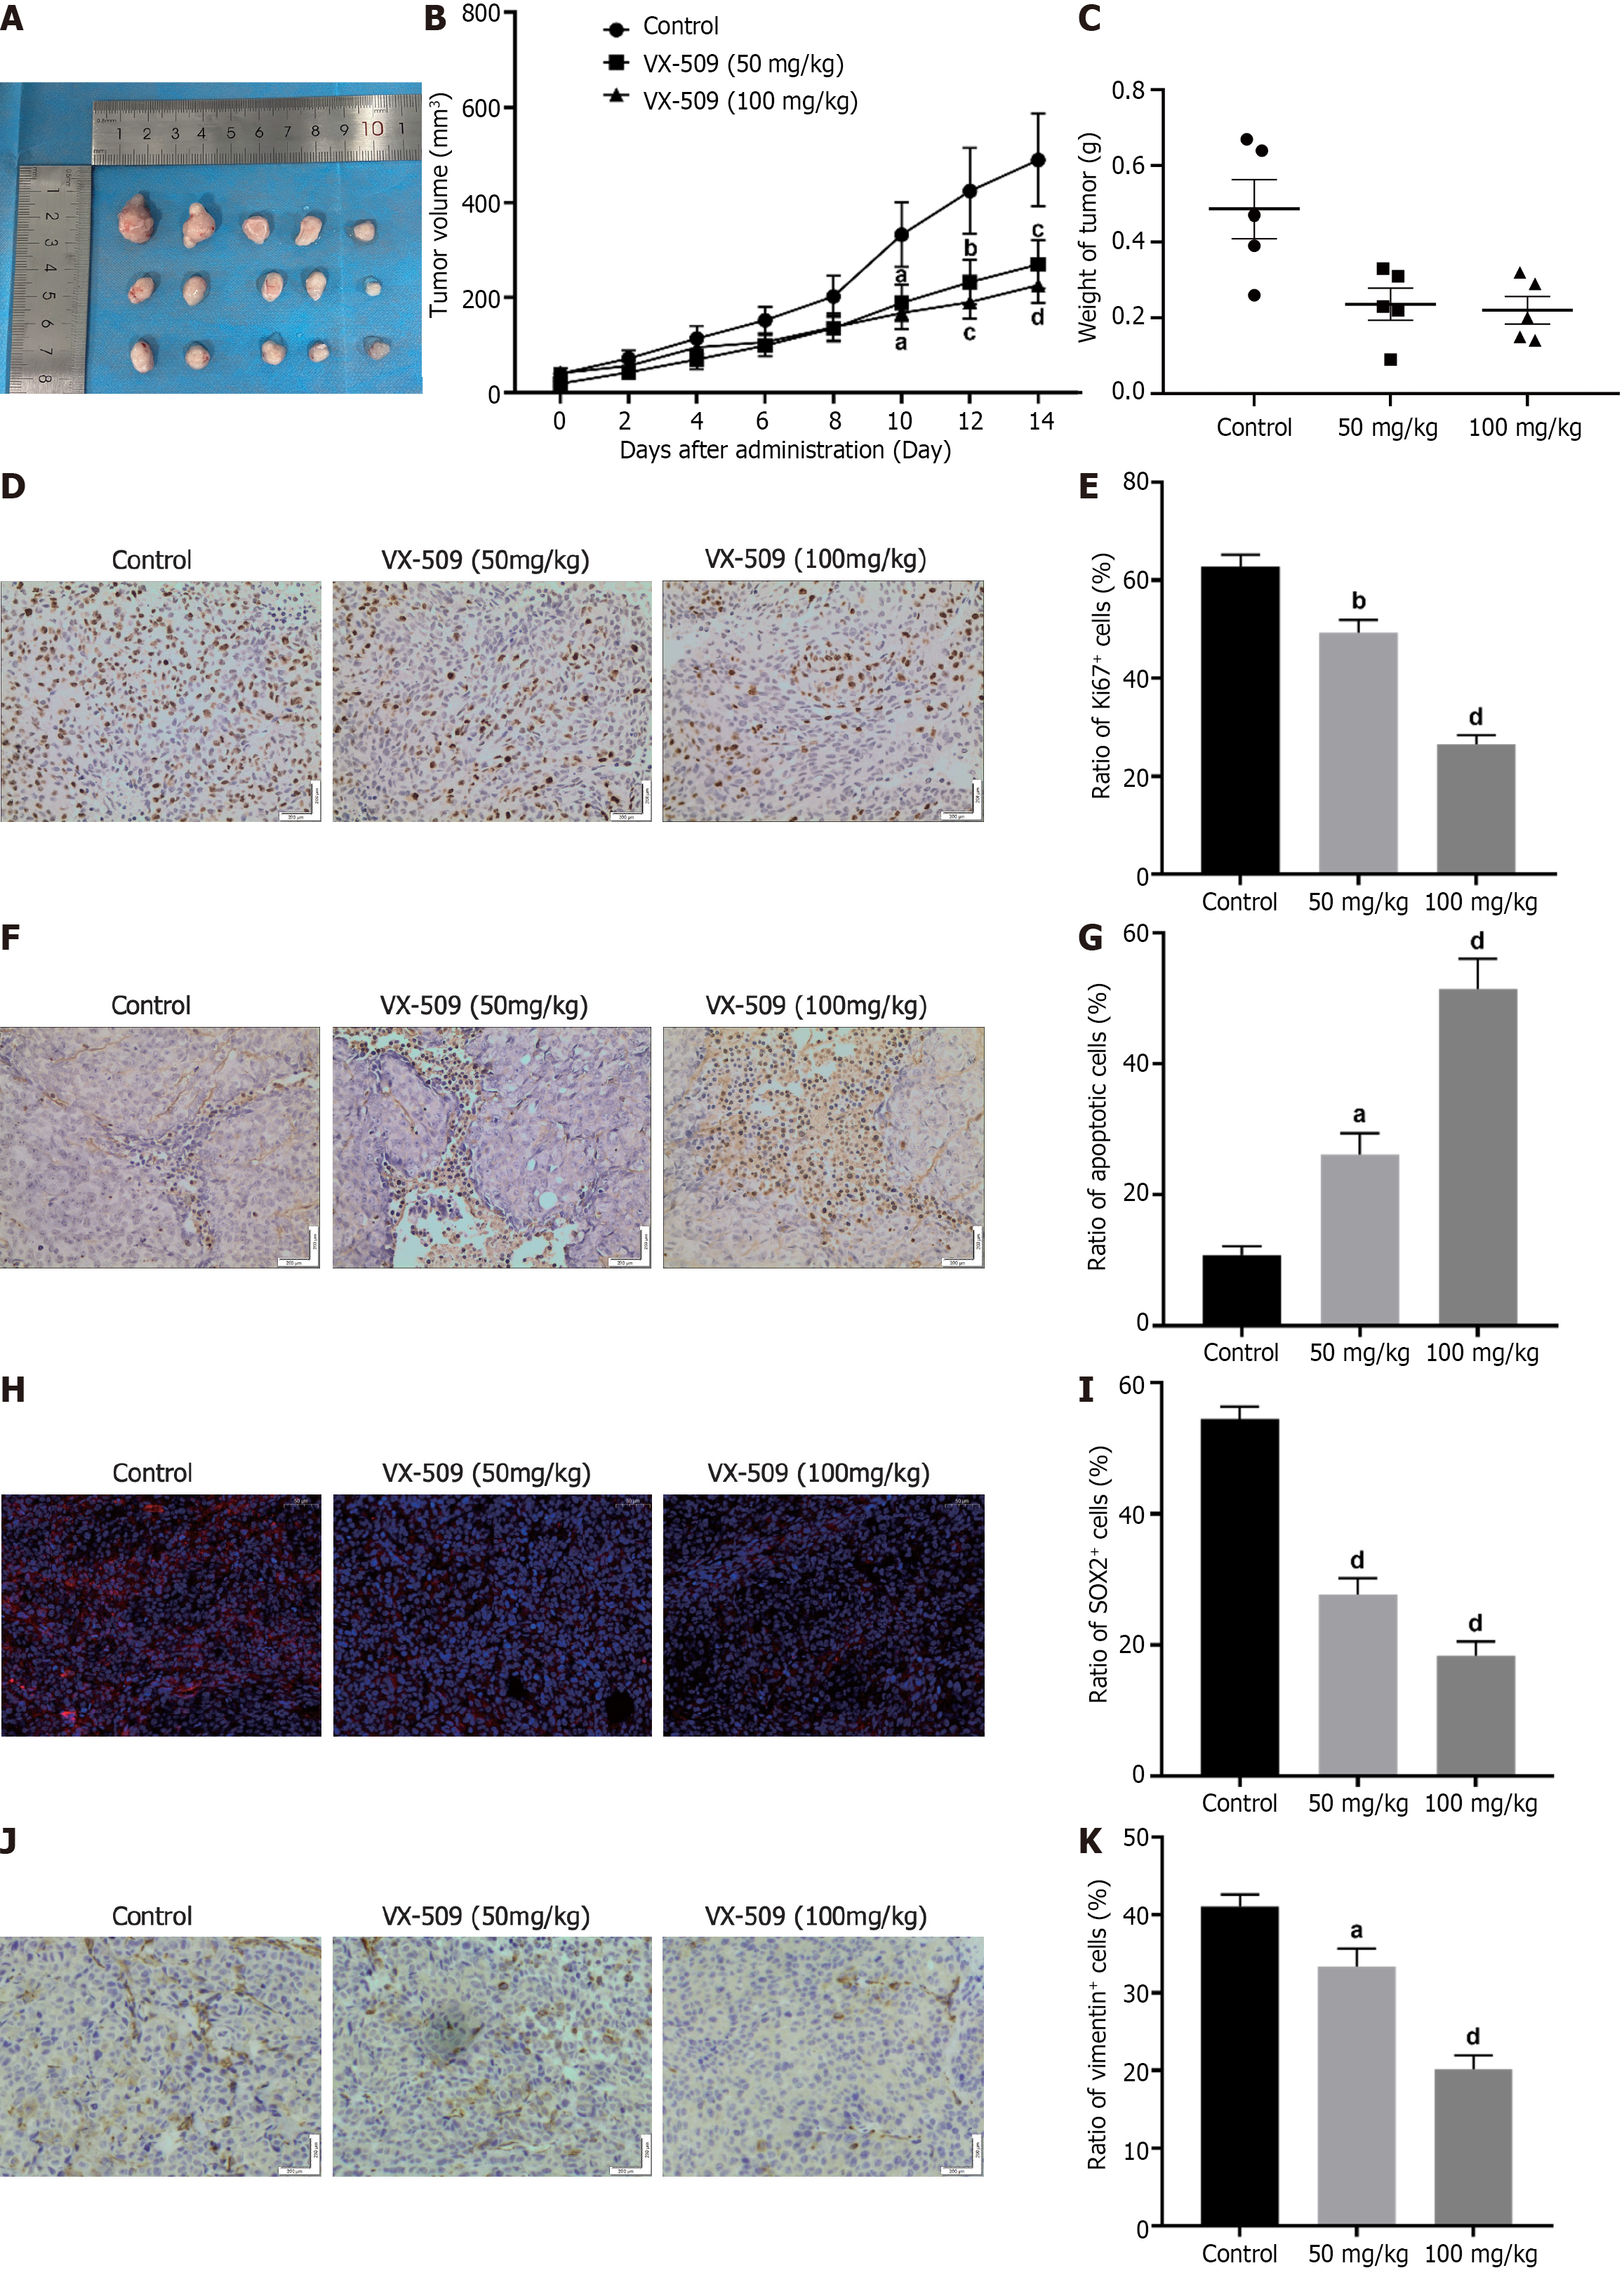
Figure 4 Anticancer efficacy of VX-509 against xenografts derived from colorectal cancer-derived cancer stem cells.
A: Tumors derived from HCT116 cancer stem cell (CSC)-bearing nude mice after 14 d of VX-509 treatment; B and C: The statistics of tumor volumes (B) and tumor weights (C) from HCT116 CSC-bearing nude mice treated with VX-509; D-K: Representative immunohistochemical images of Ki67 (D), TUNEL (F) and vimentin (J) as well as the mean of the IODs of Ki67 (E), TUNEL (G) and vimentin (K) in tumors from HCT116 CSC-bearing nude mice treated with VX-509 are shown. Representative immunofluorescent images of SOX2 (H) as well as the mean of the IOD of SOX2 (I) of tumors from HCT116 CSCs bearing nude mice treated with VX-509 are shown. Scale bars = 50 or 200 μm. n = 5. aP < 0.05, bP < 0.01, cP < 0.001, dP < 0.0001 compared to the control group.
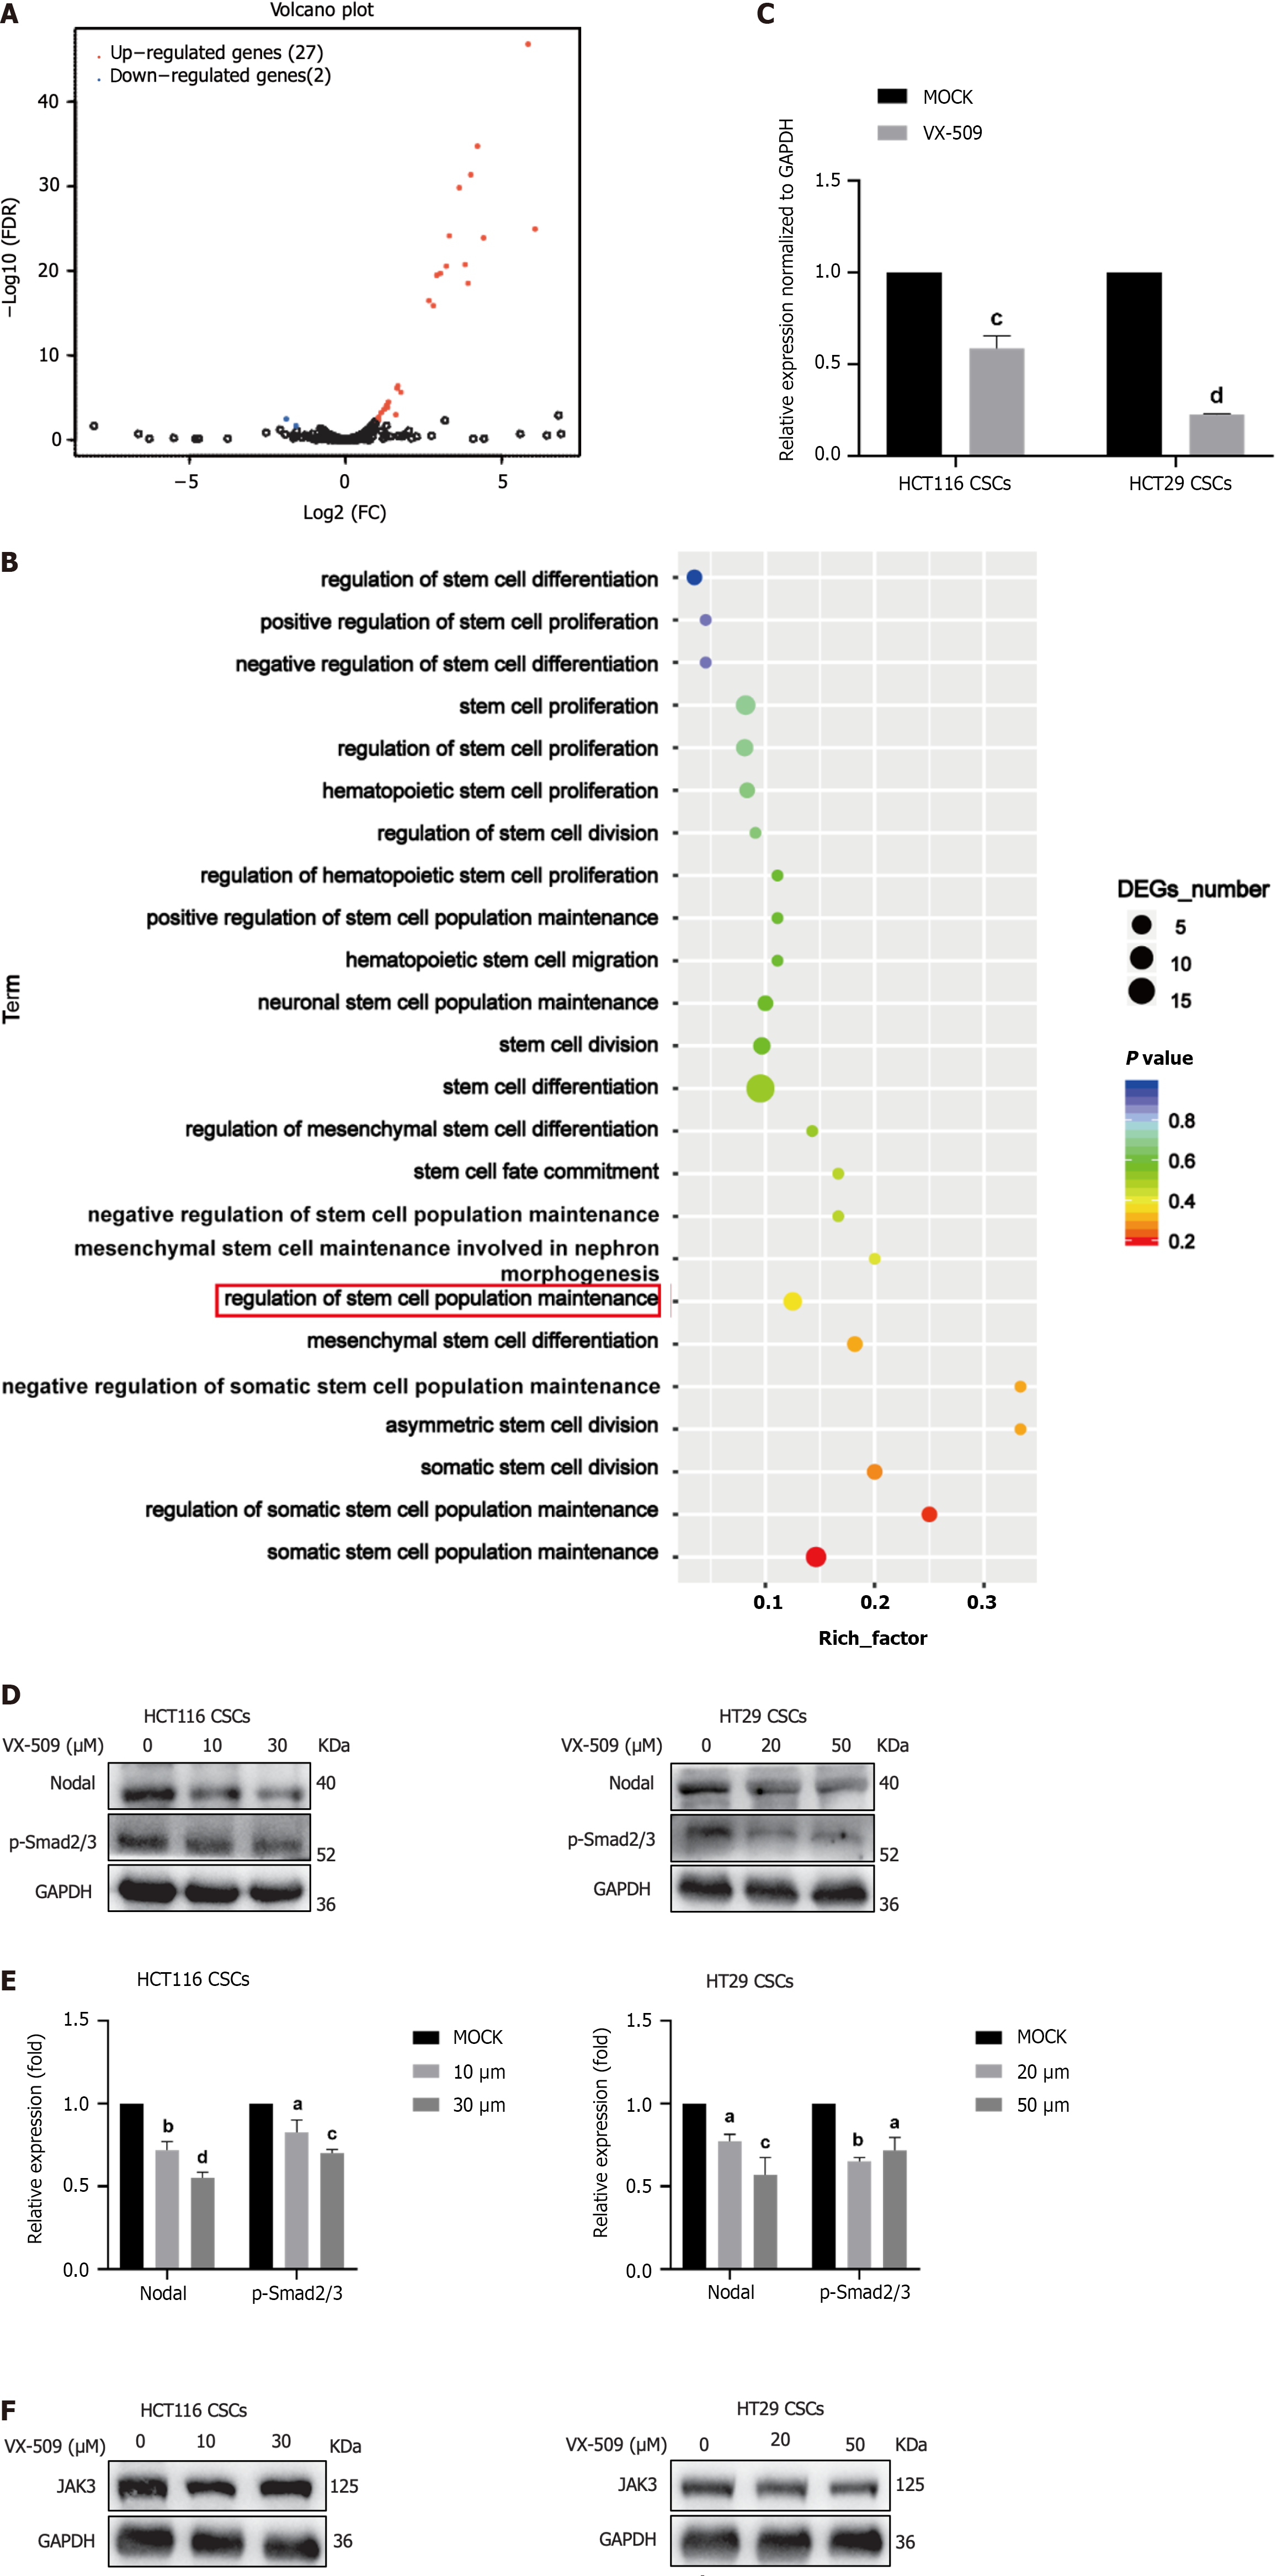
Figure 5 VX-509 downregulates Nodal and its downstream protein p-Smad2/3 in colorectal cancer-derived cancer stem cells.
A: Volcano plot of differentially expressed genes in the HT29 cancer stem cells (CSCs) Mock and VX-509-treated groups; B: Gene Ontology enrichment image of the differentially expressed genes; C: Nodal mRNA expression levels in the colorectal cancer (CRC)-derived CSCs Mock and VX-509-treated group; D-F: Protein expression levels of Nodal, p-Smad2/3 (D) and JAK3 (F) in CRC-derived CSCs treated with different concentrations of VX-509 (E). Densitometric analysis of Nodal and p-Smad2/3, normalized against GAPDH. n = 3. aP < 0.05, bP < 0.01, cP < 0.001, dP < 0.0001 compared to the HCT116 cancer stem cells Mock group and HT29 cancer stem cells Mock group. CSC: Cancer stem cell; DEG: Differentially expressed gene.
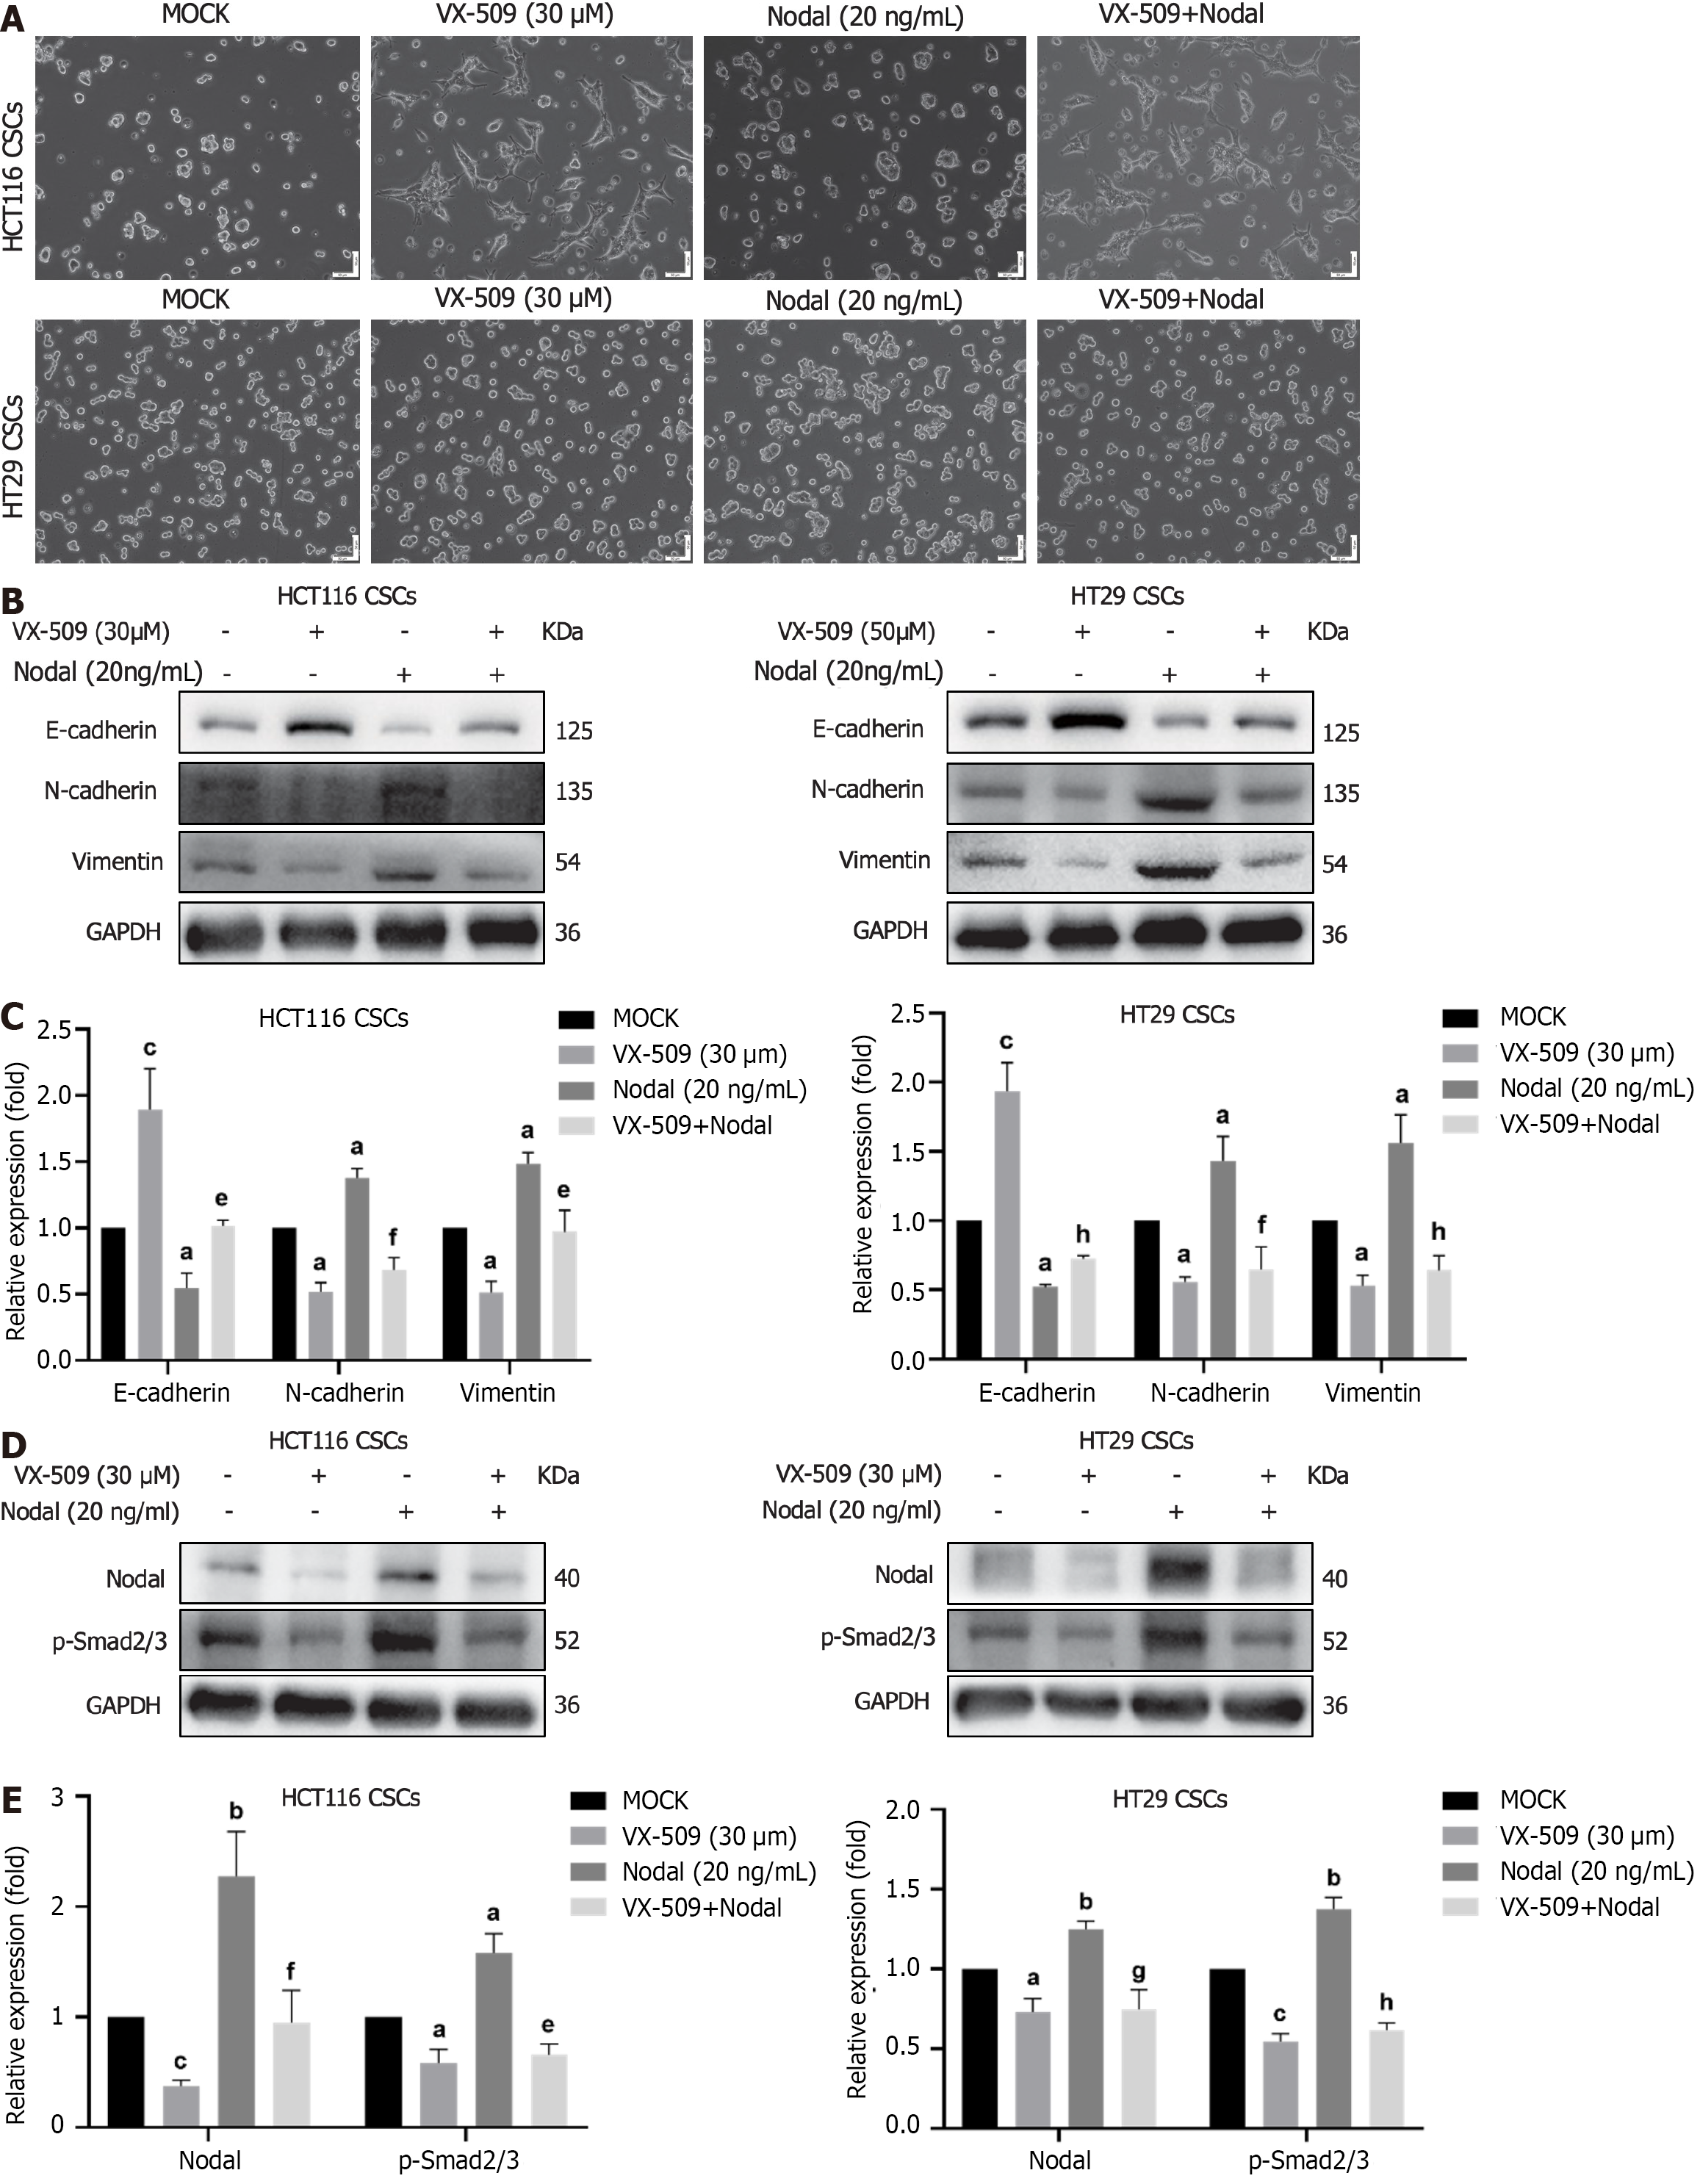
Figure 6 VX-509 reverses the increase in epithelial-mesenchymal transition progression induced by Nodal over expression in colorectal cancer-derived cancer stem cells.
A: Morphological changes in Nodal-stimulated colorectal cancer (CRC)-derived cancer stem cells (CSCs) treated with different concentrations of VX-509 observed via microscopy; B and C: The effects of VX-509 on the protein expression levels of E-cadherin, N-cadherin, and vimentin in Nodal-stimulated CRC-derived CSCs were detected by western blot and relative statistical analysis, normalized against GAPDH; D and E: The effects of VX-509 on the protein expression levels of Nodal and p-Smad2/3 in Nodal-stimulated CRC-derived CSCs were detected by western blot and relative statistical analysis, normalized against GAPDH. n = 3. aP < 0.05, cP < 0.001, eP < 0.05 compared to the HCT116 cancer stem cells Mock group and HT29 cancer stem cells Mock group. fP < 0.05, gP < 0.01, hP < 0.0001 compared to the HCT116 cancer stem cells Nodal group and HT29 CSCs Nodal group.
- Citation: Yuan Y, Zhang XF, Li YC, Chen HQ, Wen T, Zheng JL, Zhao ZY, Hu QY. VX-509 attenuates the stemness characteristics of colorectal cancer stem-like cells by regulating the epithelial-mesenchymal transition through Nodal/Smad2/3 signaling. World J Stem Cells 2024; 16(2): 207-227
- URL: https://www.wjgnet.com/1948-0210/full/v16/i2/207.htm
- DOI: https://dx.doi.org/10.4252/wjsc.v16.i2.207


