Copyright
©The Author(s) 2024.
World J Stem Cells. Dec 26, 2024; 16(12): 1086-1105
Published online Dec 26, 2024. doi: 10.4252/wjsc.v16.i12.1086
Published online Dec 26, 2024. doi: 10.4252/wjsc.v16.i12.1086
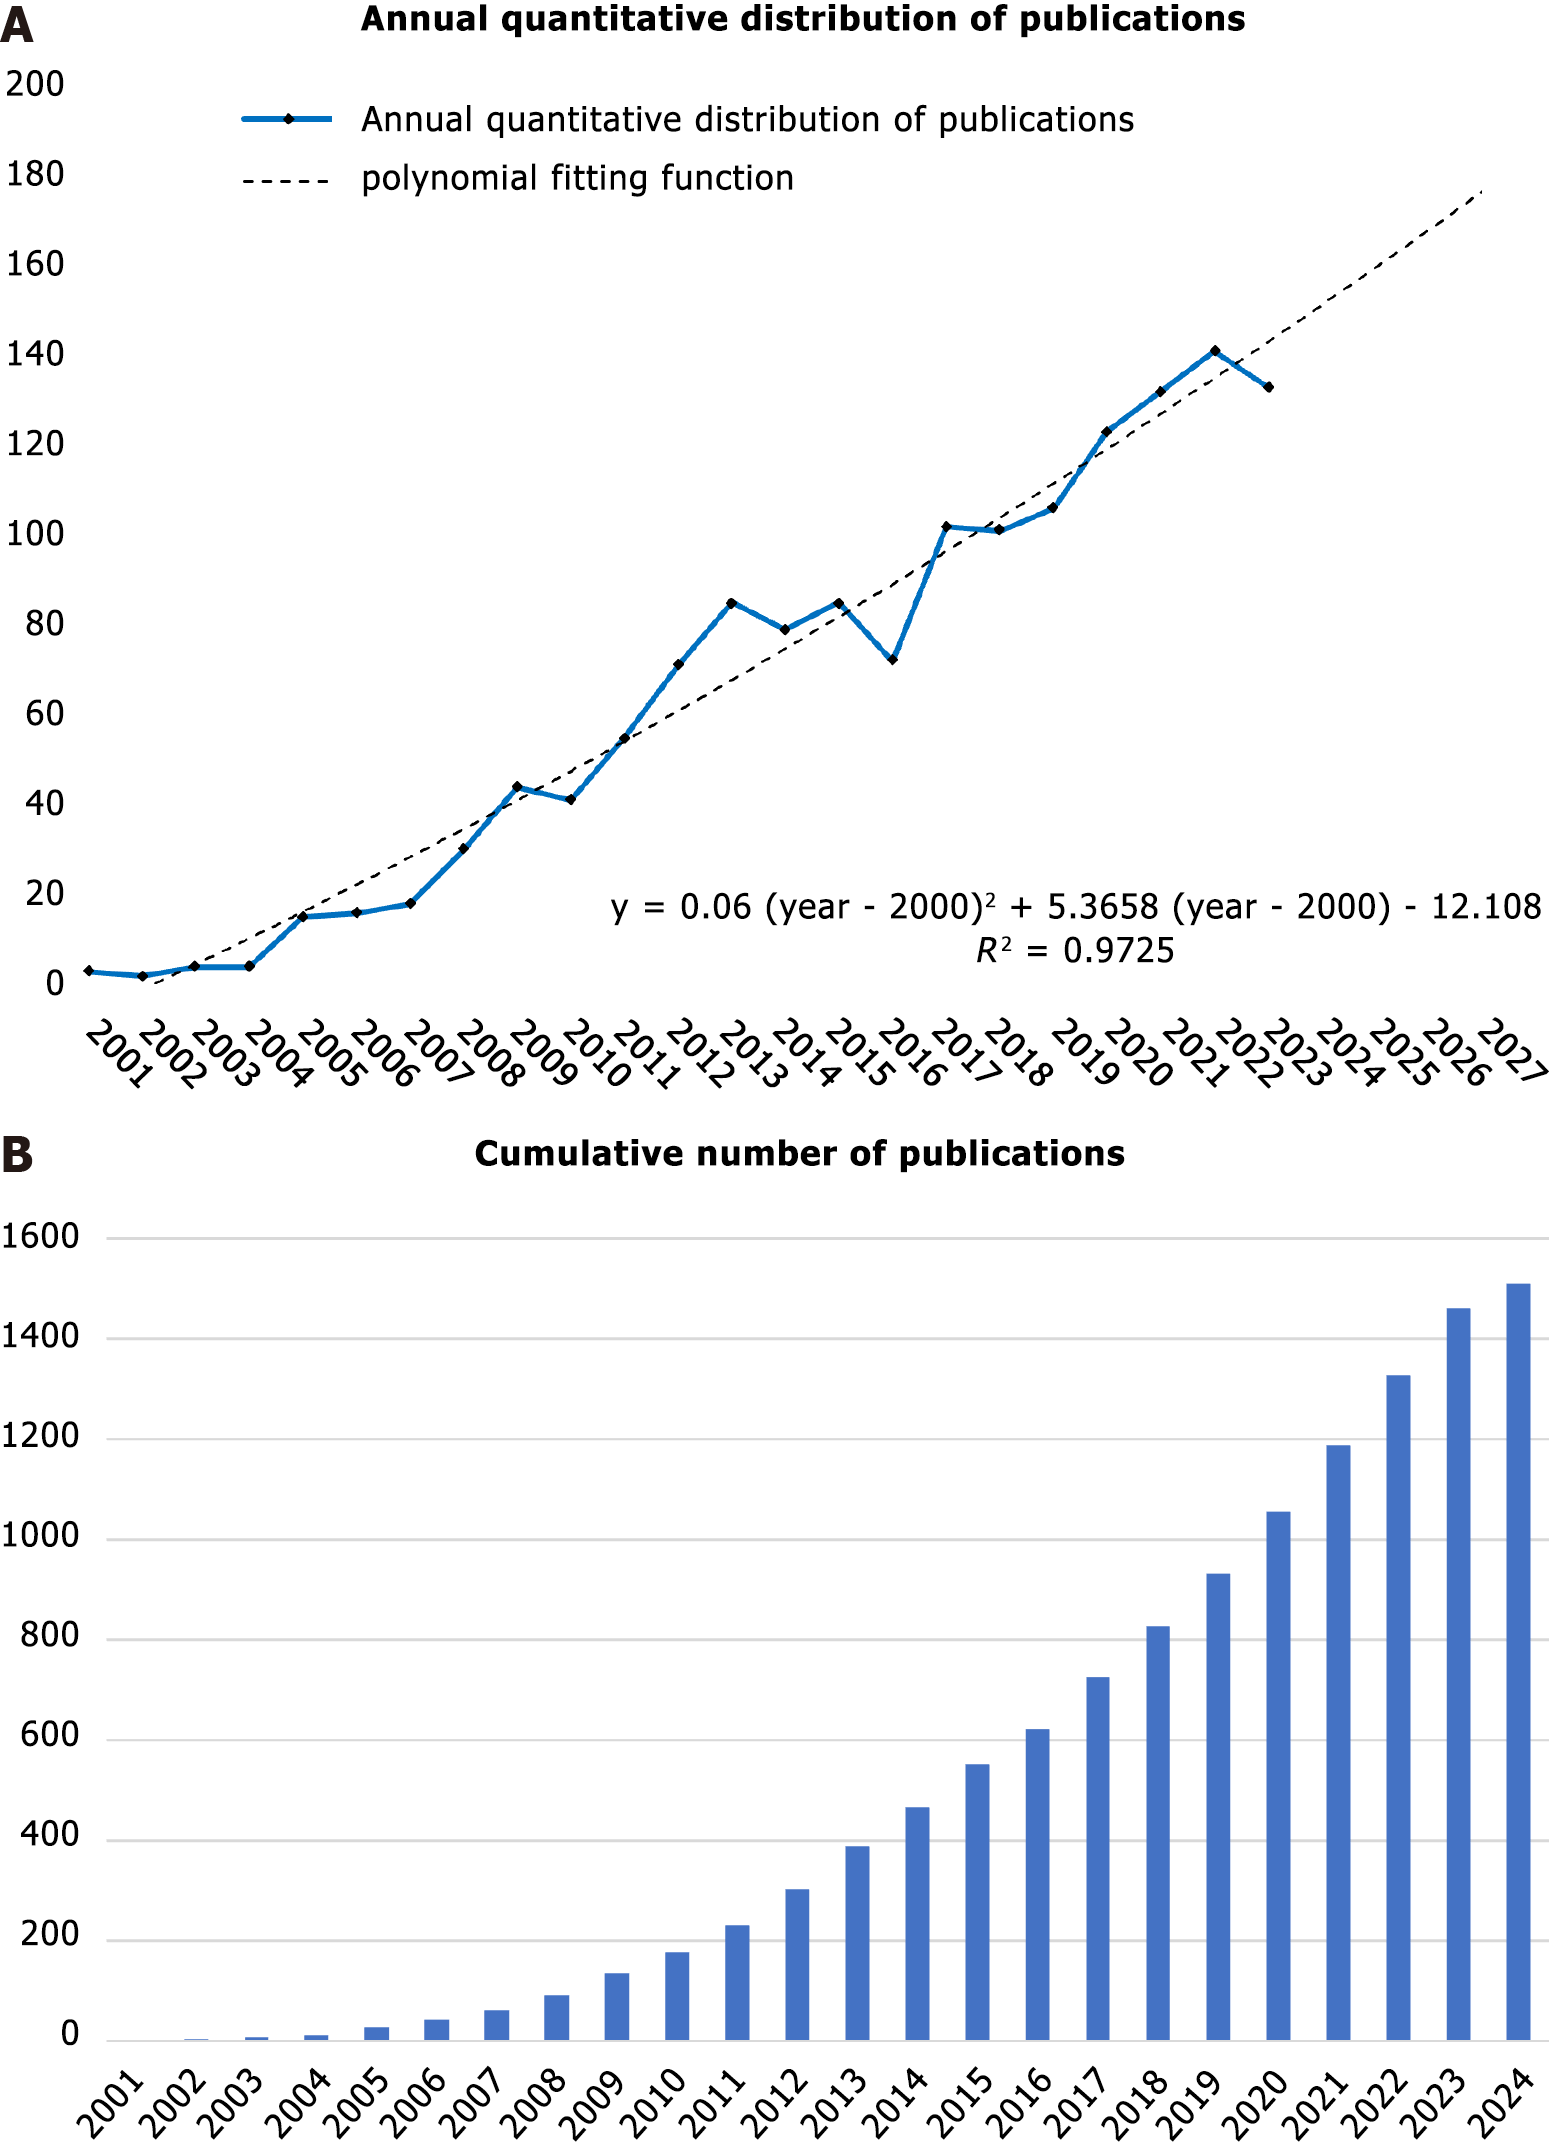
Figure 1 Publication output for myocardial fibrosis and stem cells.
A: Annual quantitative distribution of publications (the solid line) and the polynomial fitting function (the dotted line). Y-axis represents the number of articles and X-axis represents the year; B: Cumulative number of publications by year.
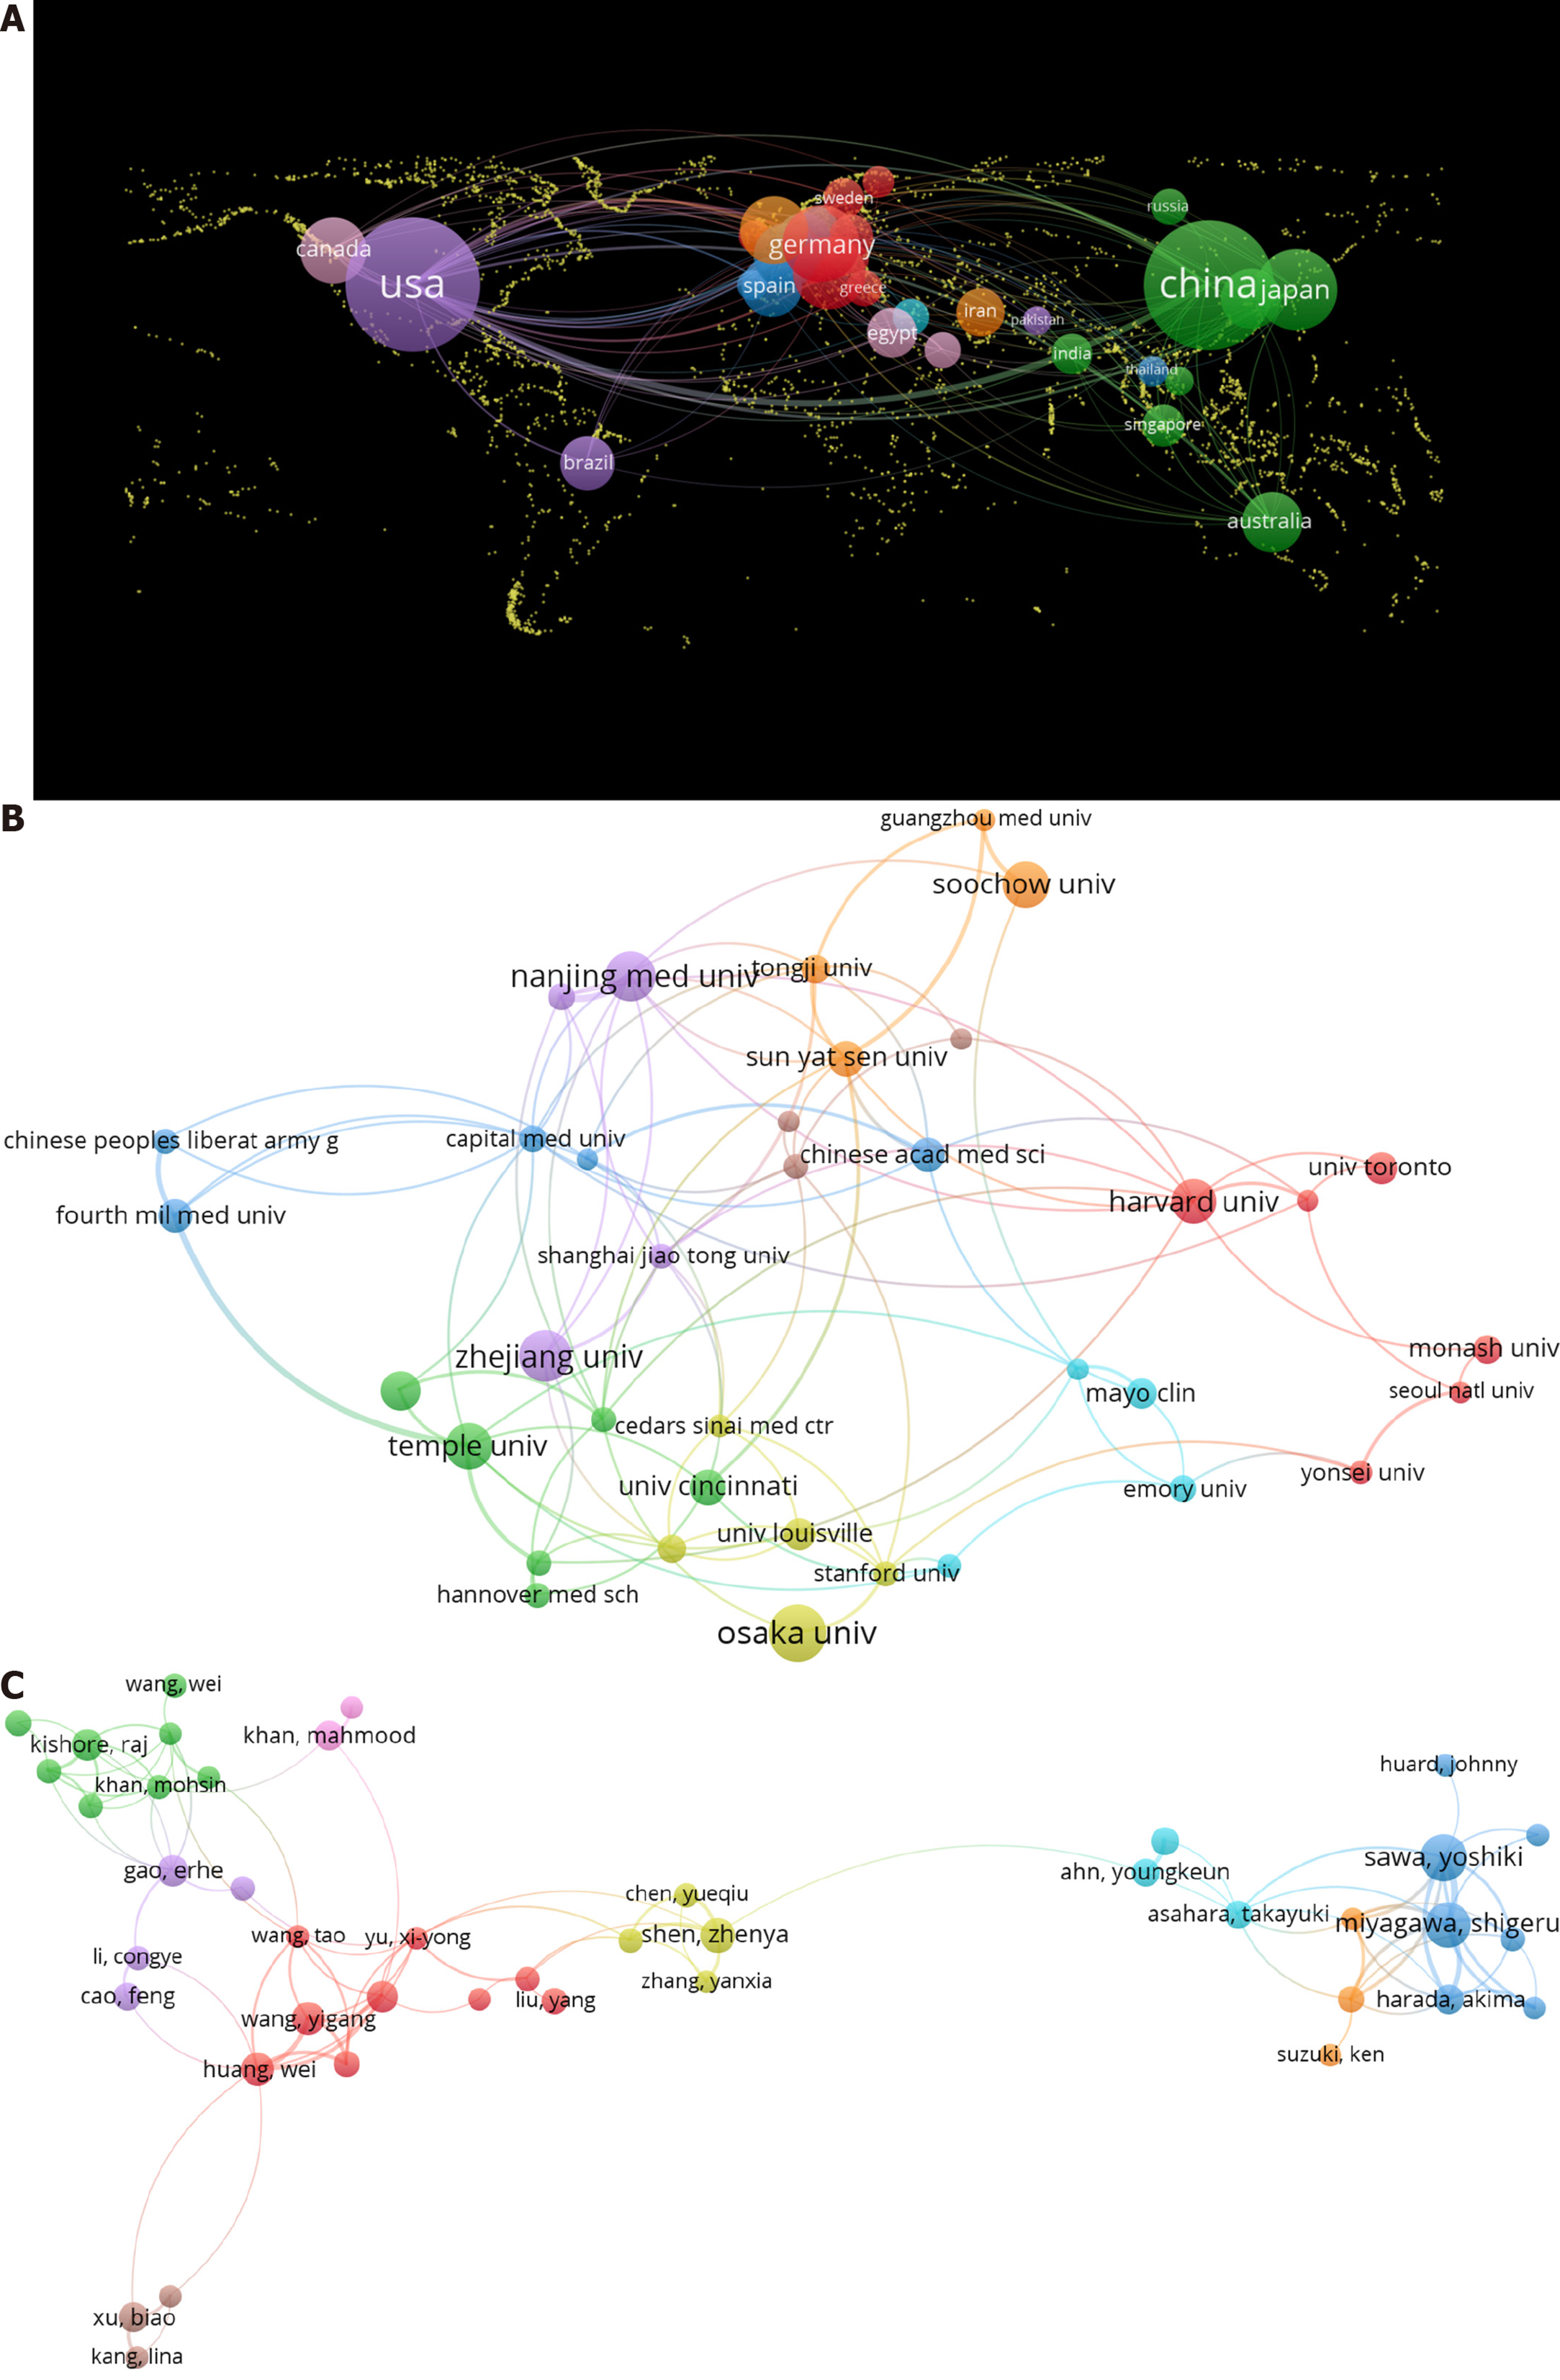
Figure 2 Contributions of countries/regions, contributions and collaborations between organizations, and contributions and collaborations of authors in myocardial fibrosis and stem cell research.
A: Contributions of countries/regions in myocardial fibrosis and stem cell research. The colors represent different clusters of collaborative relationships, with countries/regions of the same color being more closely connected. The scale of the labels indicates the number of publications, with larger labels representing a higher volume of publications; B: Contributions and collaborations between organizations in myocardial fibrosis and stem cell research. The colors represent different clusters of collaborative relationships, with organizations of the same color being more closely connected. The scale of the labels indicates the number of publications, with larger labels representing a higher volume of publications; C: Contributions and collaborations of authors in myocardial fibrosis and stem cell research. The colors represent different clusters of collaborative relationships, with authors of the same color being more closely connected. The scale of the labels indicates the number of publications, with larger labels representing a higher volume of publications.
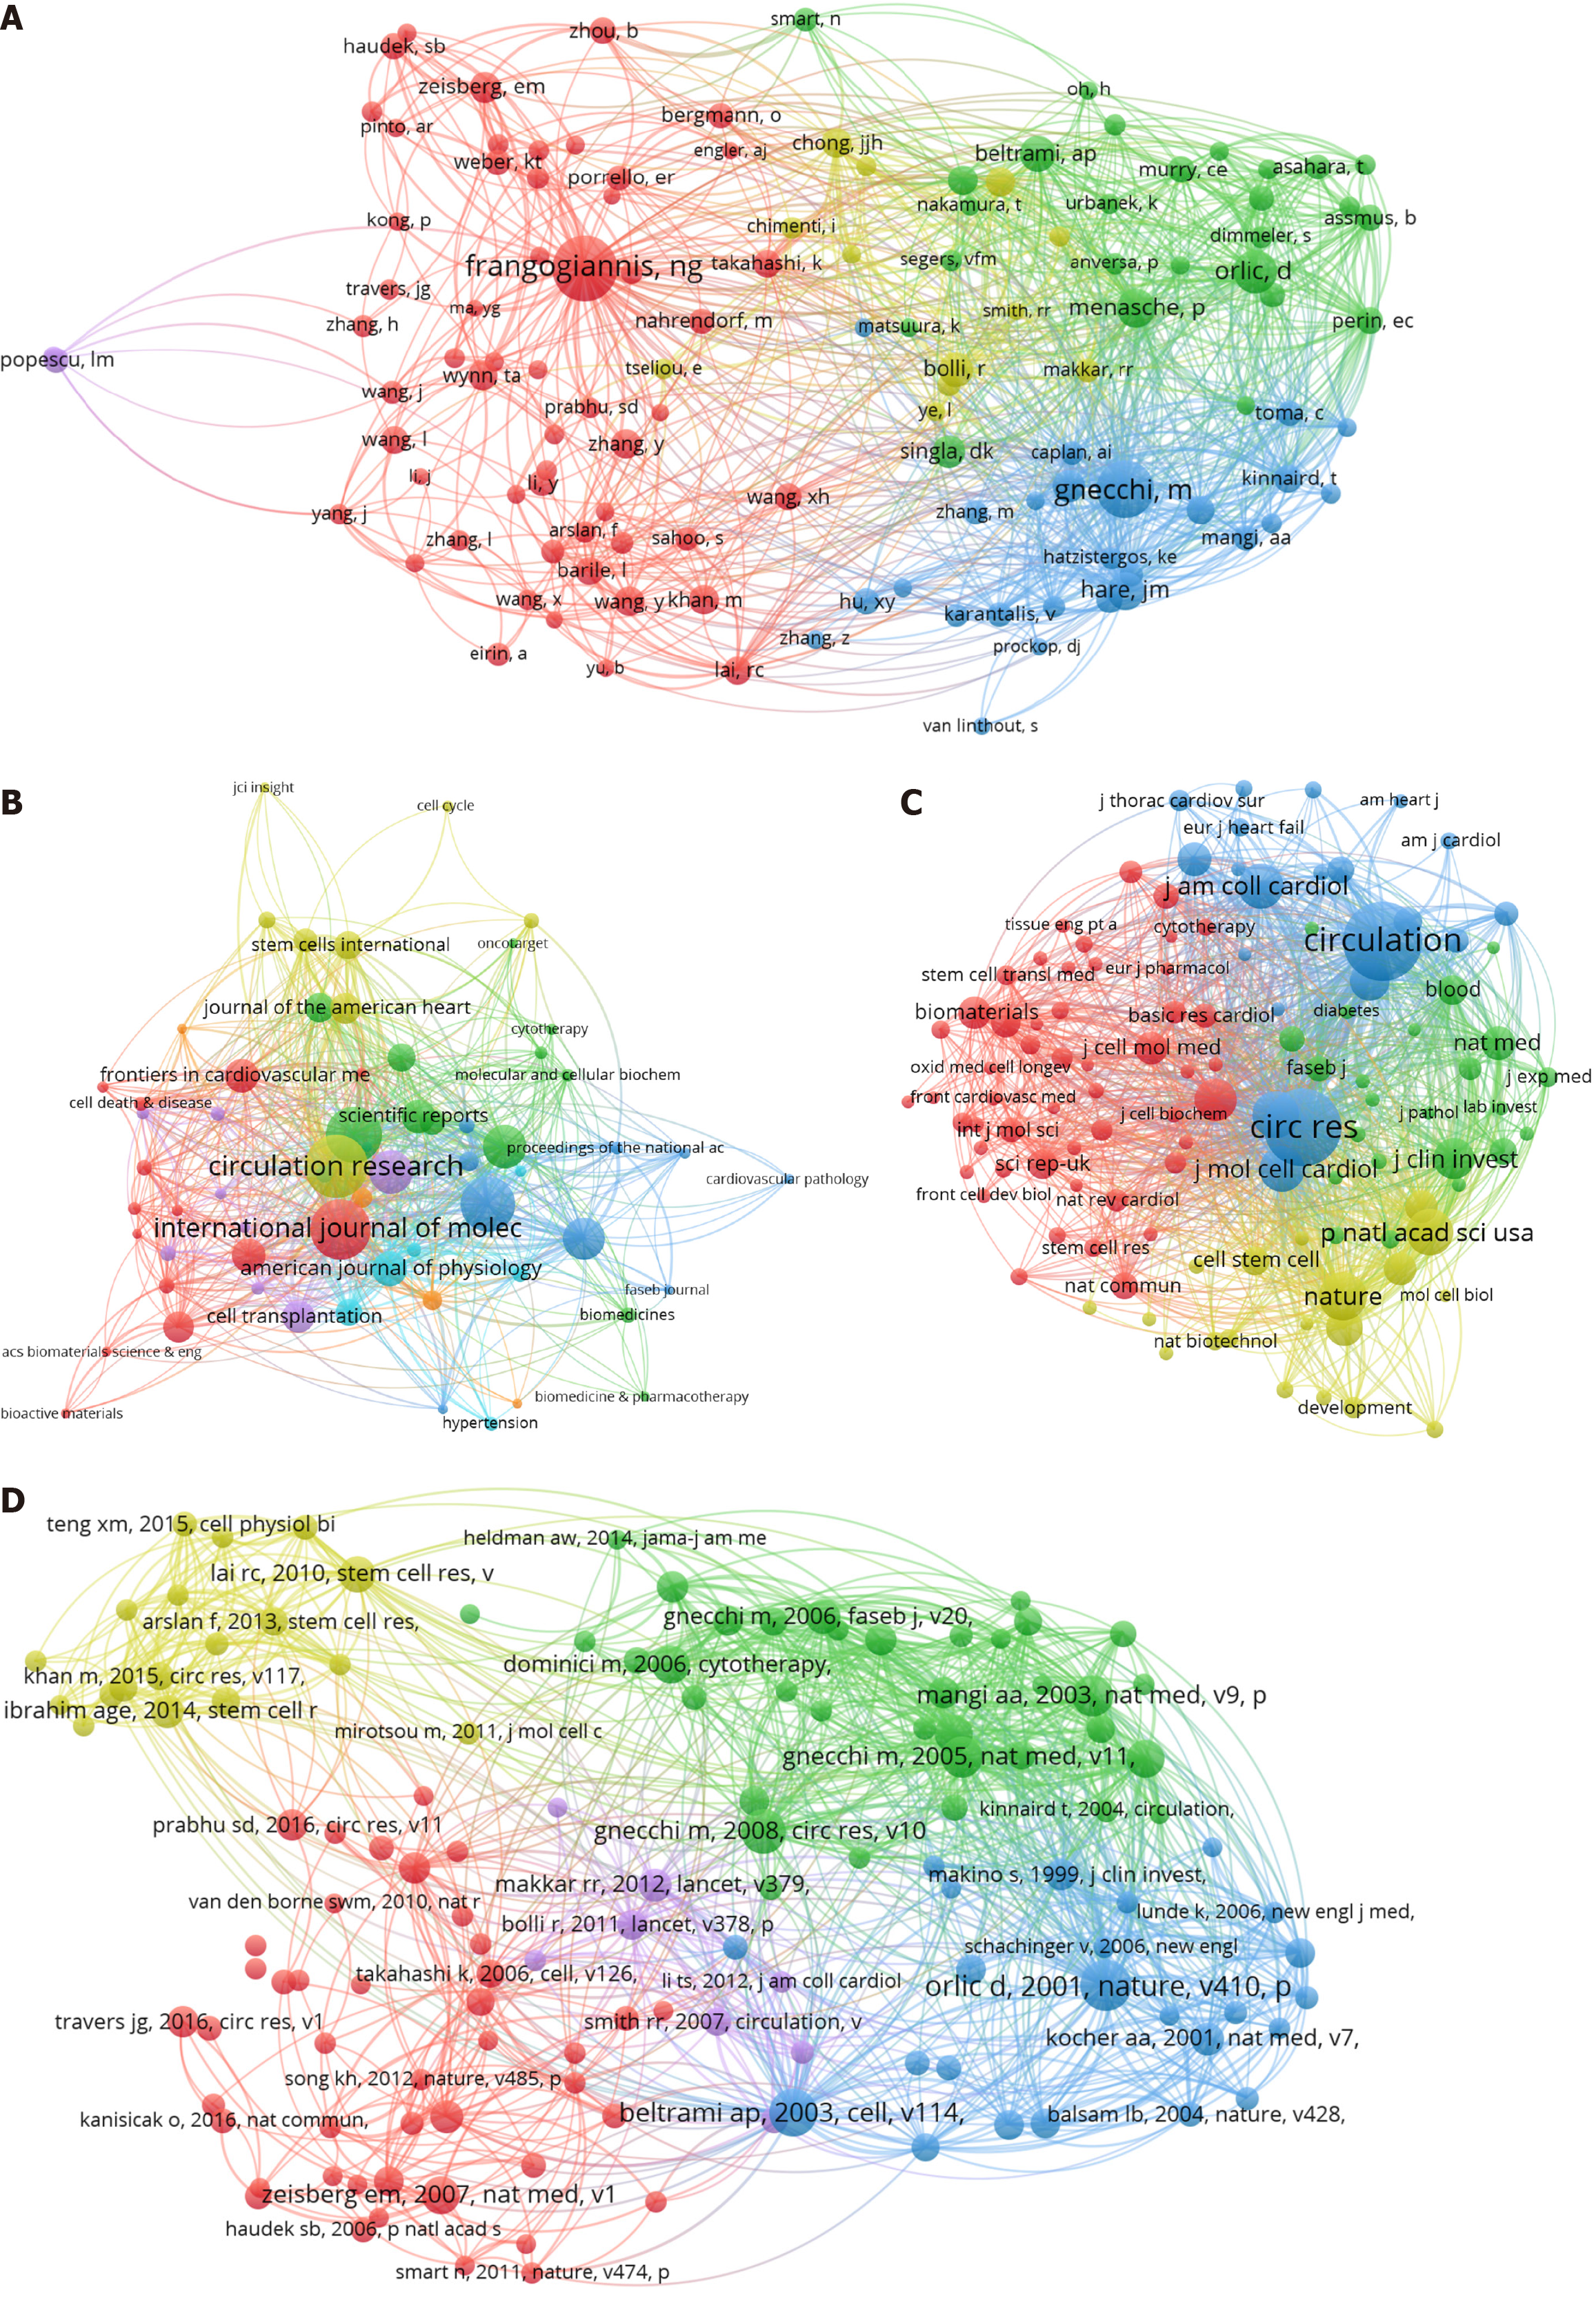
Figure 3 Distribution of co-cited authors, journals, co-cited journals, and co-cited references in myocardial fibrosis and stem cell research.
A: Distribution of co-cited authors in myocardial fibrosis and stem cell research. The colors represent different clusters of collaborative relationships, with co-cited authors of the same color being more closely connected. The scale of the labels indicates the number of citations, with larger labels representing a higher volume of citations; B: Distribution of journals in myocardial fibrosis and stem cell research. The colors represent different clusters of collaborative relationships, with journals of the same color being more closely connected. The scale of the labels indicates the number of publications, with larger labels representing a higher volume of publications; C: Distribution of co-cited journals in myocardial fibrosis and stem cell research. The colors represent different clusters of collaborative relationships, with co-cited journals of the same color being more closely connected. The scale of the labels indicates the number of citations, with larger labels representing a higher volume of citations; D: Distribution of co-cited references in myocardial fibrosis and stem cell research. The colors represent different clusters of collaborative relationships, with co-cited references of the same color being more closely connected. The scale of the labels indicates the number of citations, with larger labels representing a higher volume of citations.
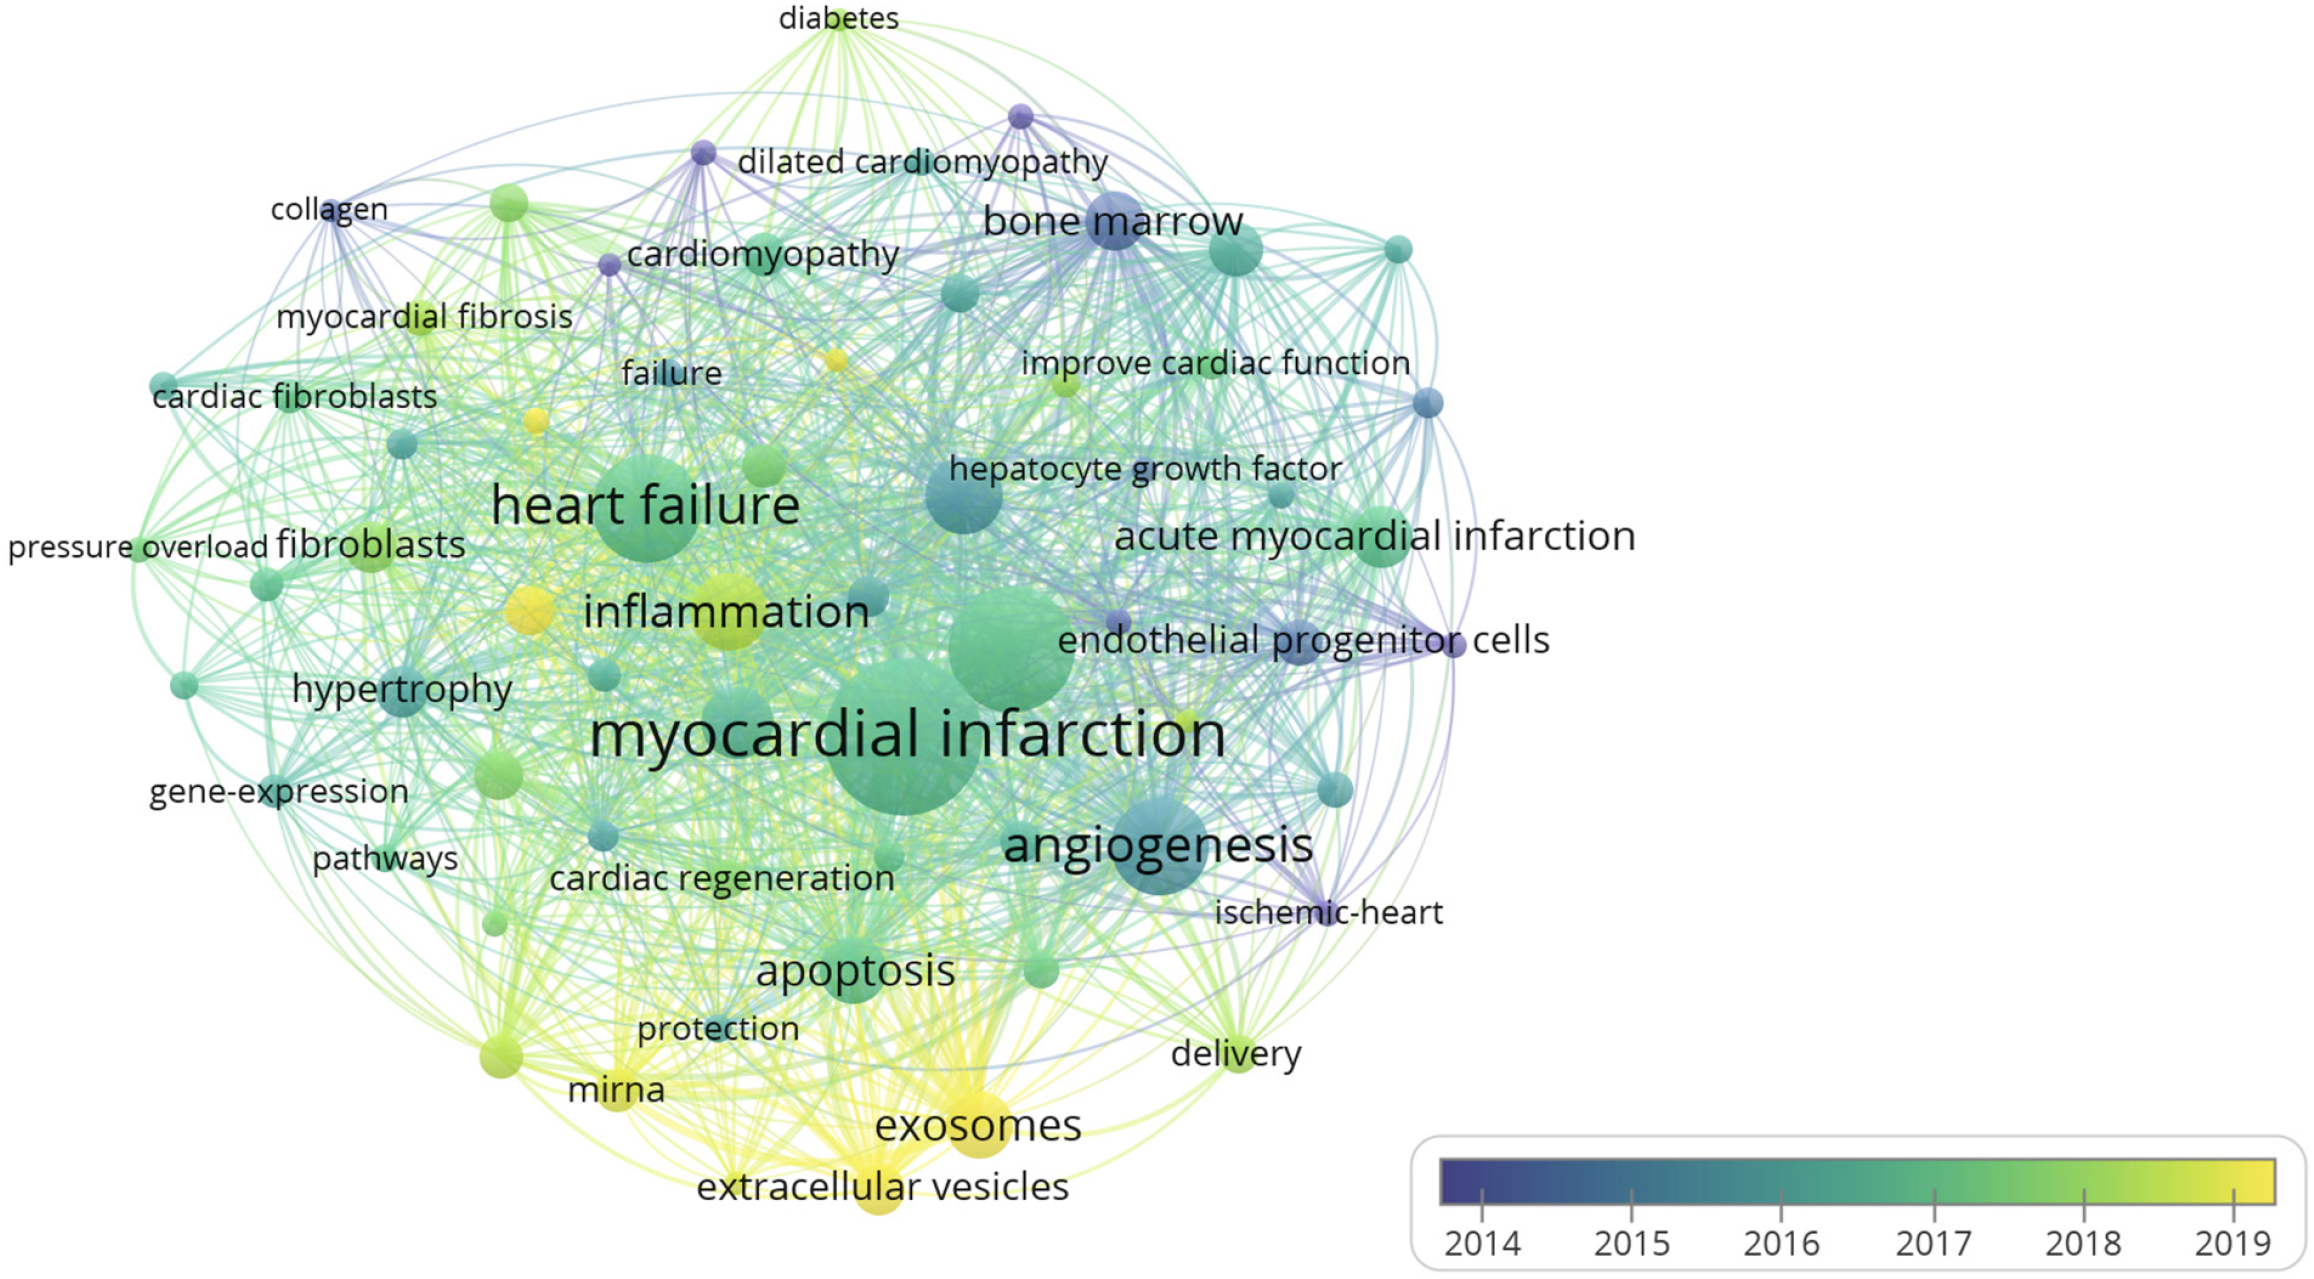
Figure 4 Overlay visualization map of co-occurring keywords related to myocardial fibrosis and stem cells.
The colors reflect the research activity or development stages over time, with early studies typically shown in blue and more recent ones in yellow. The scale of the labels indicates the number of occurrences, with larger labels representing a higher volume of occurrences.
- Citation: Ding JY, Meng TT, Du RL, Song XB, Li YX, Gao J, Ji R, He QY. Bibliometrics of trends in global research on the roles of stem cells in myocardial fibrosis therapy. World J Stem Cells 2024; 16(12): 1086-1105
- URL: https://www.wjgnet.com/1948-0210/full/v16/i12/1086.htm
- DOI: https://dx.doi.org/10.4252/wjsc.v16.i12.1086


