Copyright
©The Author(s) 2024.
World J Stem Cells. Dec 26, 2024; 16(12): 1047-1061
Published online Dec 26, 2024. doi: 10.4252/wjsc.v16.i12.1047
Published online Dec 26, 2024. doi: 10.4252/wjsc.v16.i12.1047
Figure 1 Comparison of DNA and collagen content among the various groups.
A: DNA content in each group; B: Collagen content in each group. aP < 0.05 vs control group; n = 3.
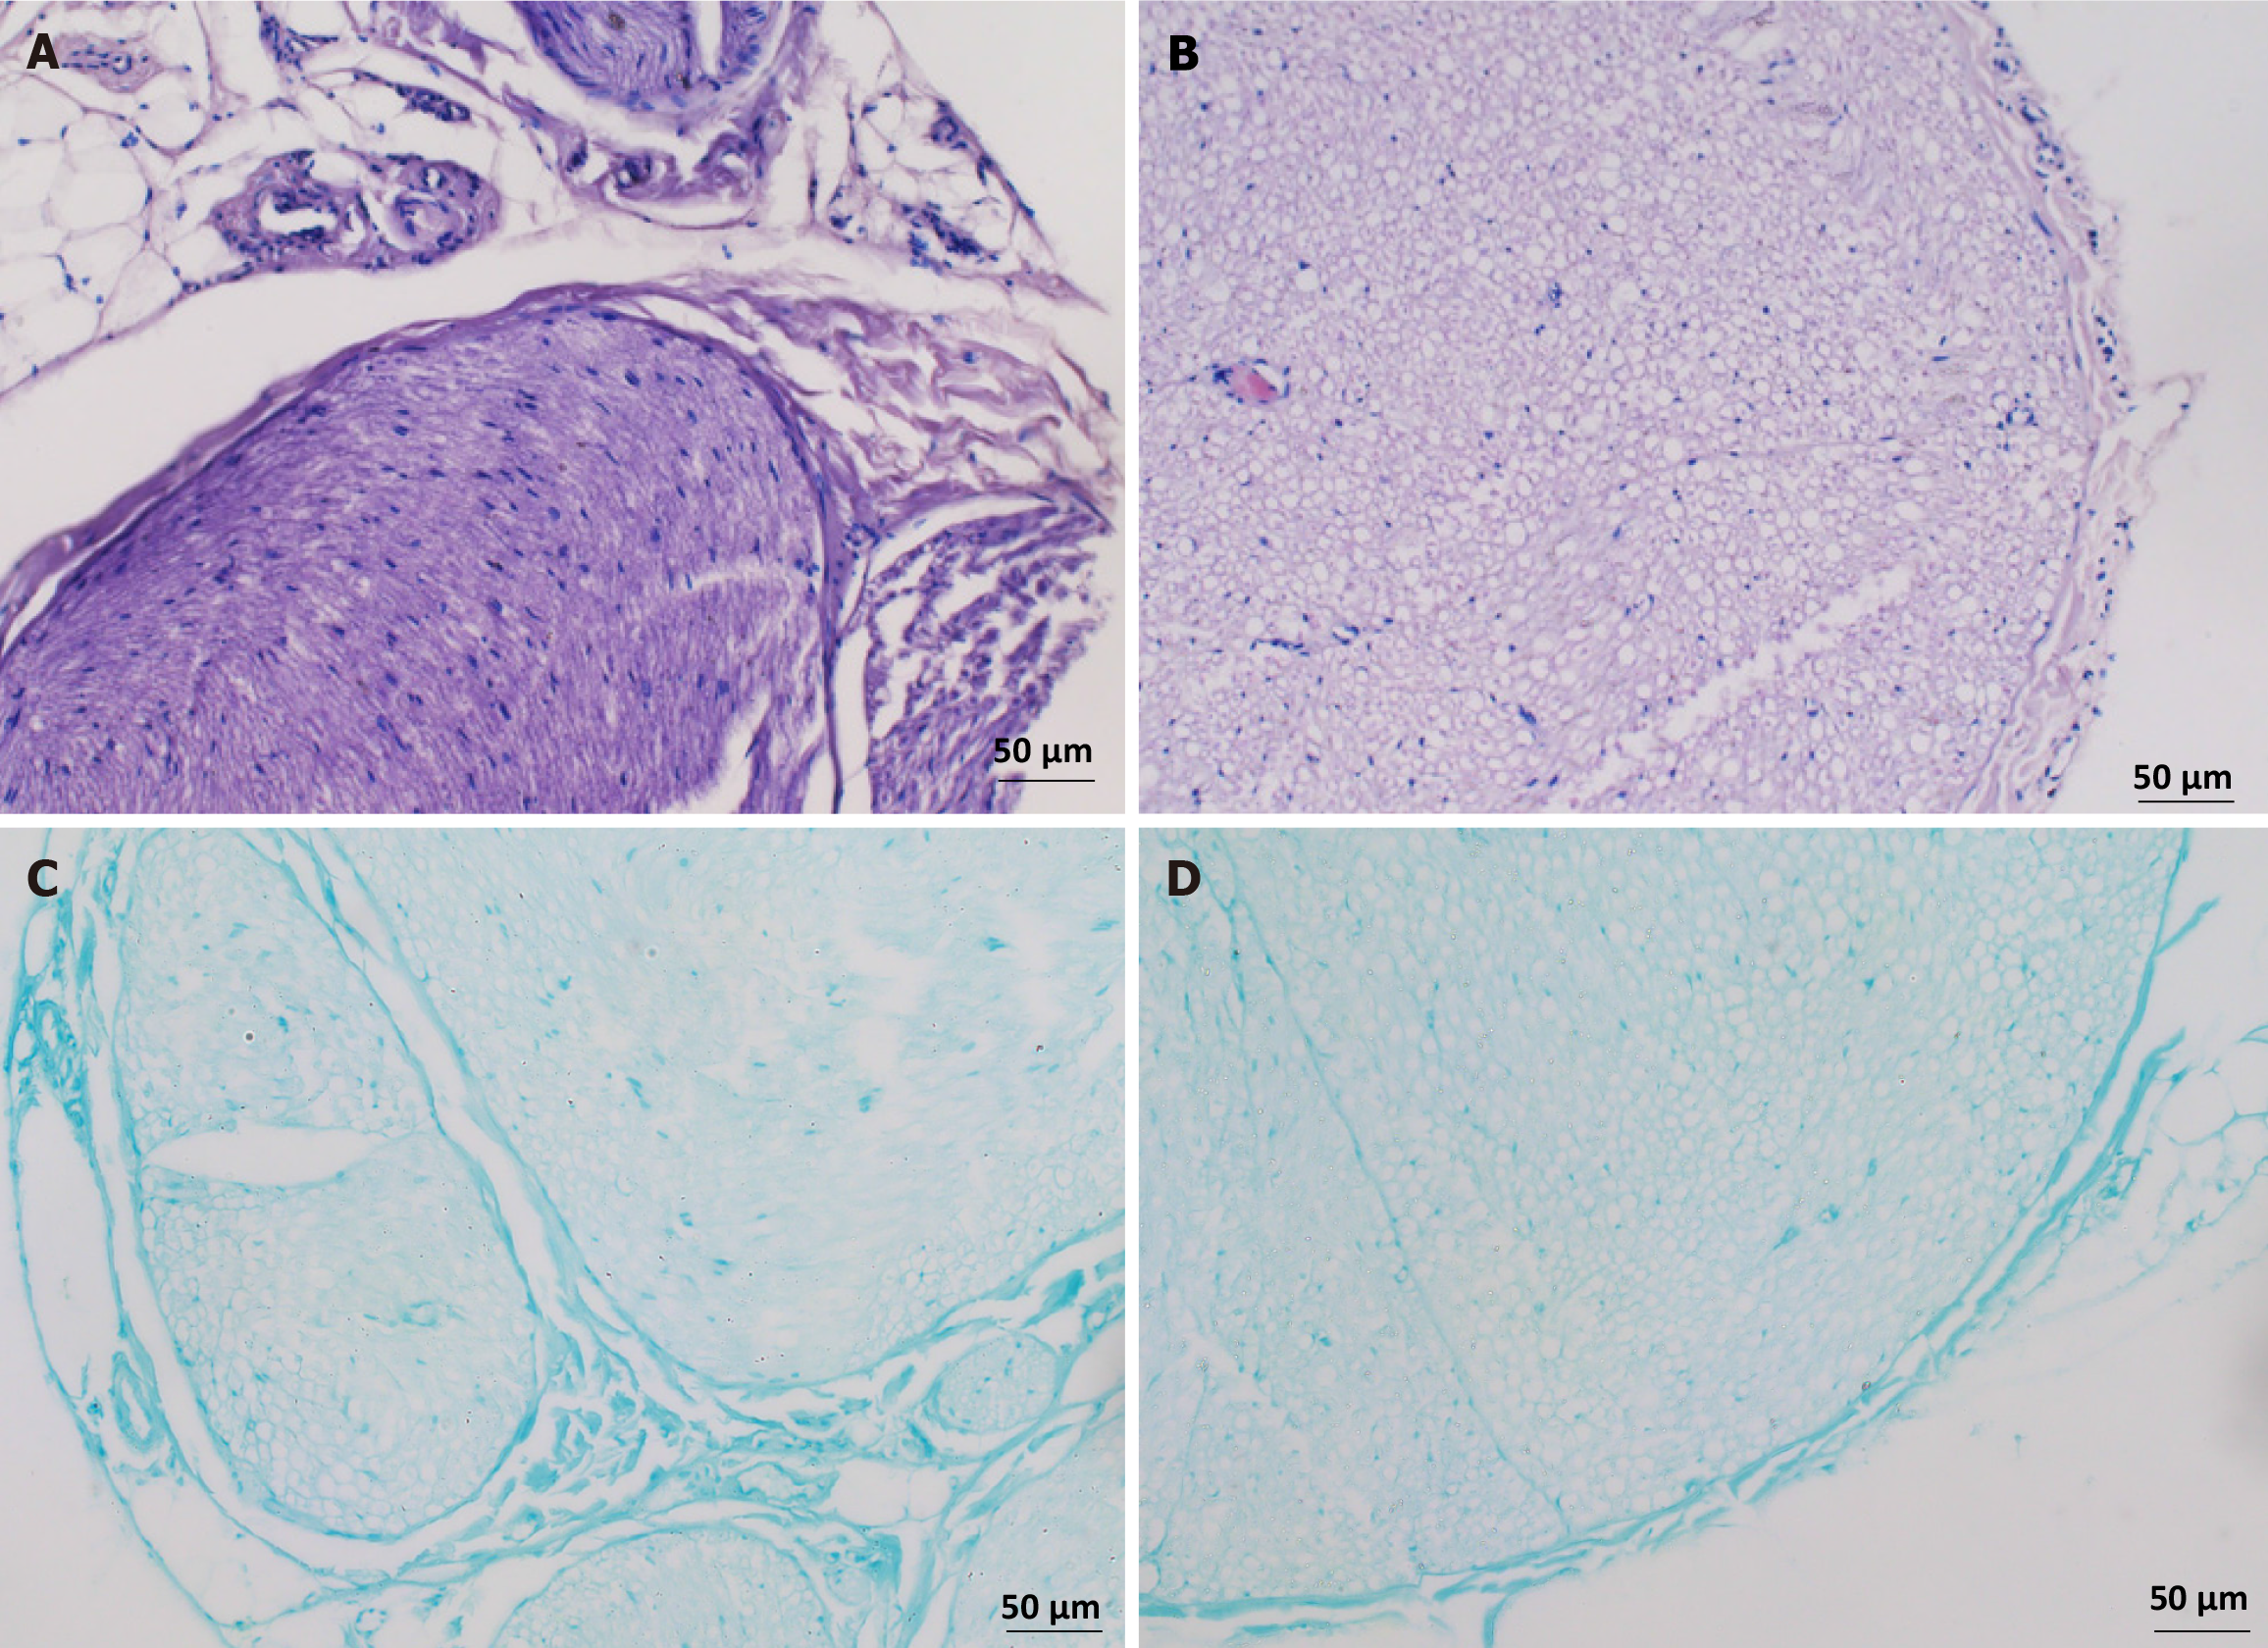
Figure 2 Histological observation of acellular scaffolds.
A: Hematoxylin and eosin (HE) staining shows the peripheral nerve fibers enveloped by the perineurium and a large amount of nuclear components may be seen in the peripheral nerves; B: After decellularization, the matrix structure of the HE-stained nerve fibers is preserved; however, the cell structure is no longer visible; C: Luxol fast blue (LFB) staining of peripheral nerve tissue reveals significant blue staining of myelin sheath tissue; D: LFB staining shows decreased staining of decellularized nerve tissue and myelin sheaths.
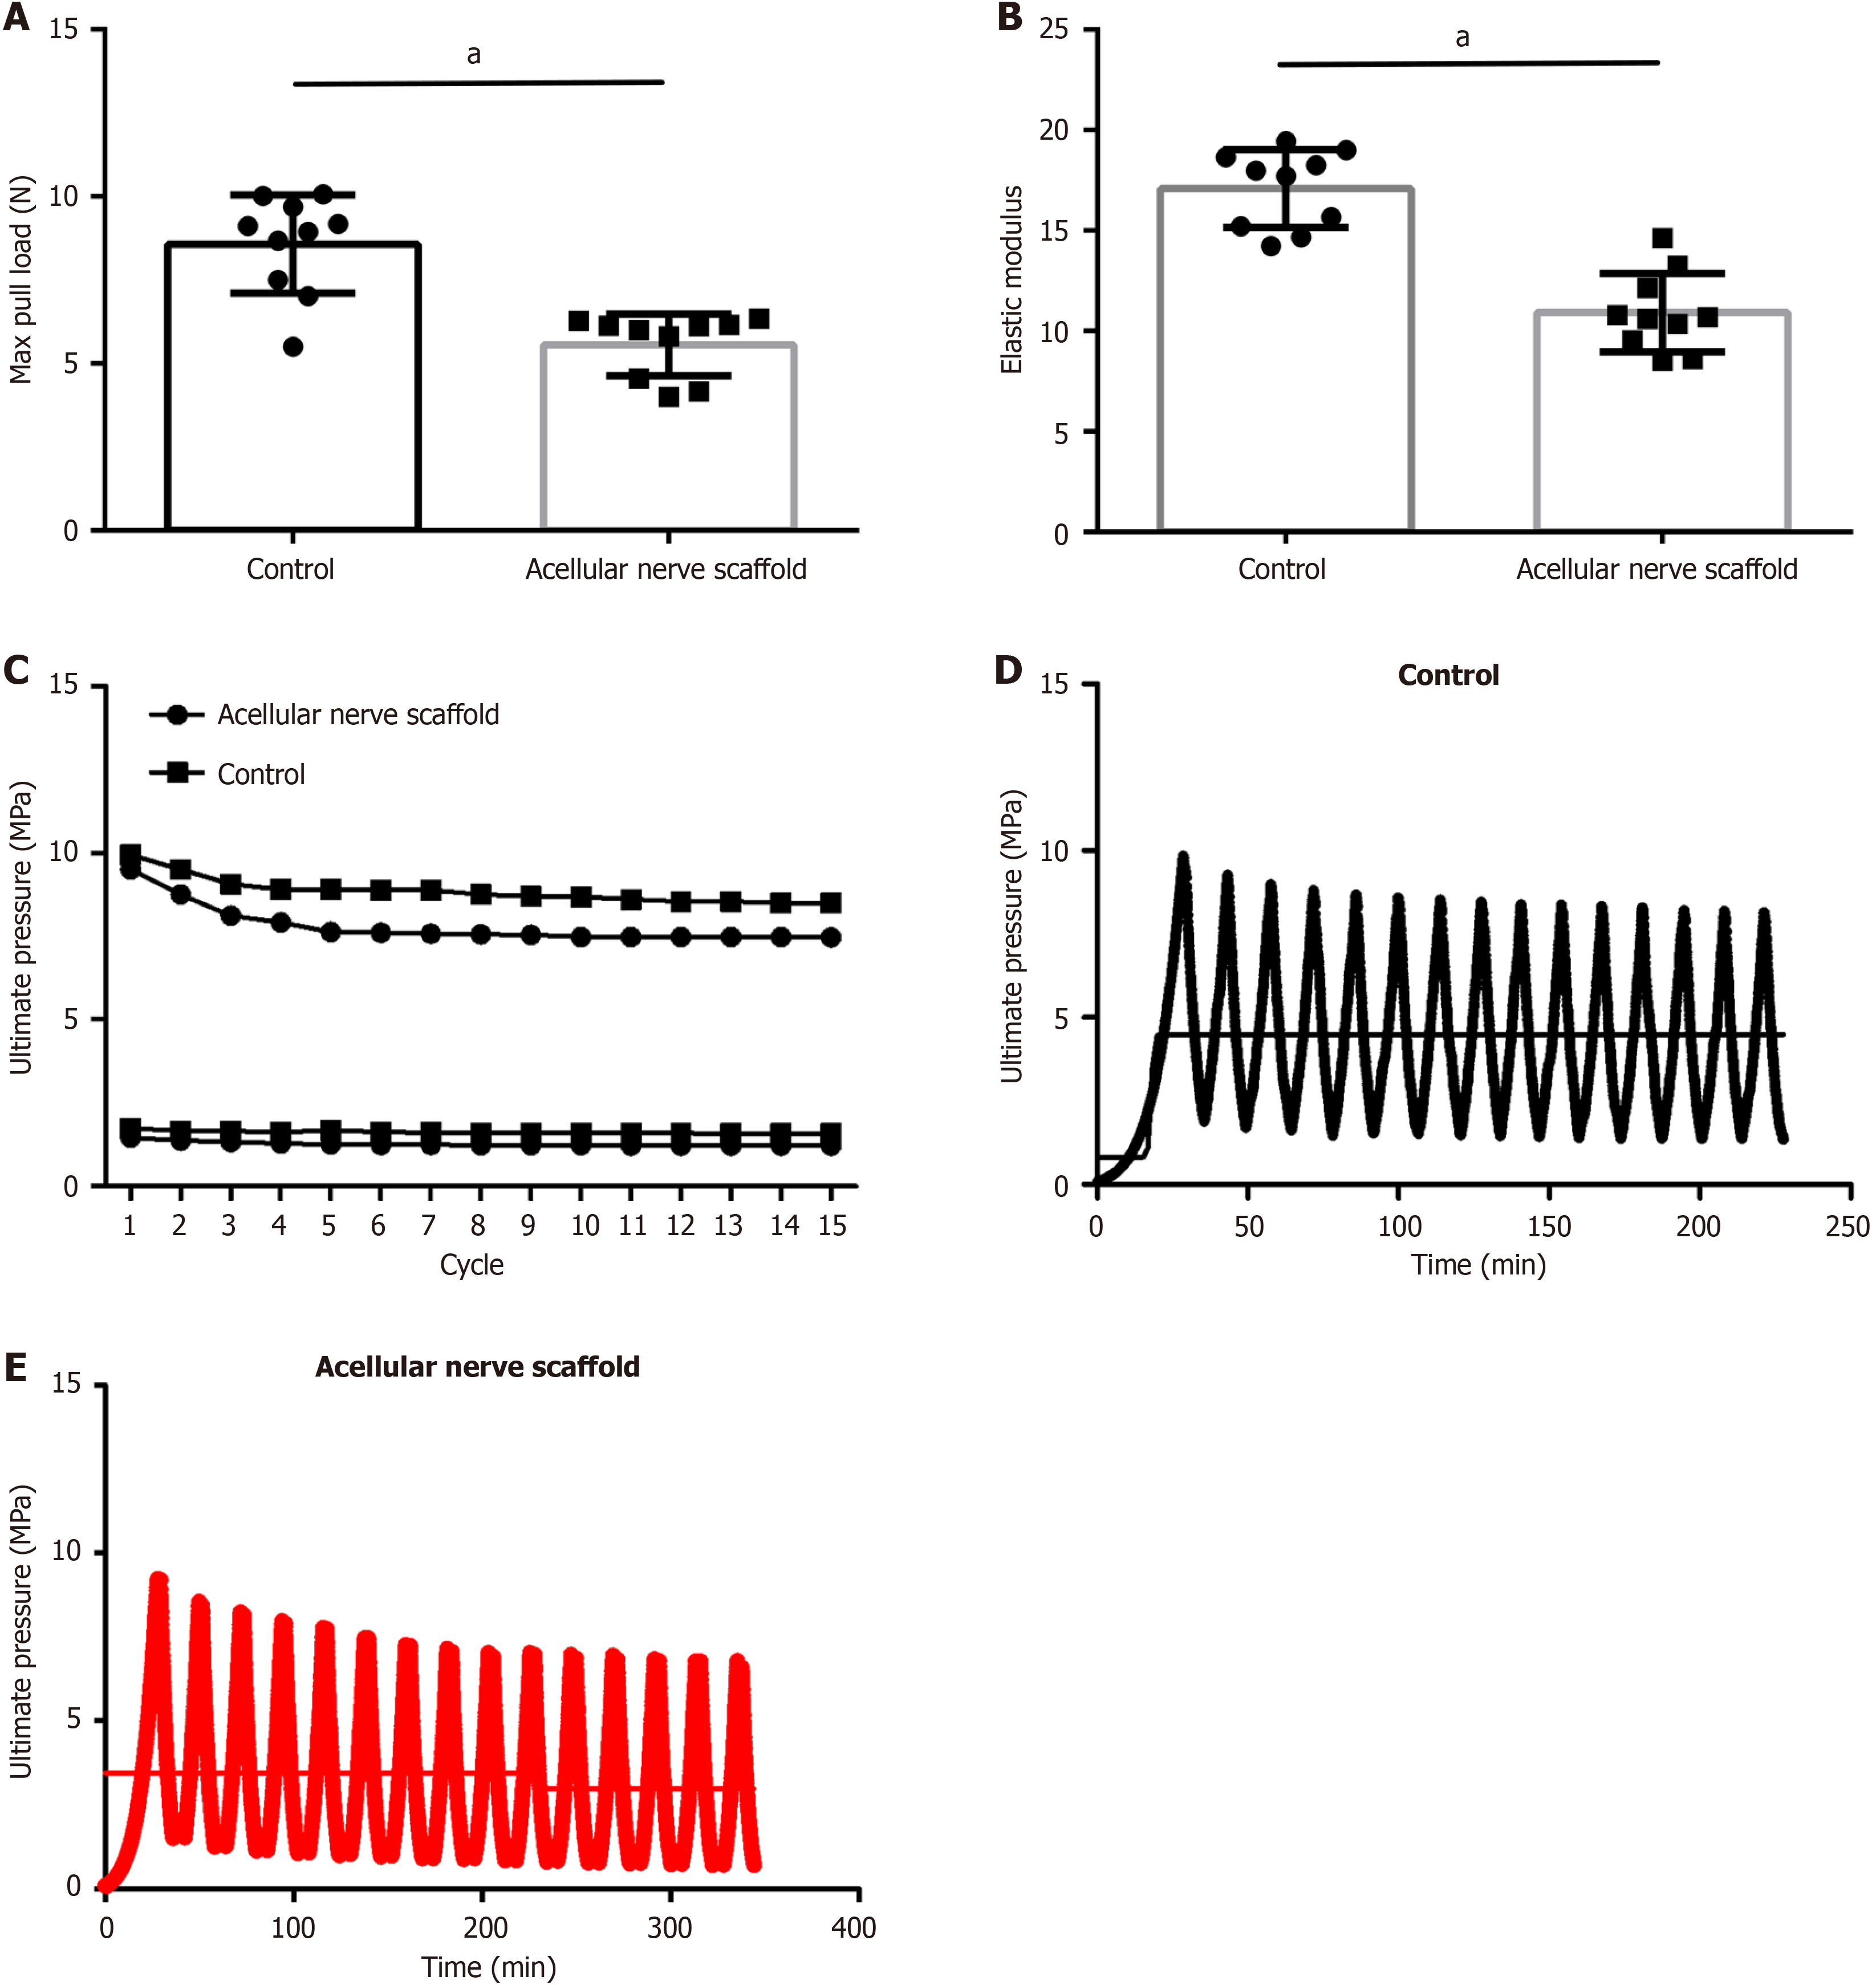
Figure 3 Mechanical properties of the acellular scaffolds.
A: Comparison of the maximum load between acellular scaffolds and peripheral nerves; B: Comparison of elastic modulus between acellular scaffolds and peripheral nerves; C: Stress durability test of acellular scaffolds and peripheral nerves; D: Stress-time diagram of peripheral nerves; E: Stress-time relationship of acellular scaffolds. aP < 0.0001 (control vs acellular nerve scaffolds); n = 10.
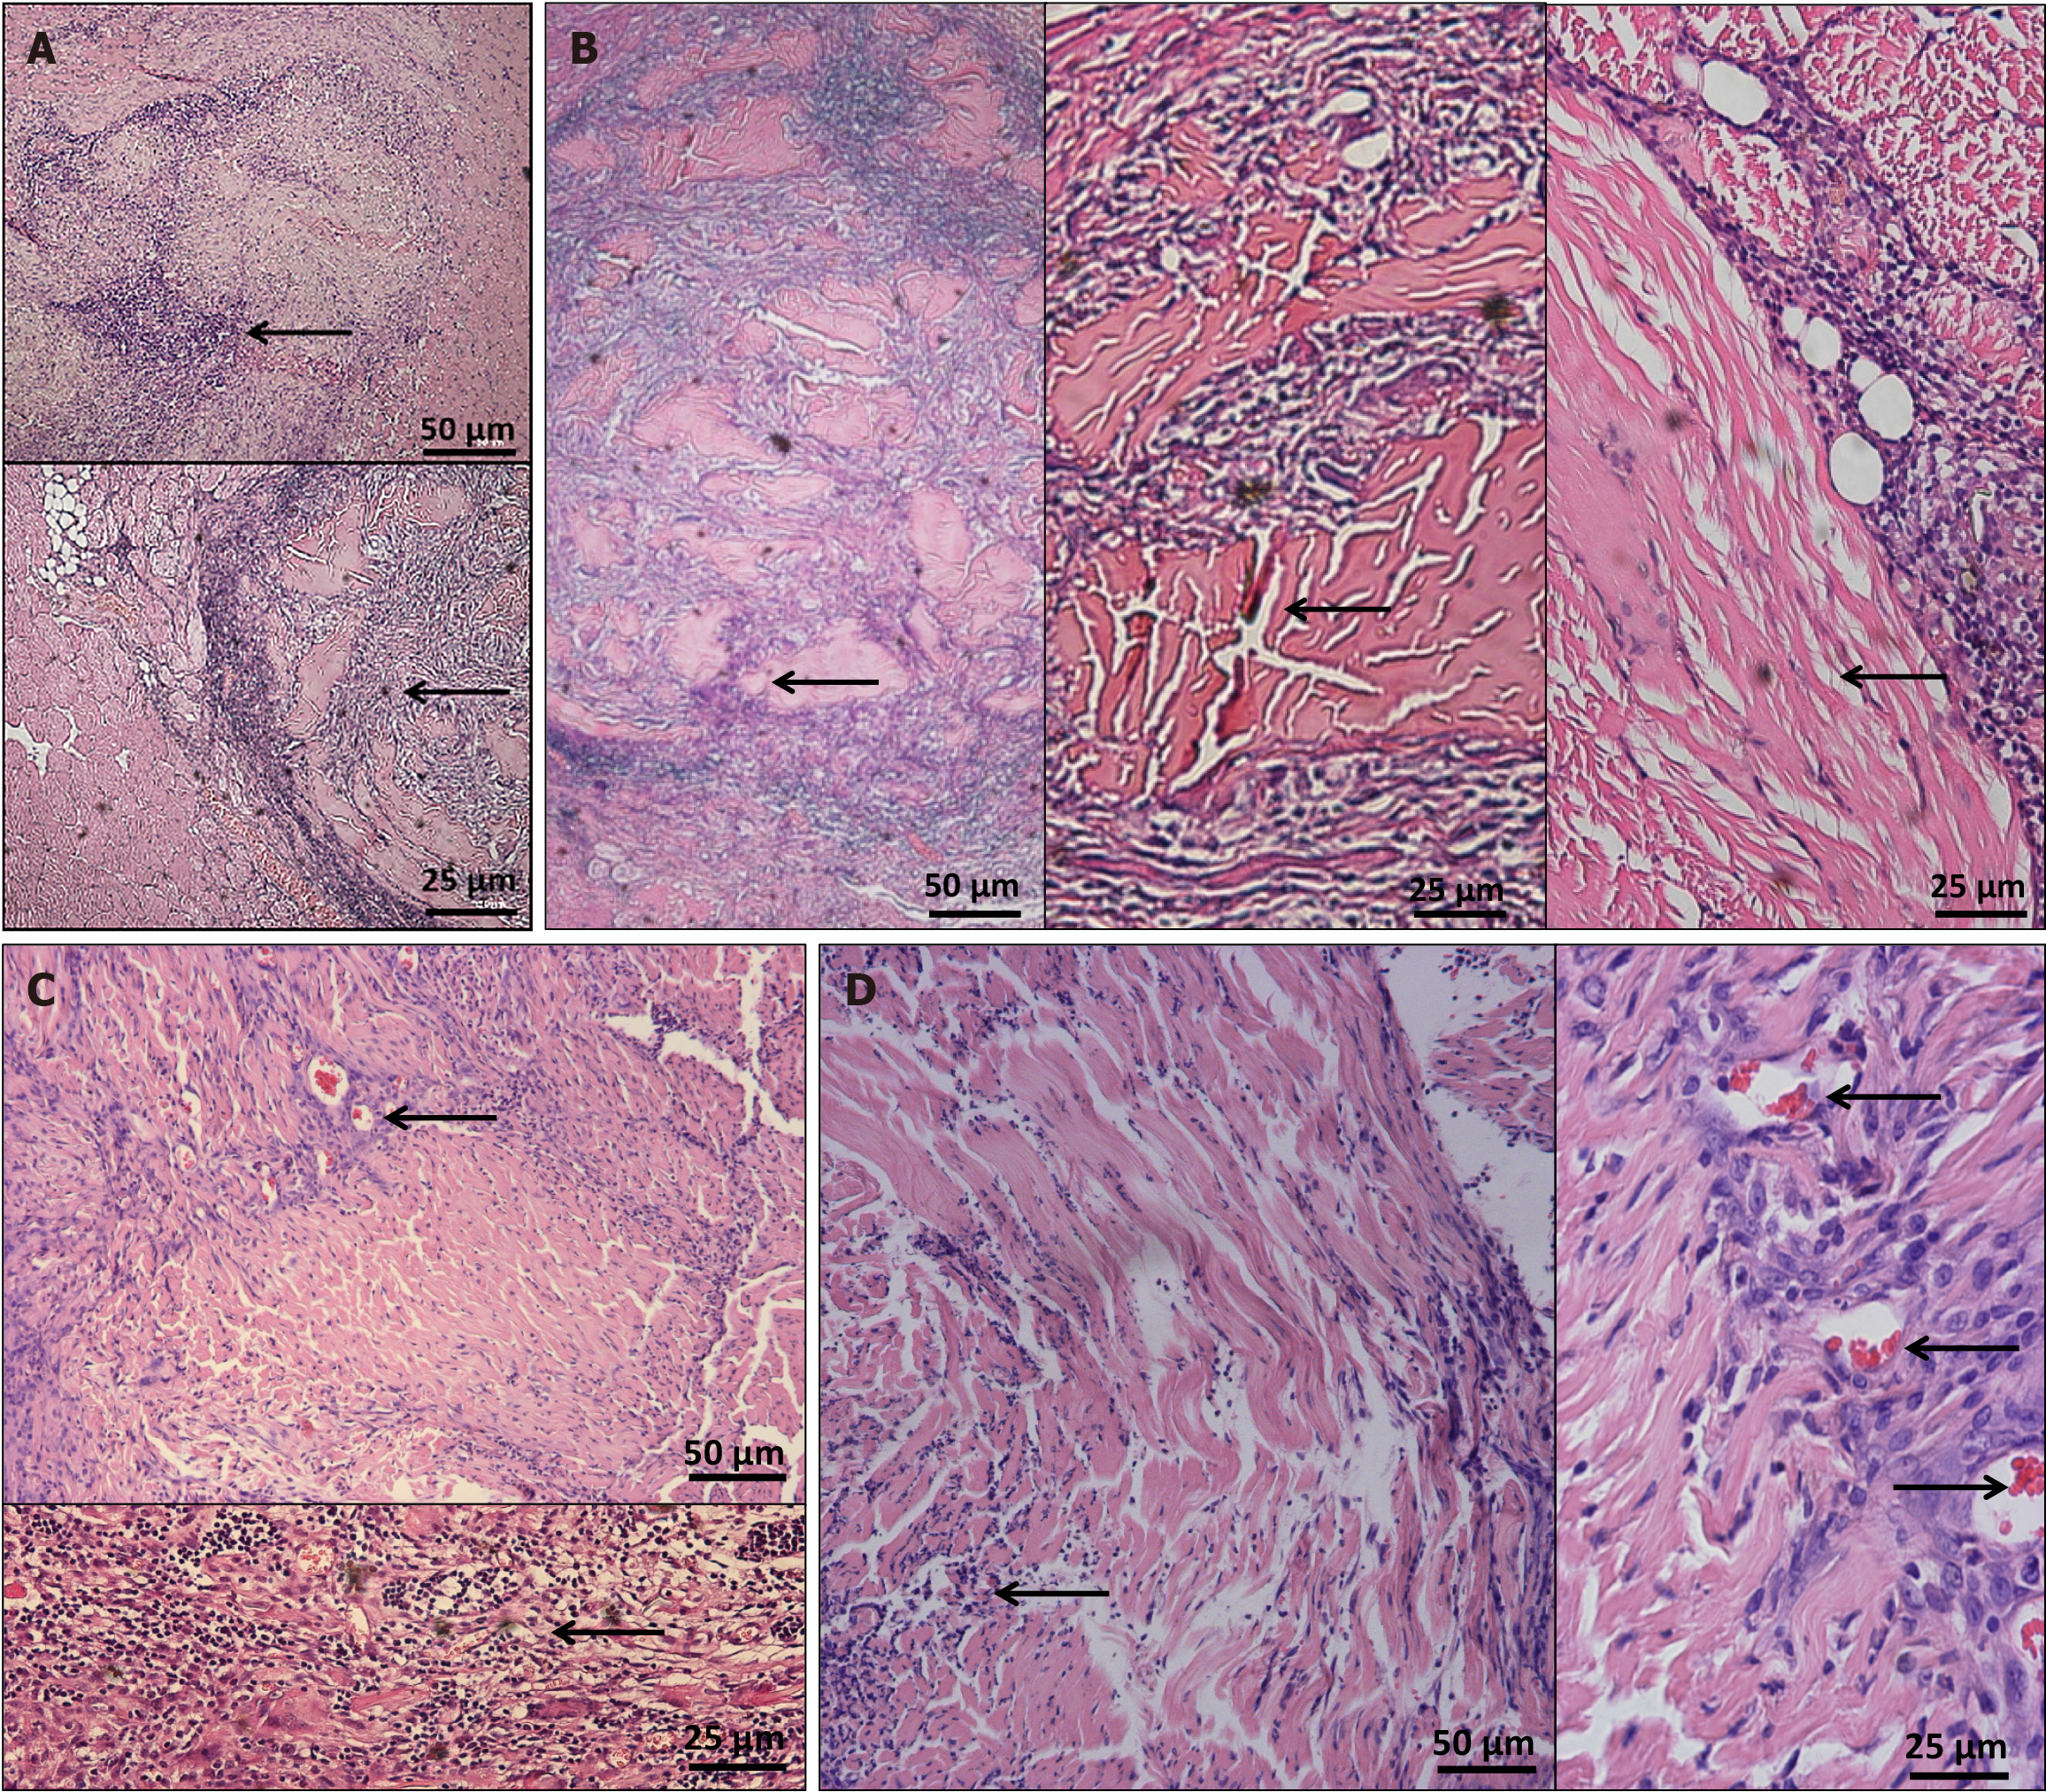
Figure 4 Hematoxylin and eosin staining after acellular scaffold implantation.
A: 3 days after surgery, a large number of inflammatory cells began to appear around the scaffold, including those surrounding the scaffold and spreading toward the middle; B: 7 days postoperatively, the number of inflammatory cells around the scaffold was further increased and the scaffold was further enveloped by the surrounding inflammatory cells; C: 3 weeks after surgery, the inflammatory cells around the scaffold began to fade; D: 6 weeks postoperatively, the inflammatory reaction further subsided and the shape of the scaffold was preserved.
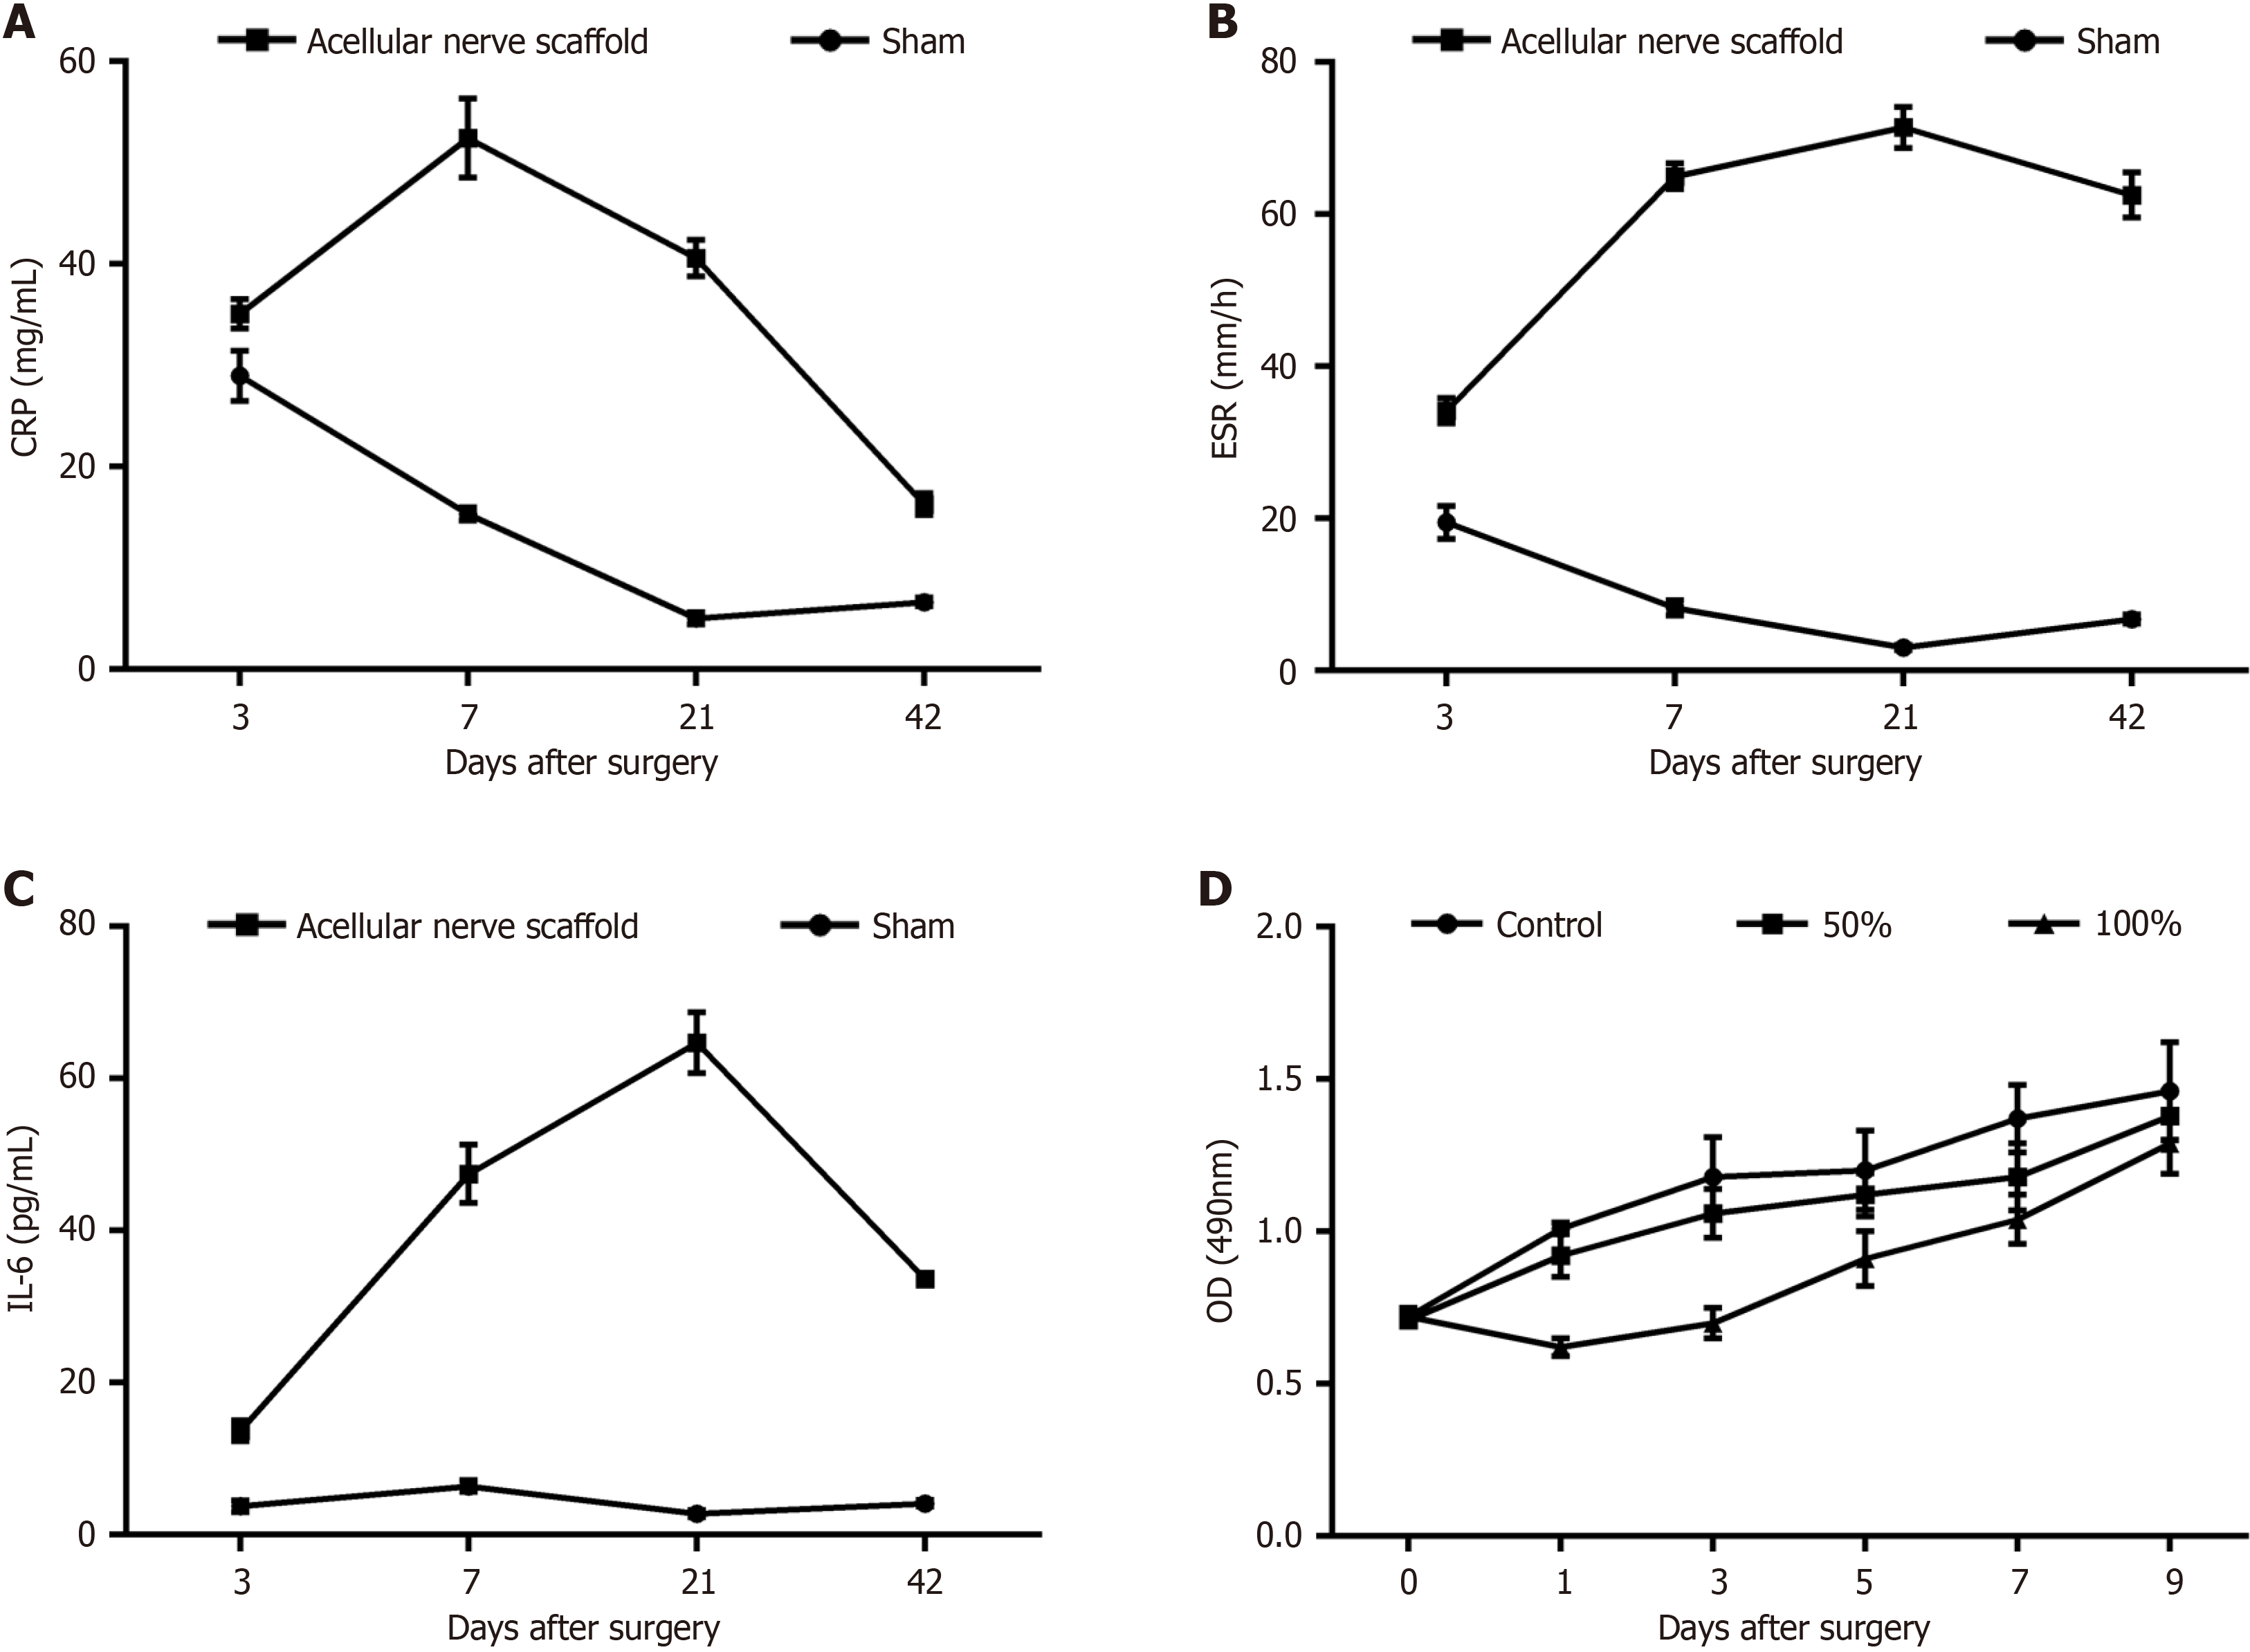
Figure 5 Systemic compatibility testing.
A: Changes in postoperative C-reactive protein levels; B: Postoperative erythrocyte sedimentation rate changes; C: Changes in postoperative IL-6 Levels; D: MTT detection of cytotoxicity. n = 10. CRP: C-reactive protein; ESR; Erythrocyte sedimentation rate.
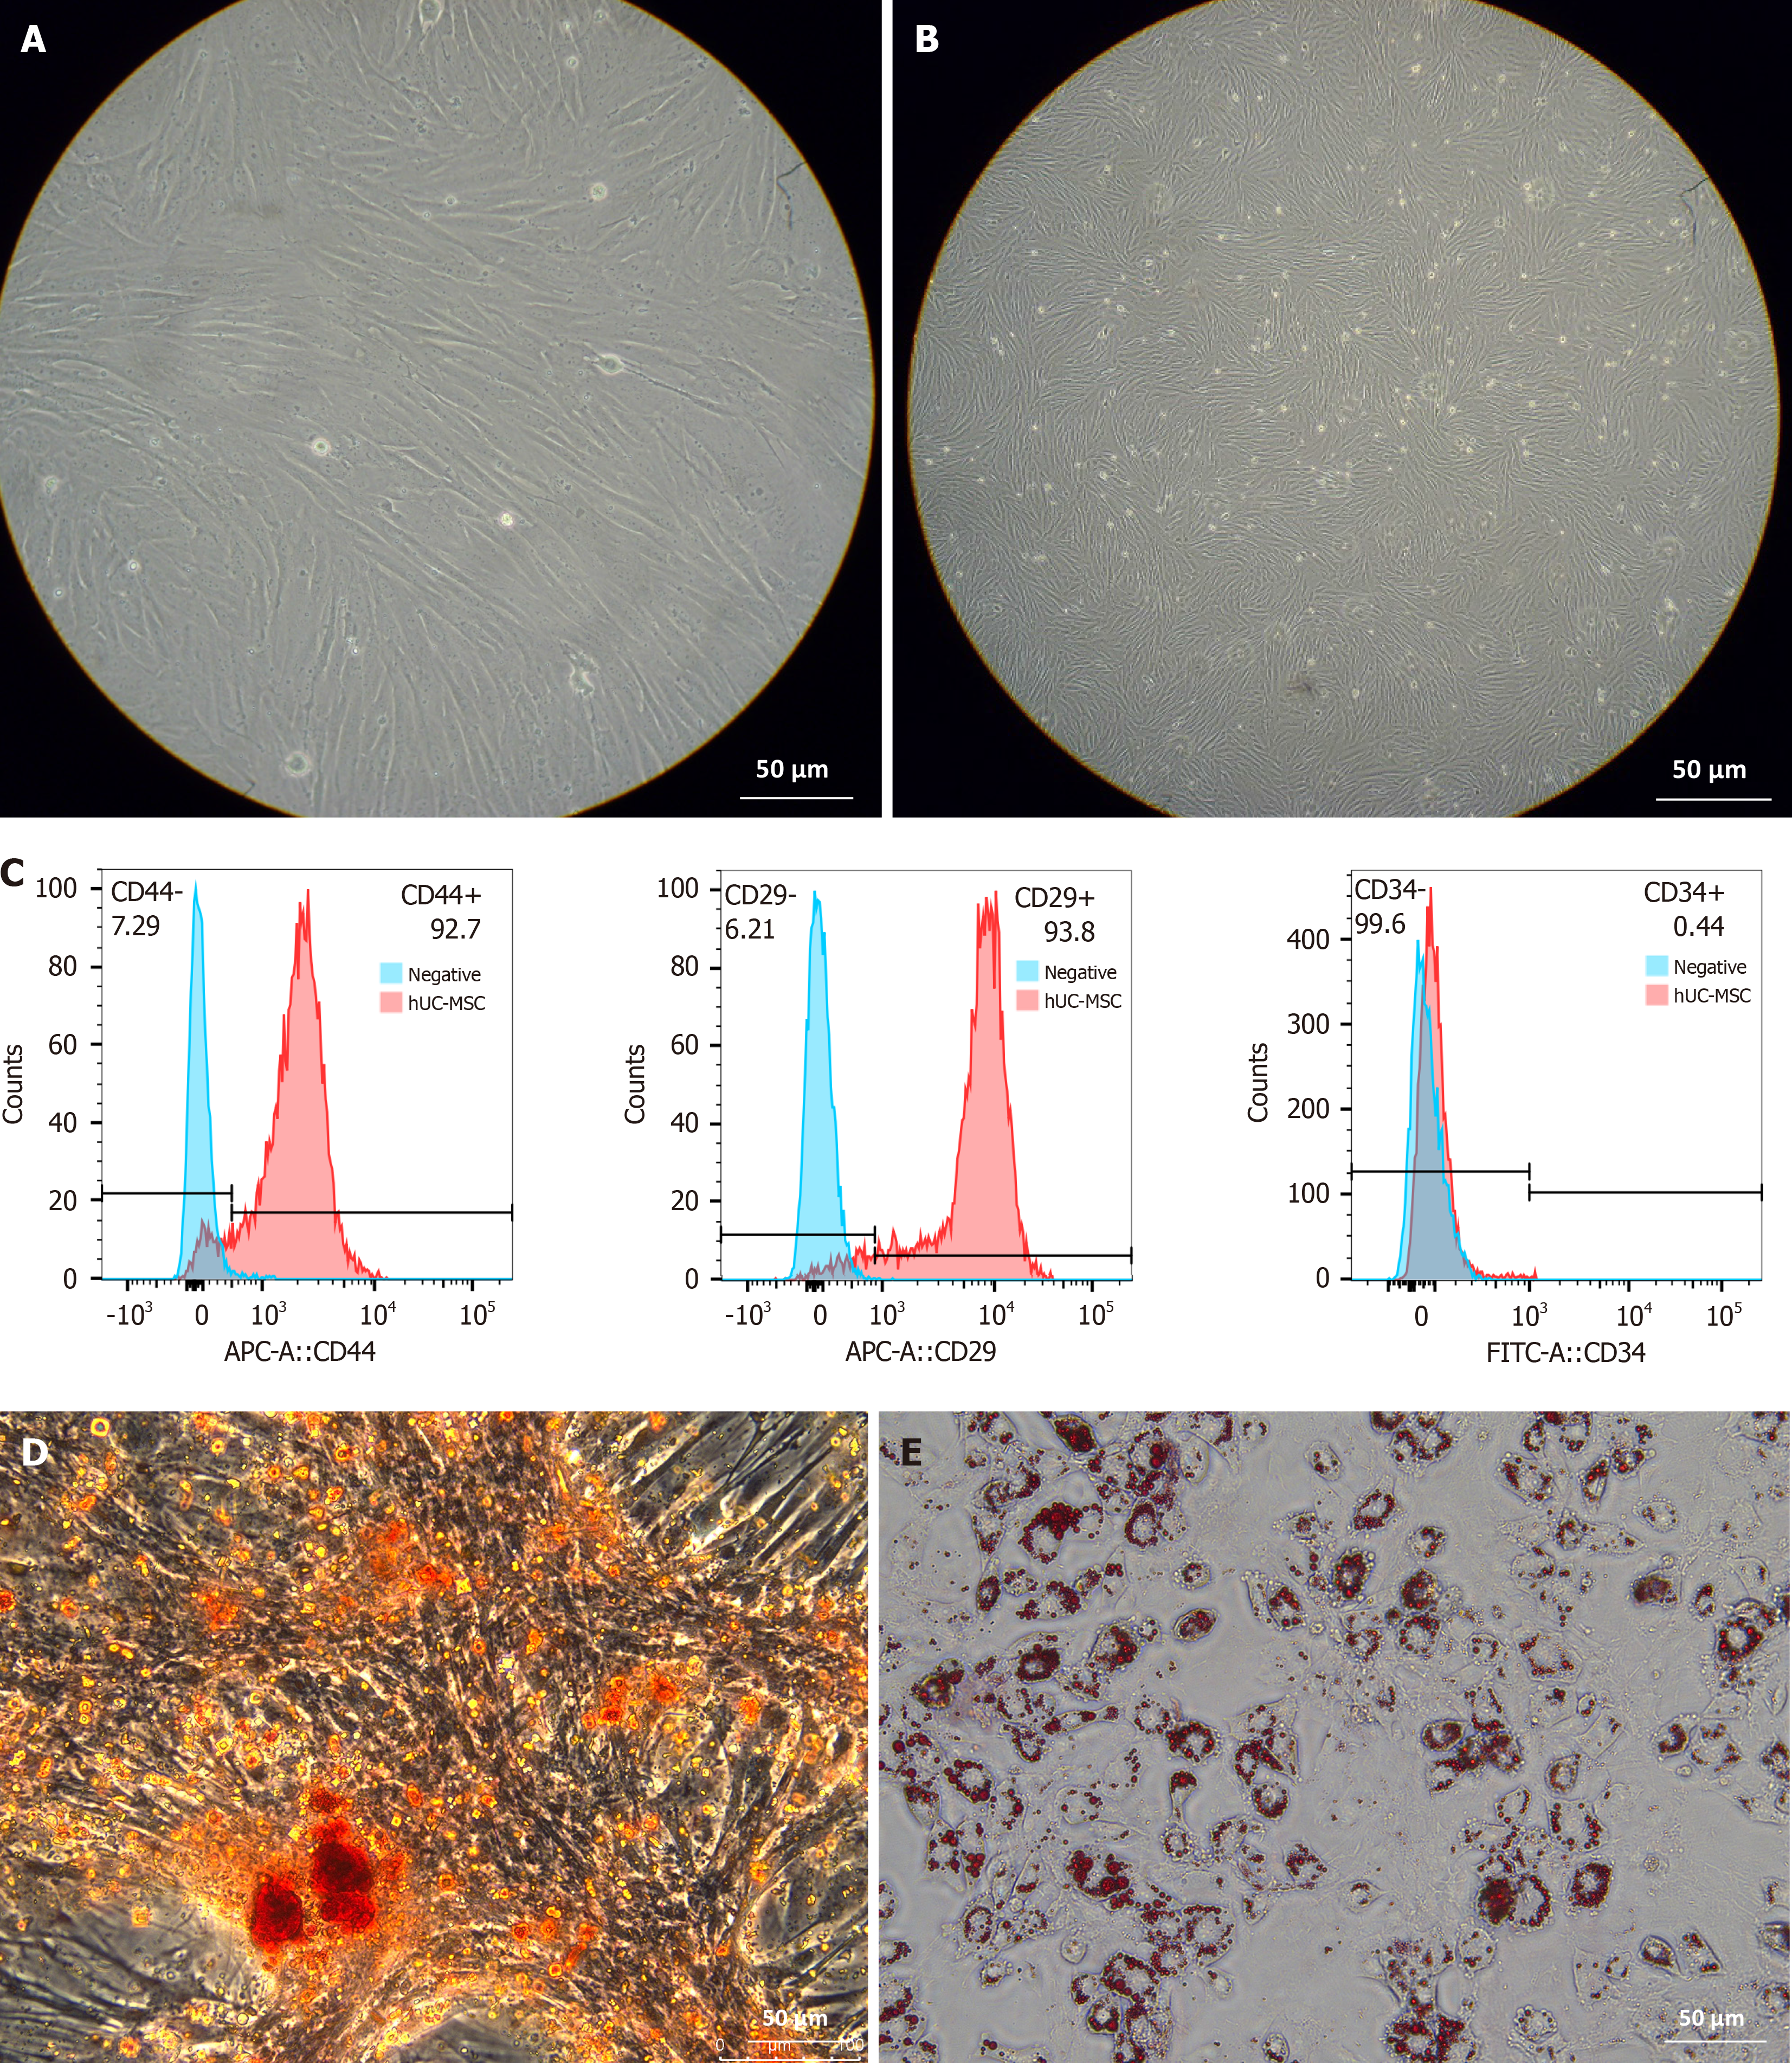
Figure 6 Culture and identification of human umbilical cord mesenchymal stem cells.
A: Morphological observation of human umbilical cord mesenchymal stem cells (hUC-MSCs) after 3 days of culture; B: Morphological observation of hUC-MSCs cultured for one week; C: Flow cytometry for measuring the levels of hUC-MSC surface markers CD44, CD29, and CD34; D: Alizarin red staining; E: Oil red O staining. APC: Adipocyte precursor cell.
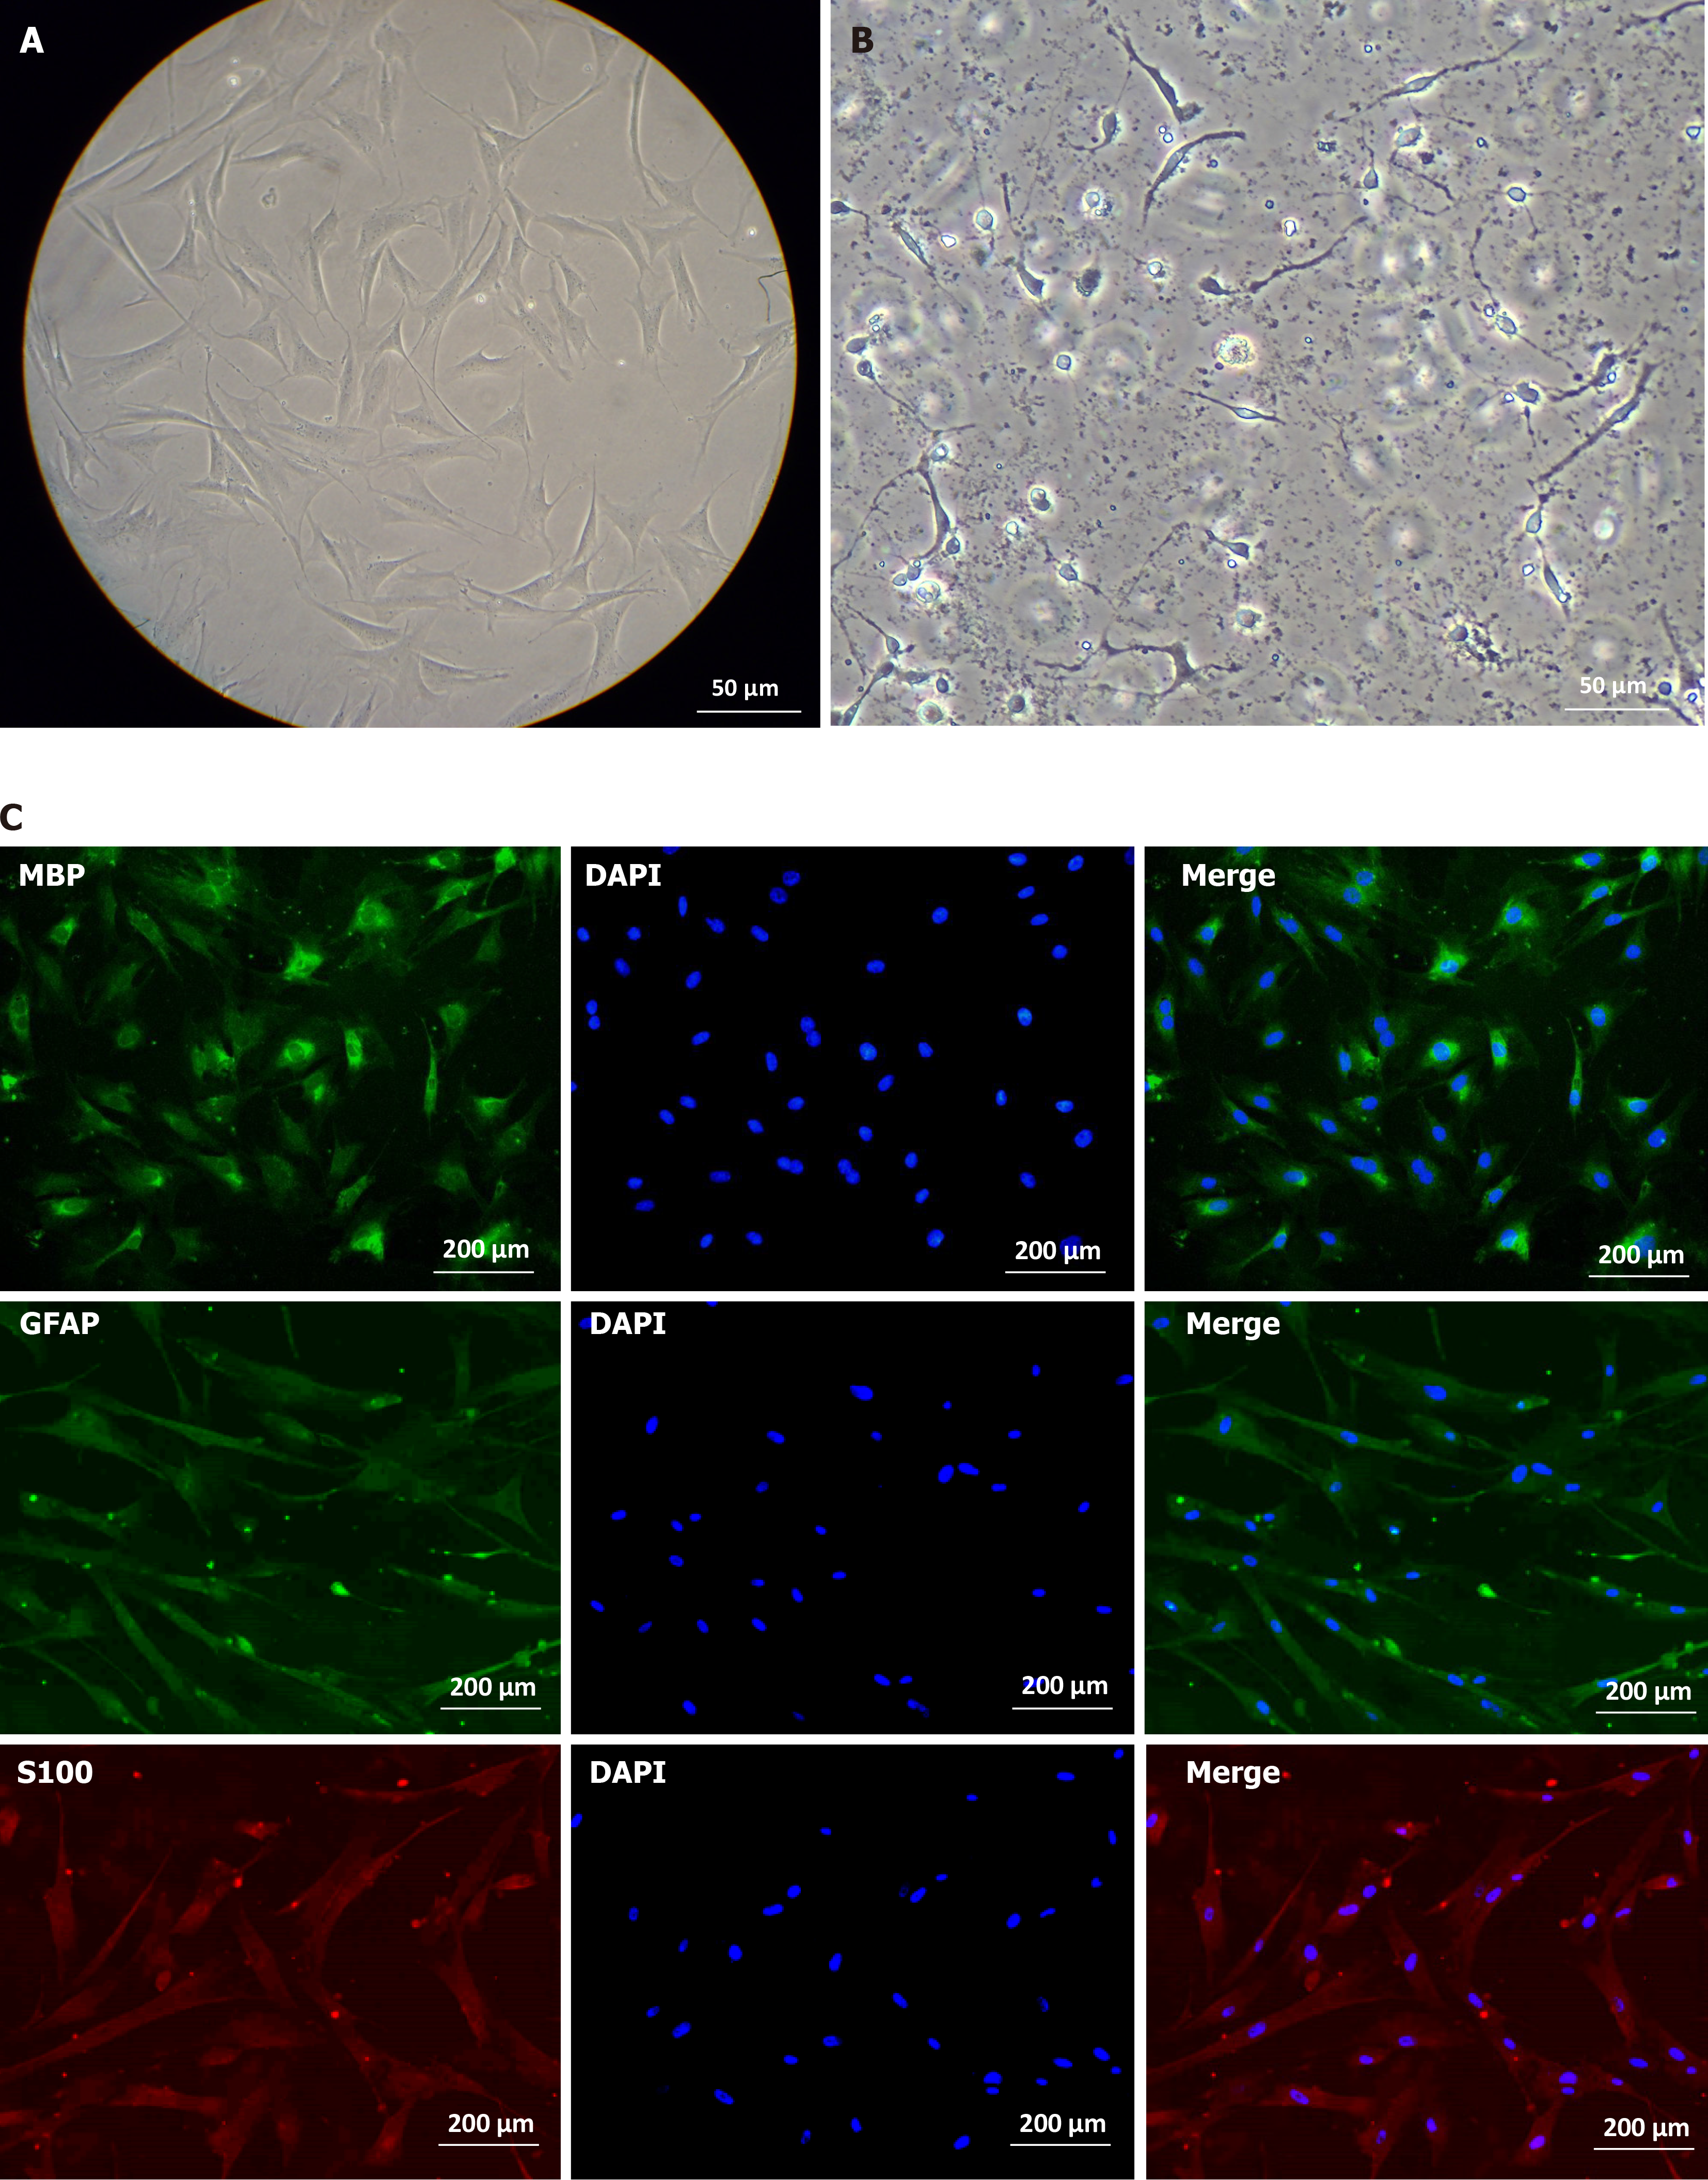
Figure 7 Identification of Schwan-like cells after induced differentiation.
A: Cell morphology after 3 days of induced differentiation and culture; B: Cell morphology after 7 days of induced differentiation and culture; C: Immunohistochemical fluorescence identification of differentiated cells.
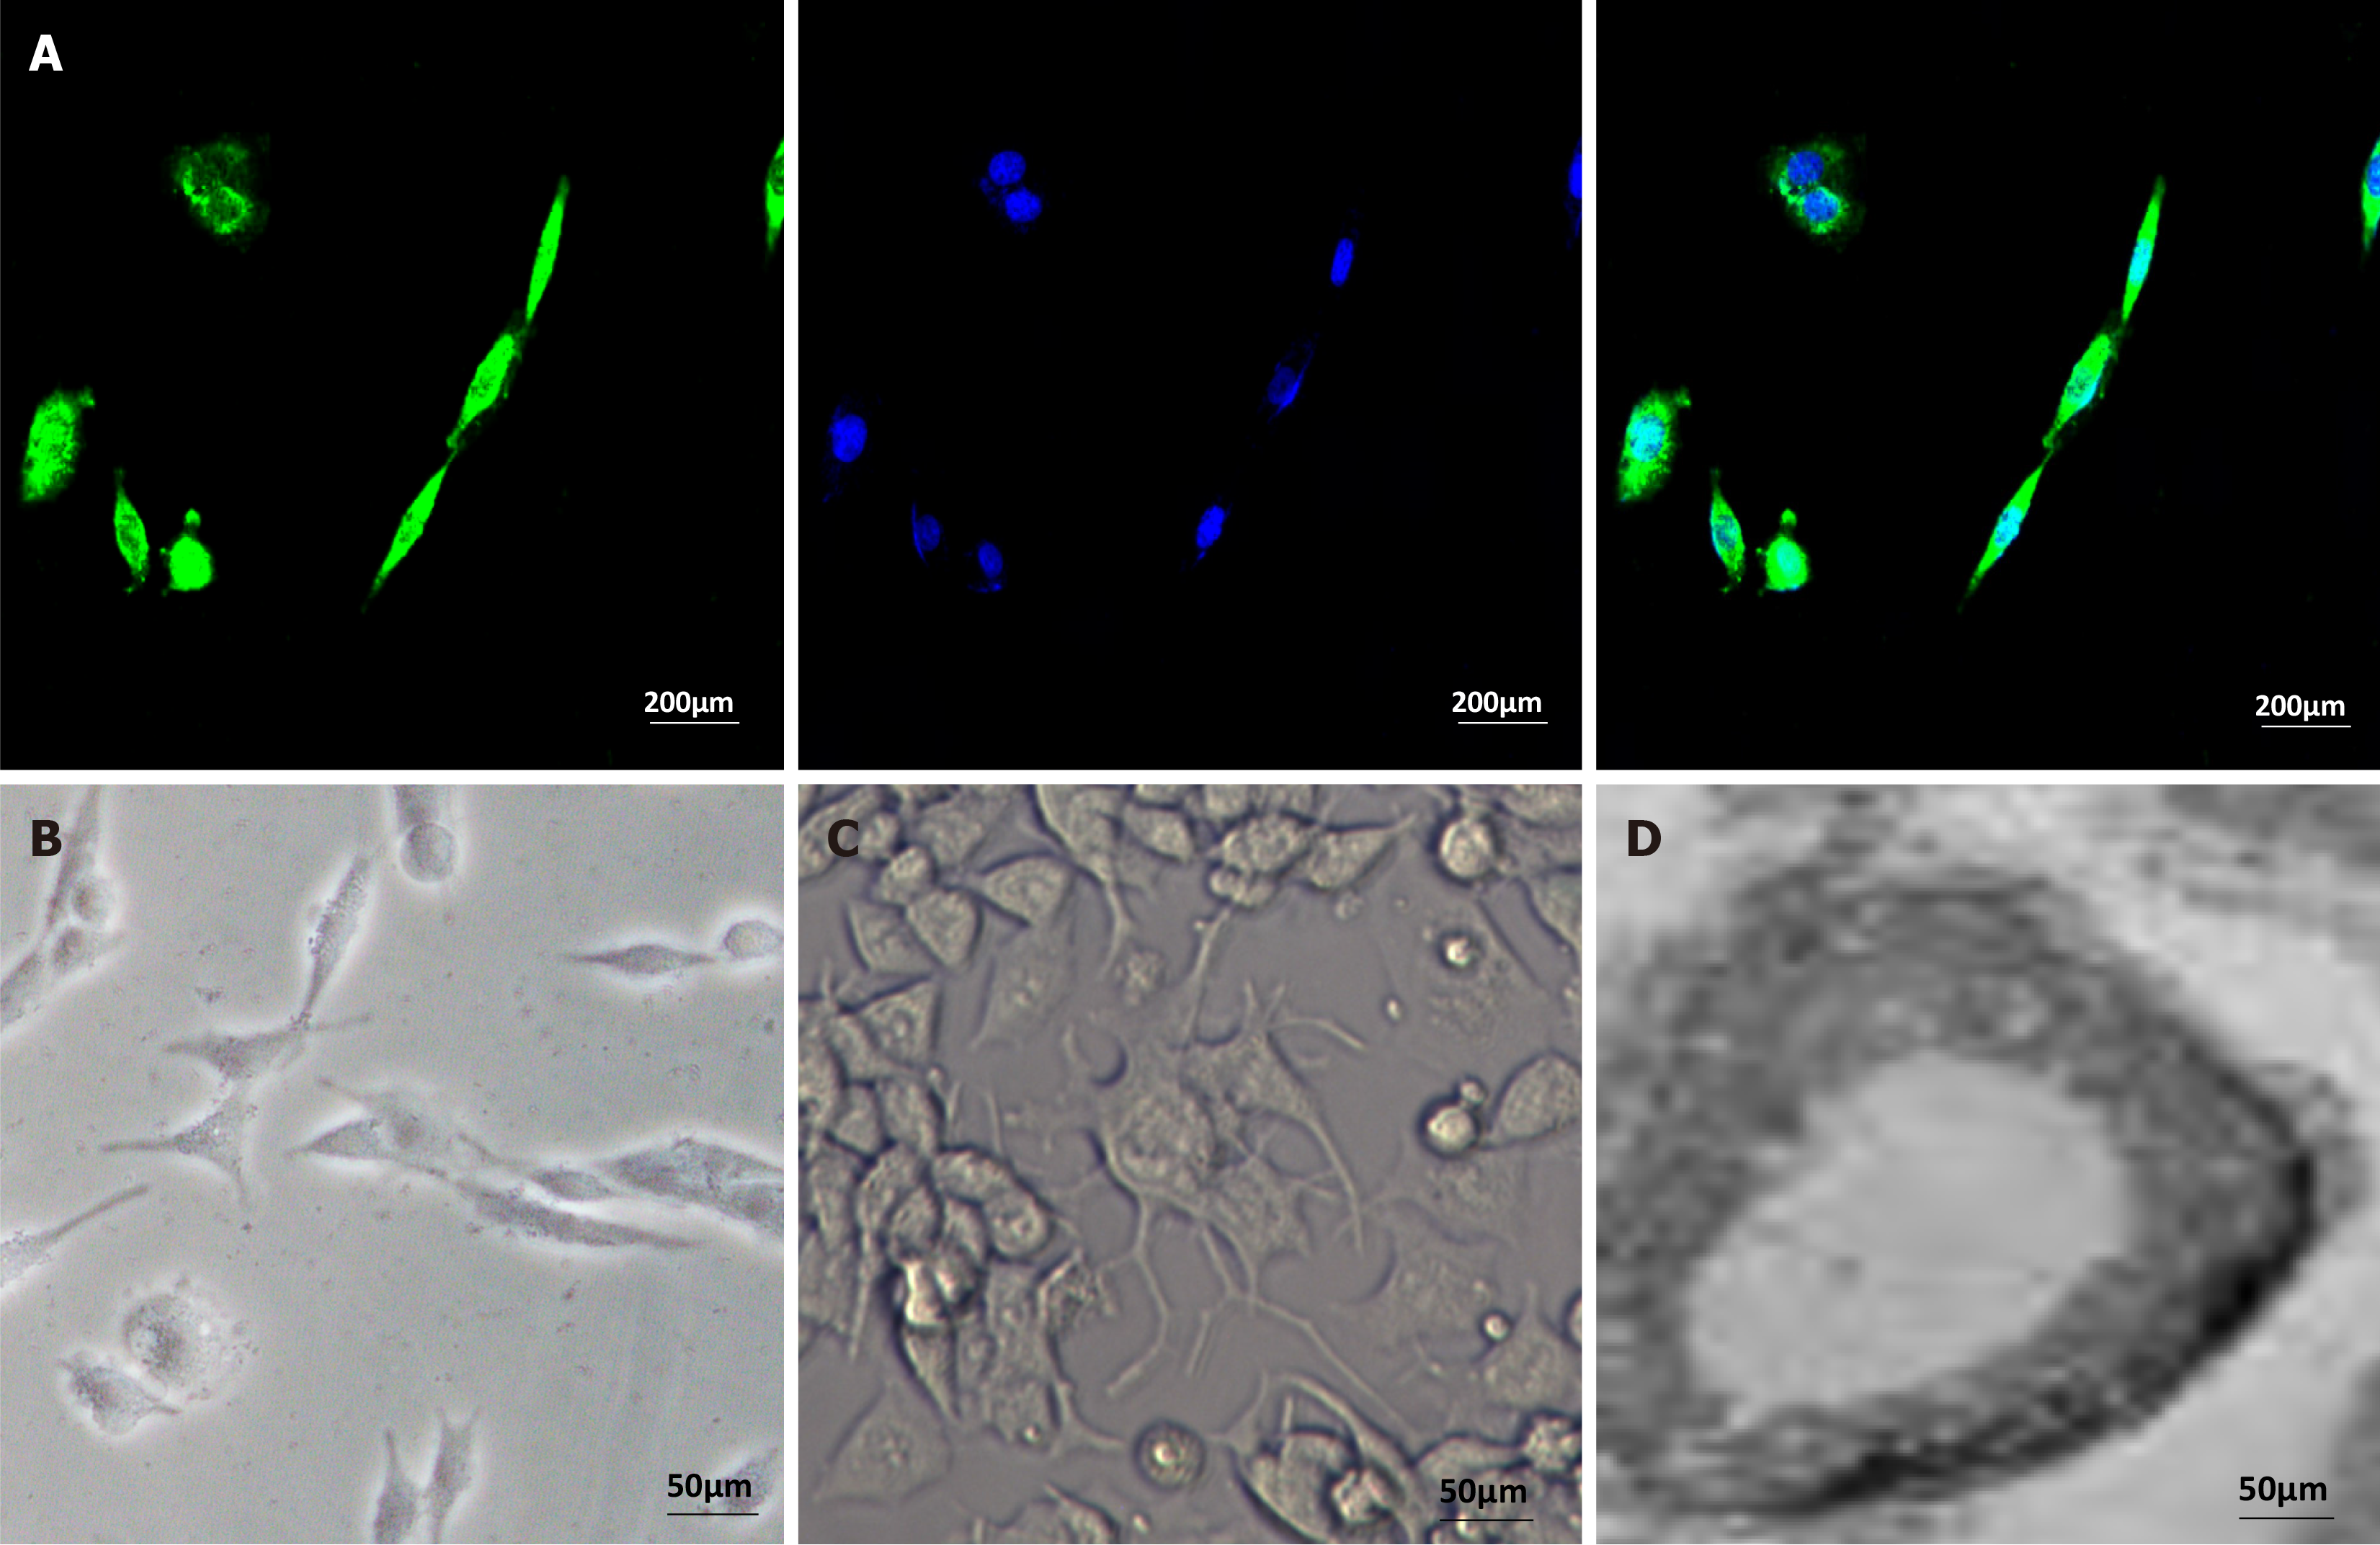
Figure 8 In vitro assessment of myelination capacity of the cells after induction.
A: MPZ expression in the induced cells; B: PC12 cells; C: Morphology of PC12 cells co-cultured with differentiated cells; D: Layered myelin structure suspected to be formed under scanning electron microscopy.
- Citation: Qian C, Guo SY, Xu Z, Zhang ZQ, Li HD, Li H, Chen XS. Preliminary study on the preparation of lyophilized acellular nerve scaffold complexes from rabbit sciatic nerves with human umbilical cord mesenchymal stem cells. World J Stem Cells 2024; 16(12): 1047-1061
- URL: https://www.wjgnet.com/1948-0210/full/v16/i12/1047.htm
- DOI: https://dx.doi.org/10.4252/wjsc.v16.i12.1047


