Copyright
©The Author(s) 2023.
World J Stem Cells. Sep 26, 2023; 15(9): 897-907
Published online Sep 26, 2023. doi: 10.4252/wjsc.v15.i9.897
Published online Sep 26, 2023. doi: 10.4252/wjsc.v15.i9.897
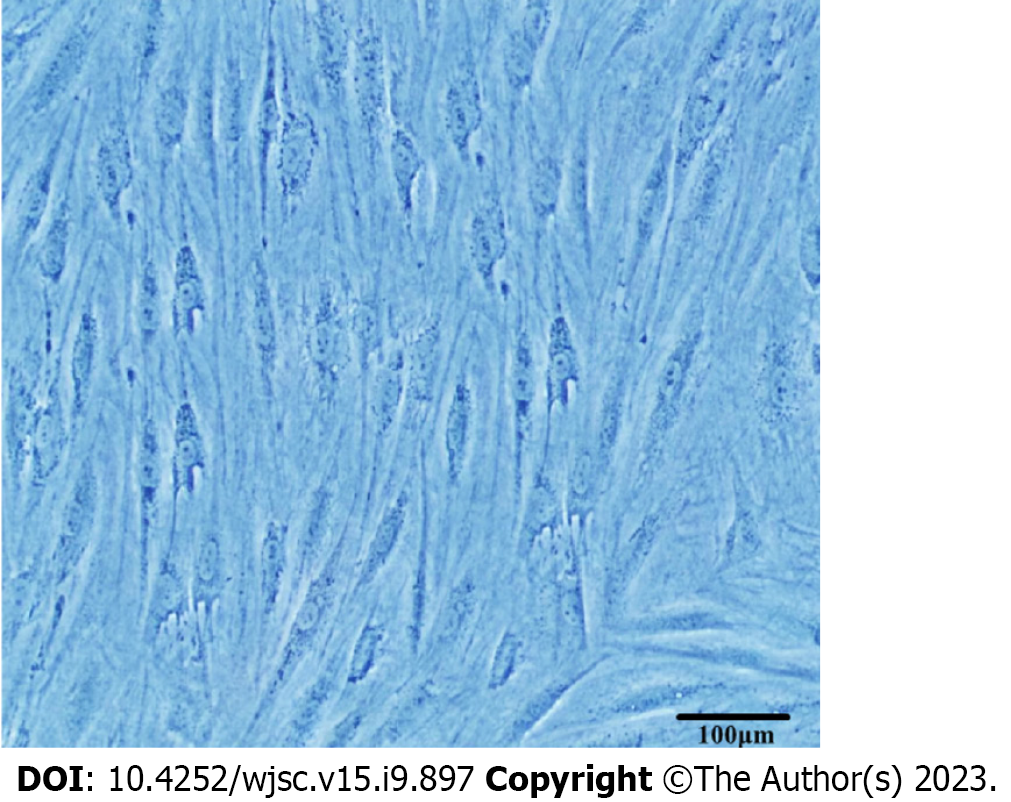
Figure 1 Morphology of adipose-derived stem cells at passage 4 (× 100).
Figure 2 Detection of cell surface markers by flow cytometry.
A: Positive expression of CD44; B: Positive expression of CD44; C: Negative expression of CD45; D: Negative expression of CD34.
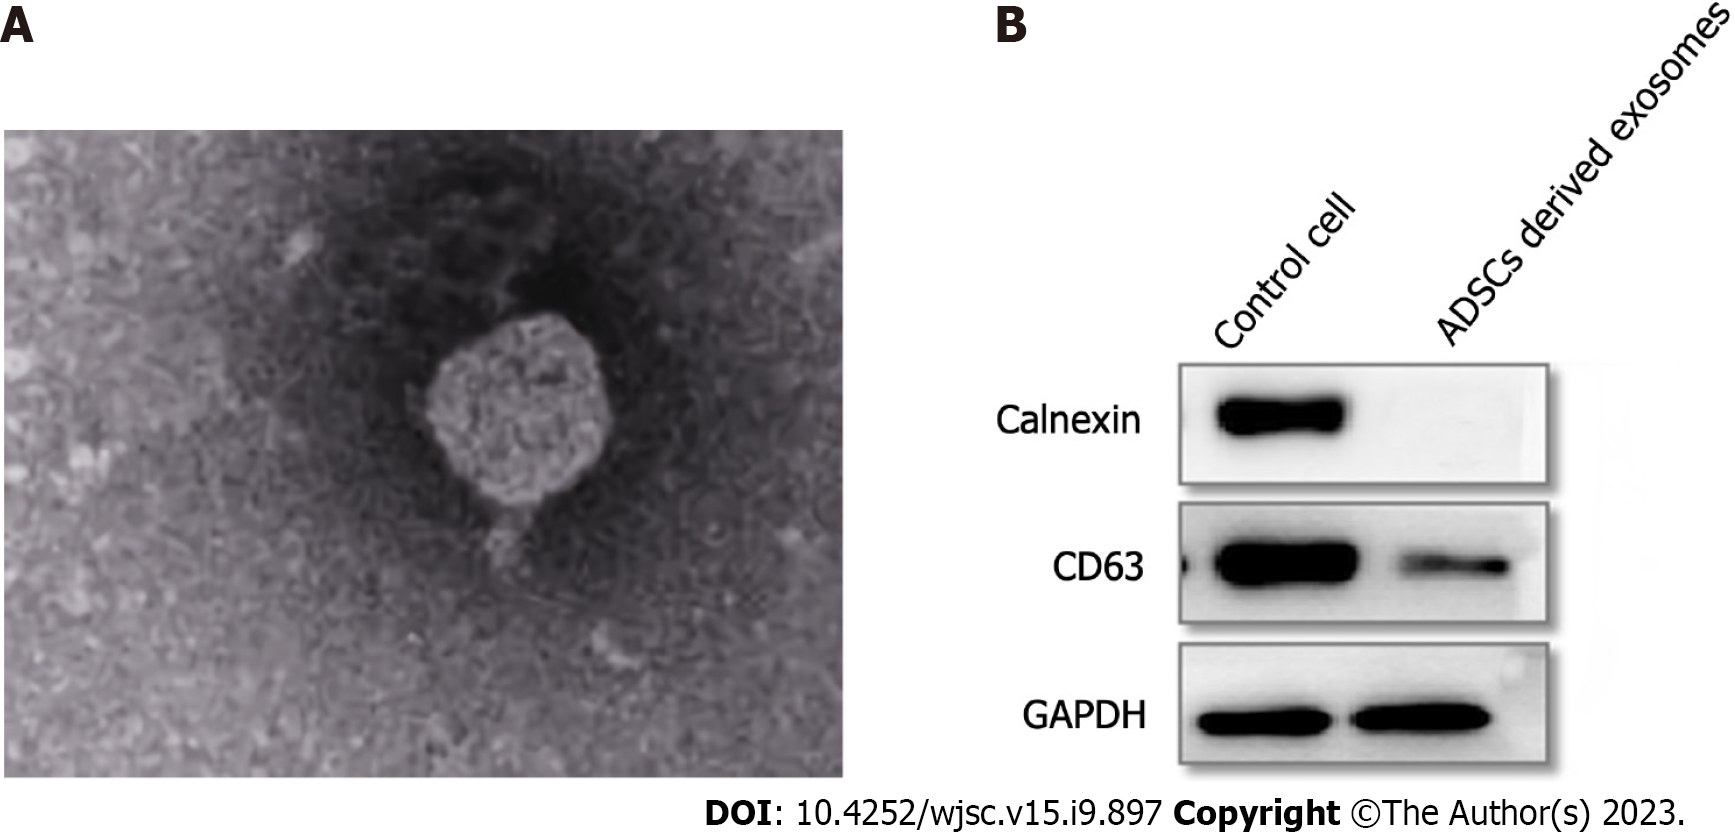
Figure 3 Morphology and protein identification of adipose-derived stem cell-derived exosomes.
A: Adipose-derived stem cell (ADSC)-derived exosome morphology seen using transmission electron microscopy (× 15000); B: Surface detection of ADSC-derived exosomes by western blotting. ADSC: Adipose-derived stem cell.
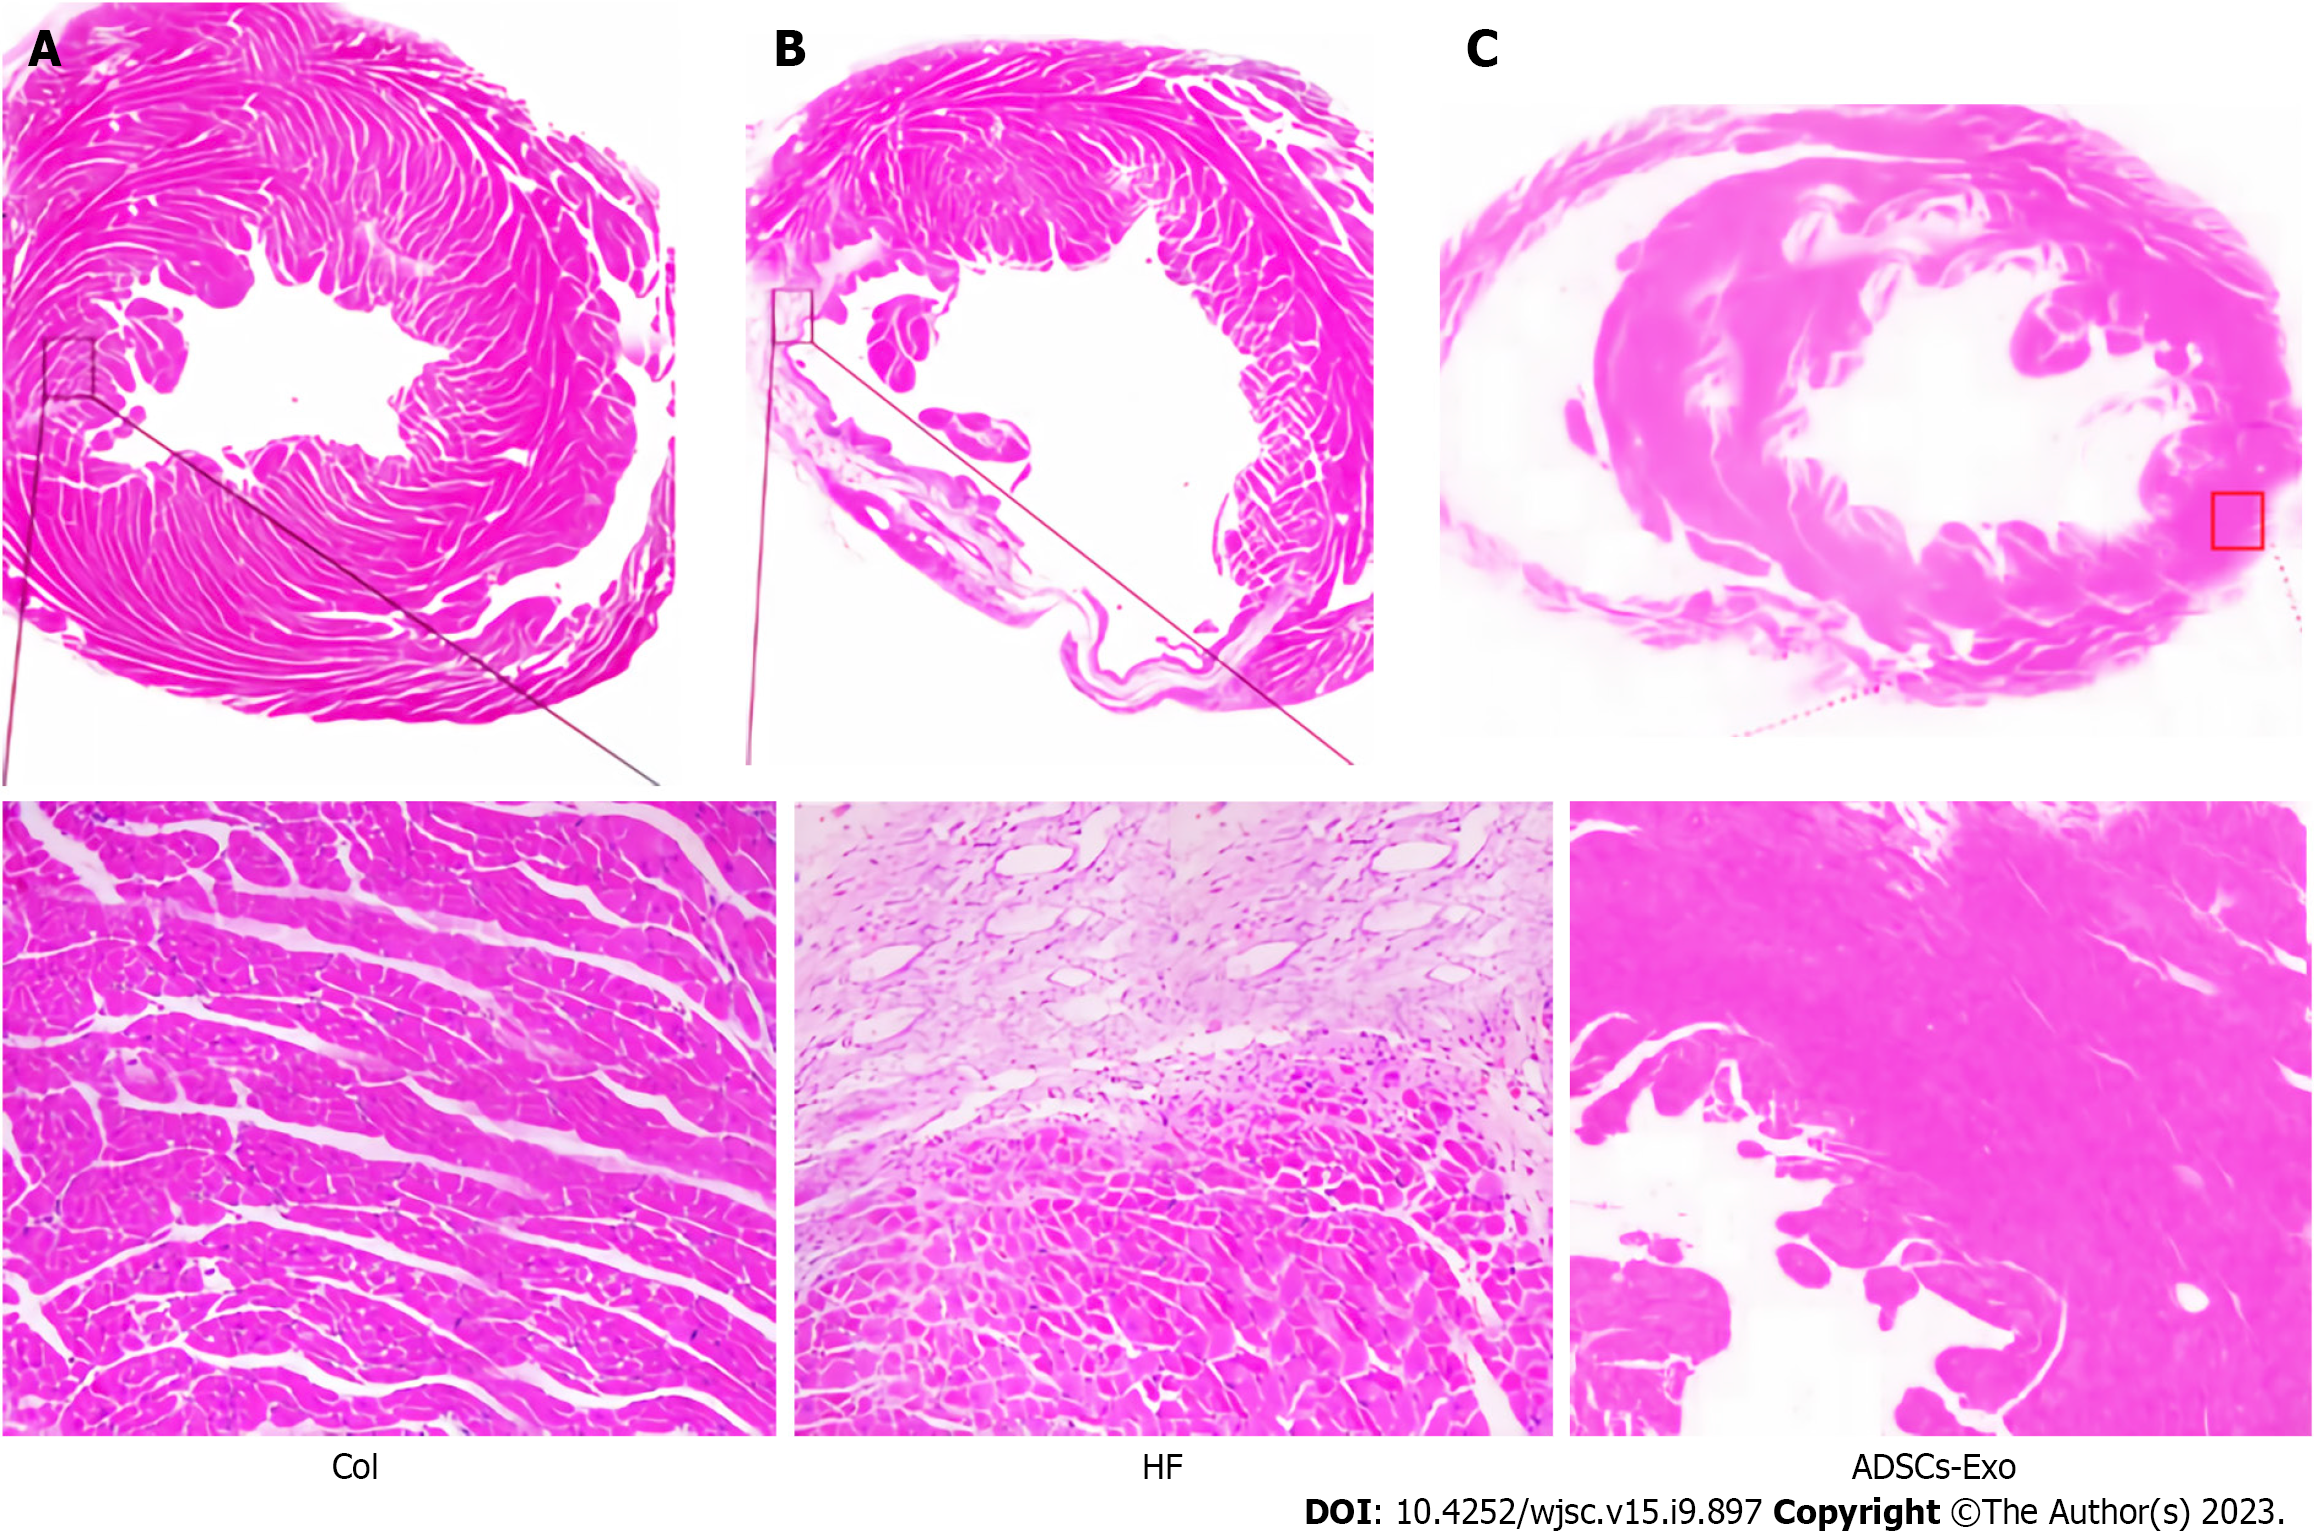
Figure 4 Hematoxylin and eosin staining of rat myocardial tissue.
A: Myocardial tissue of rats in control group; B: Myocardial tissue of rats in heart failure group; C: Myocardial tissue of rats in adipose-derived stem cell-exosome group; Col: Control; HF: Heart failure; ADSCs-Exo: Adipose-derived stem cell-exosome.
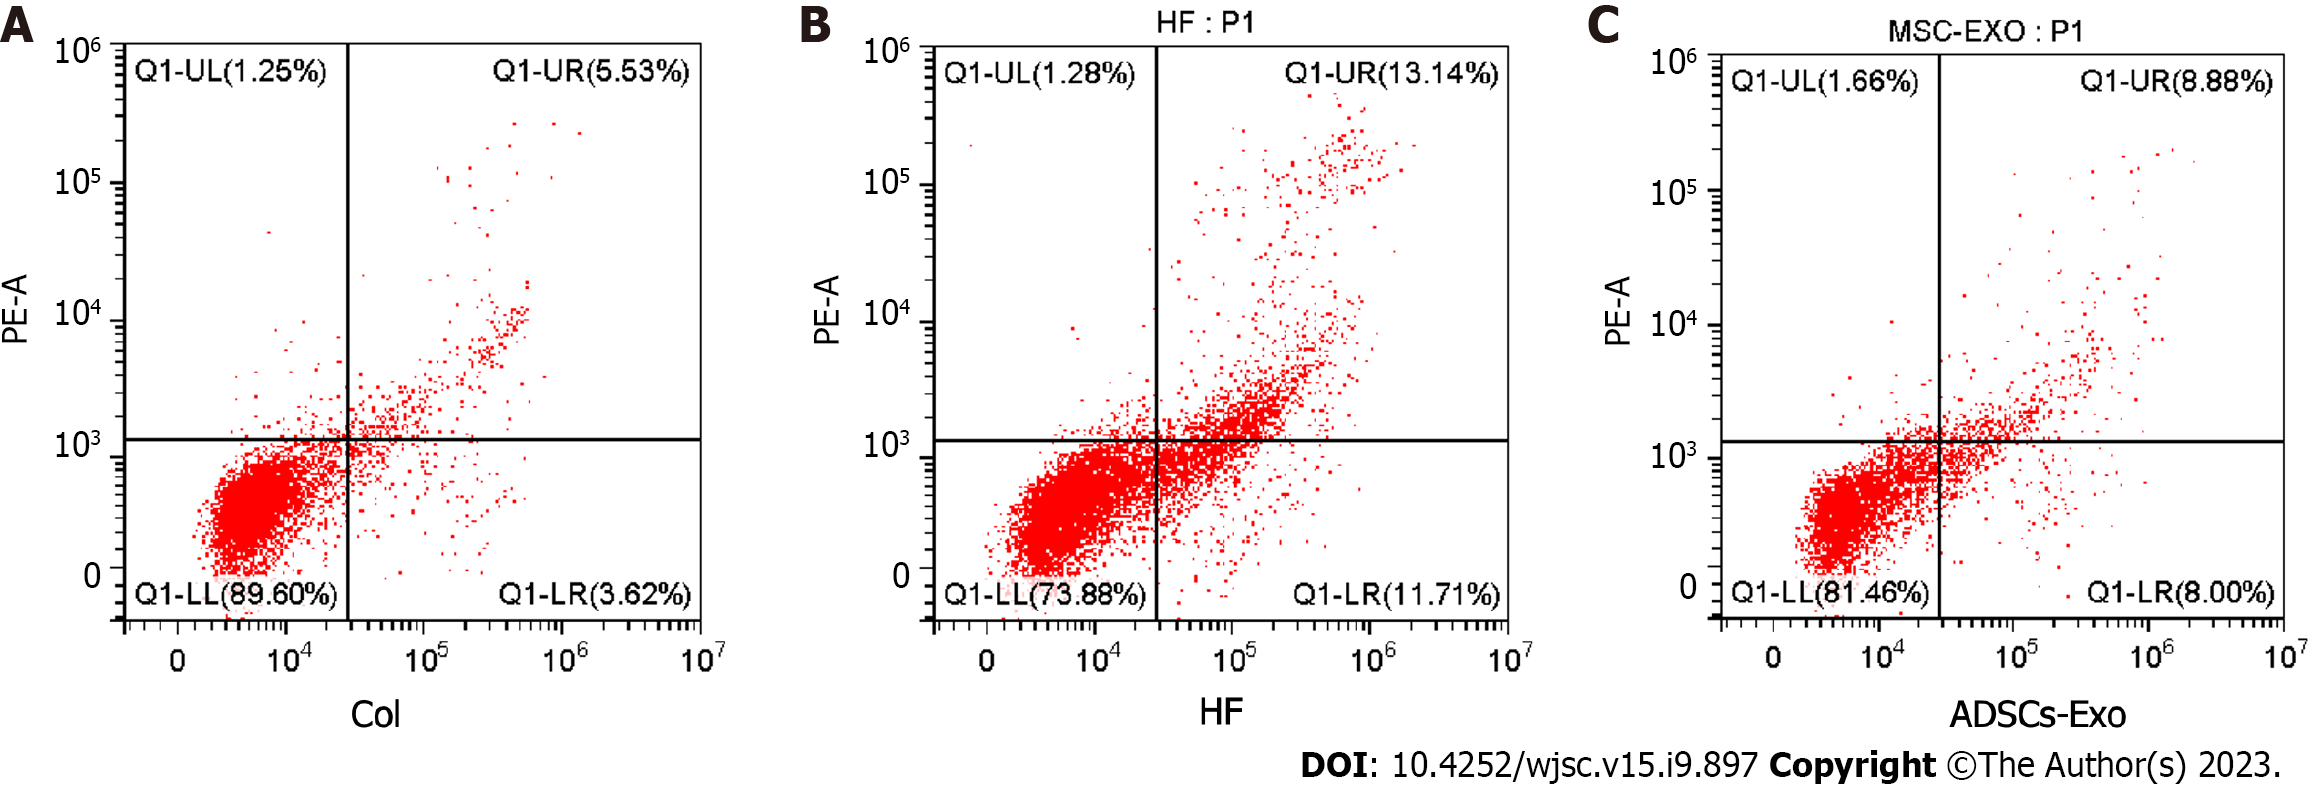
Figure 5 Comparison of cardiomyocyte apoptosis rate in each group.
A: Cardiomyocyte apoptosis rate in control group; B: Cardiomyocyte apoptosis rate in heart failure group; C: Cardiomyocyte apoptosis rate in adipose-derived stem cell-exosome group. Col: Control; HF: Heart failure; ADSCs-Exo: Adipose-derived stem cell-exosome.
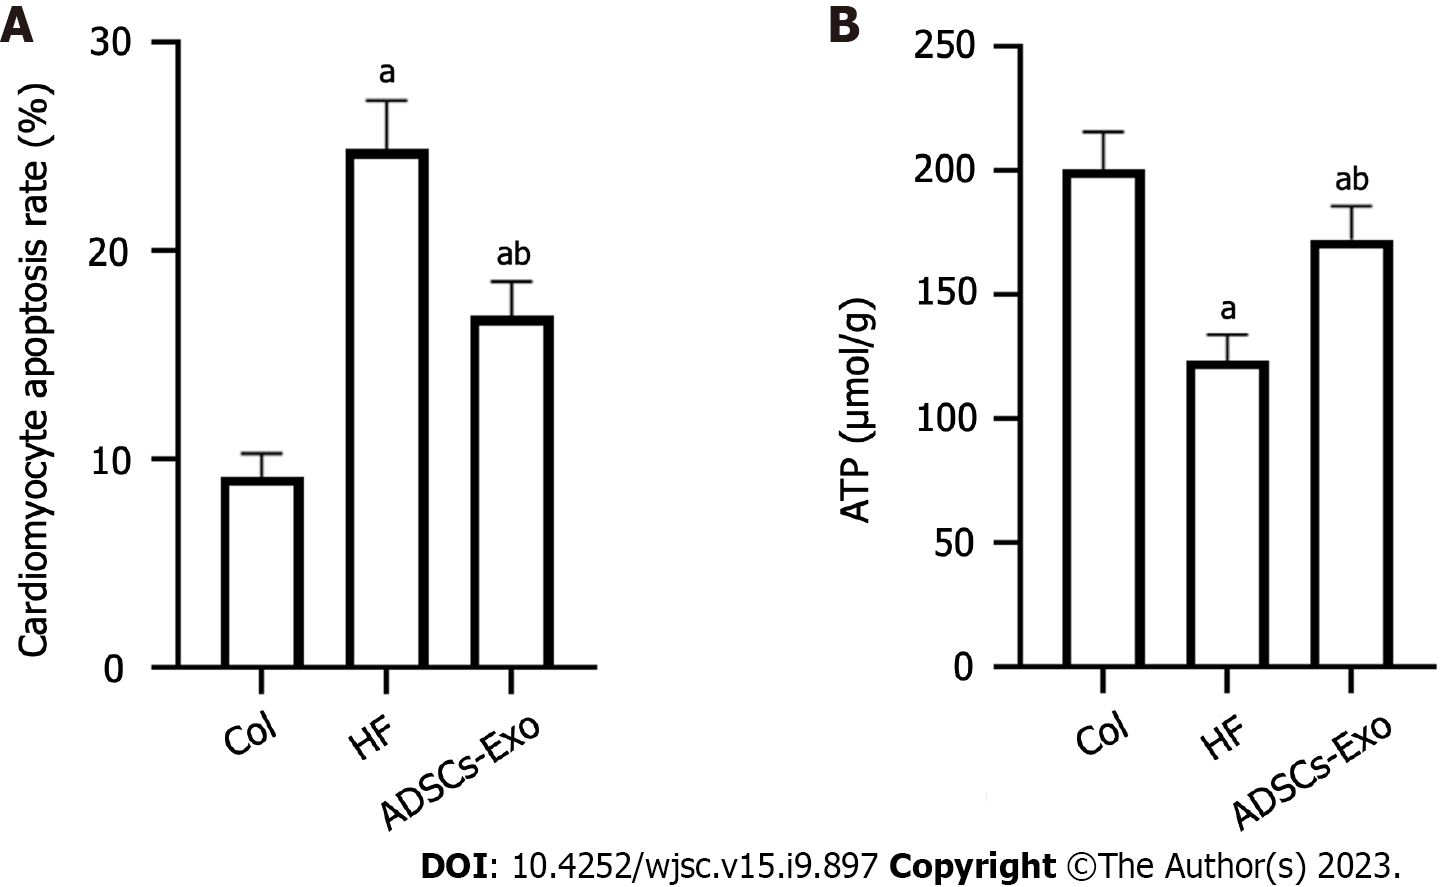
Figure 6 Comparison of ATP content in myocardial tissue of rats in each group.
A: Apoptosis rate of cardiomyocytes in three groups of rats; B: ATP content in myocardial tissue of rats in three groups. aP < 0.05 compared with the control group; bP < 0.05 compared with the heart failure group. Col: Control; HF: Heart failure; ADSCs-Exo: Adipose-derived stem cell-exosome.
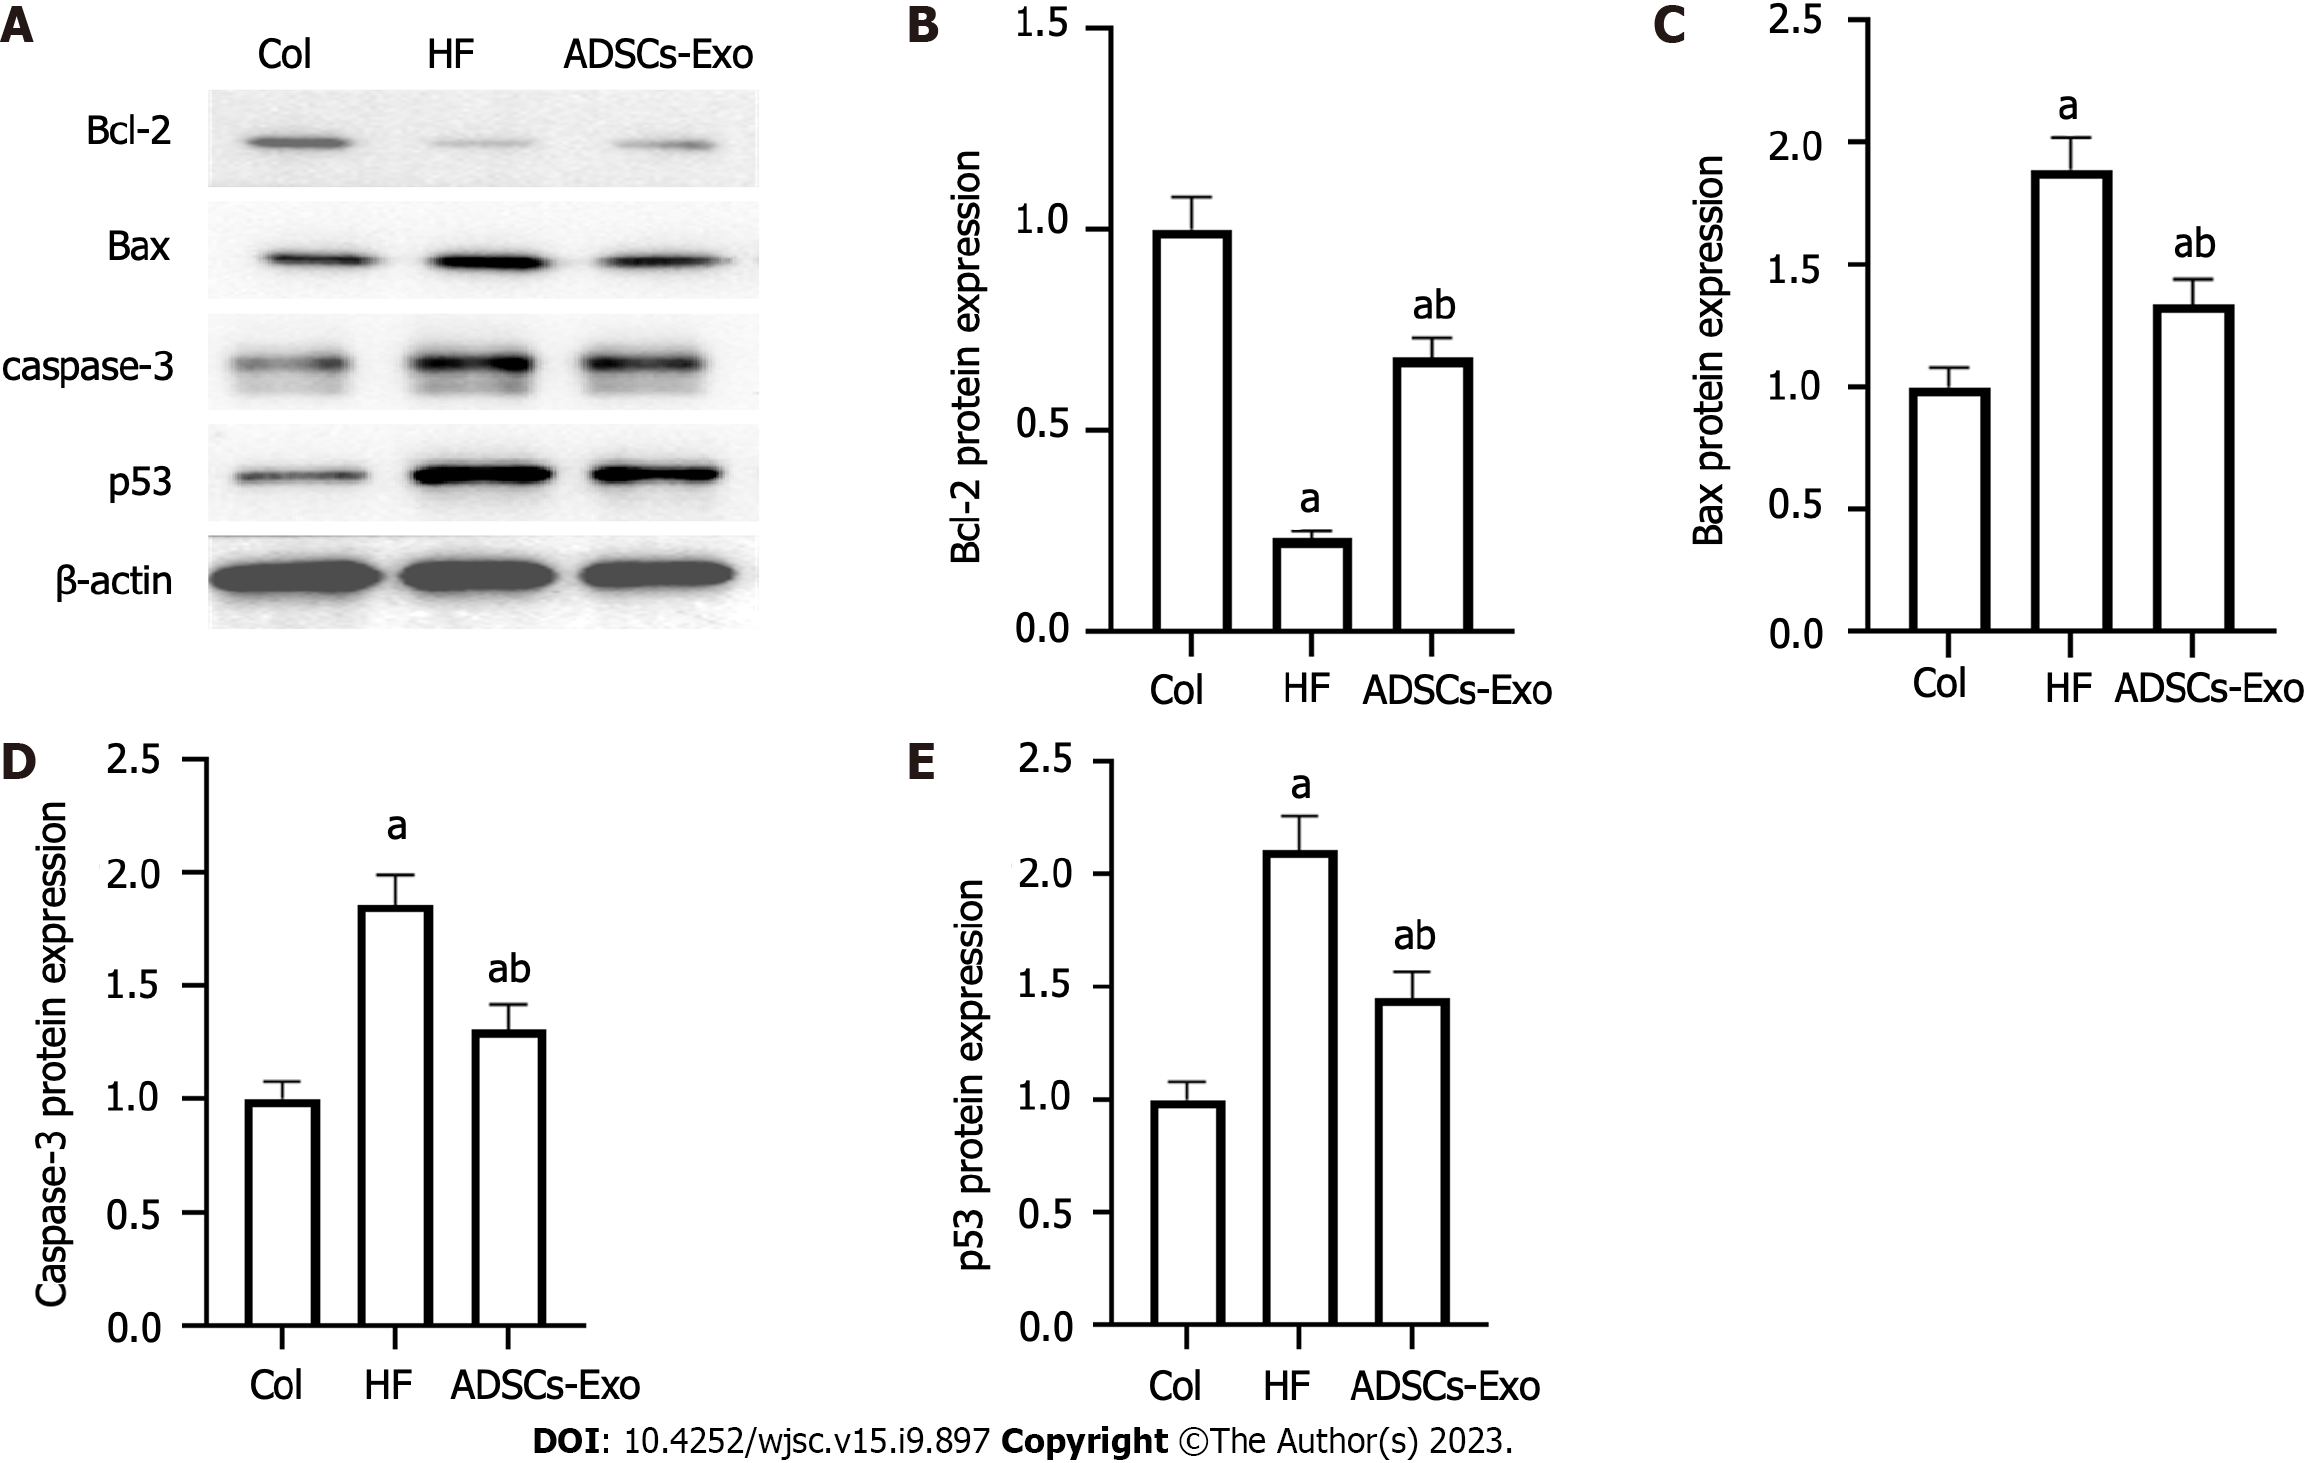
Figure 7 Comparison of the protein expression levels of Bcl-2, Bax, caspase-3, and p53 in the myocardial tissue of rats in each group.
A: Myocardial tissue protein electrophoresis detection; B: Protein expression levels of Bcl-2; C: Protein expression levels of Bax; D: Protein expression levels of caspase-3; E: Protein expression levels of p53. aP < 0.05 compared with the control group; bP < 0.05 compared with the heart failure group. Col: Control; HF: Heart failure; ADSCs-Exo: Adipose-derived stem cell-exosome.
- Citation: Wang L, Zhang JJ, Wang SS, Li L. Mechanism of adipose-derived mesenchymal stem cell exosomes in the treatment of heart failure. World J Stem Cells 2023; 15(9): 897-907
- URL: https://www.wjgnet.com/1948-0210/full/v15/i9/897.htm
- DOI: https://dx.doi.org/10.4252/wjsc.v15.i9.897


