Copyright
©The Author(s) 2023.
World J Stem Cells. Aug 26, 2023; 15(8): 842-865
Published online Aug 26, 2023. doi: 10.4252/wjsc.v15.i8.842
Published online Aug 26, 2023. doi: 10.4252/wjsc.v15.i8.842
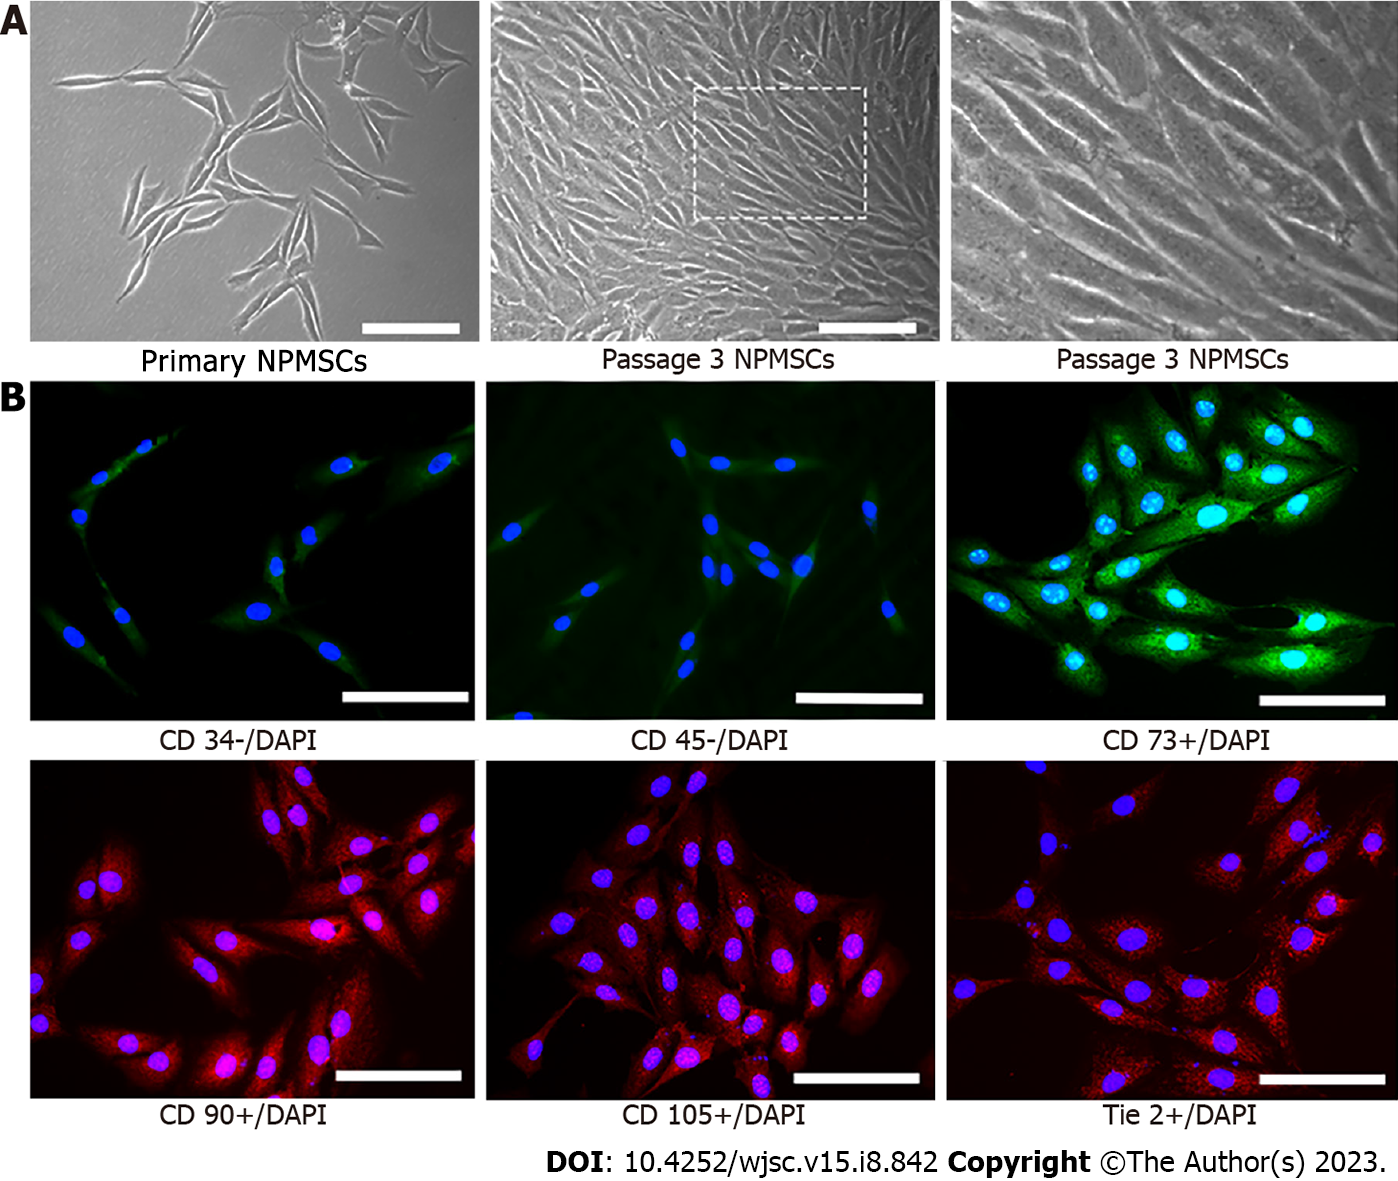
Figure 1 Identification of nucleus pulposus derived mesenchymal stem cells.
A: Primary nucleus pulposus-derived mesenchymal stem cells (NPMSCs) presented with elongated spindle shape and grew in flower formation; B: NPMSCs exhibited low fluorescent expression of CD34 and CD45, but a high fluorescent expression of CD73, CD90, and CD105. Scar bar = 100 μm.
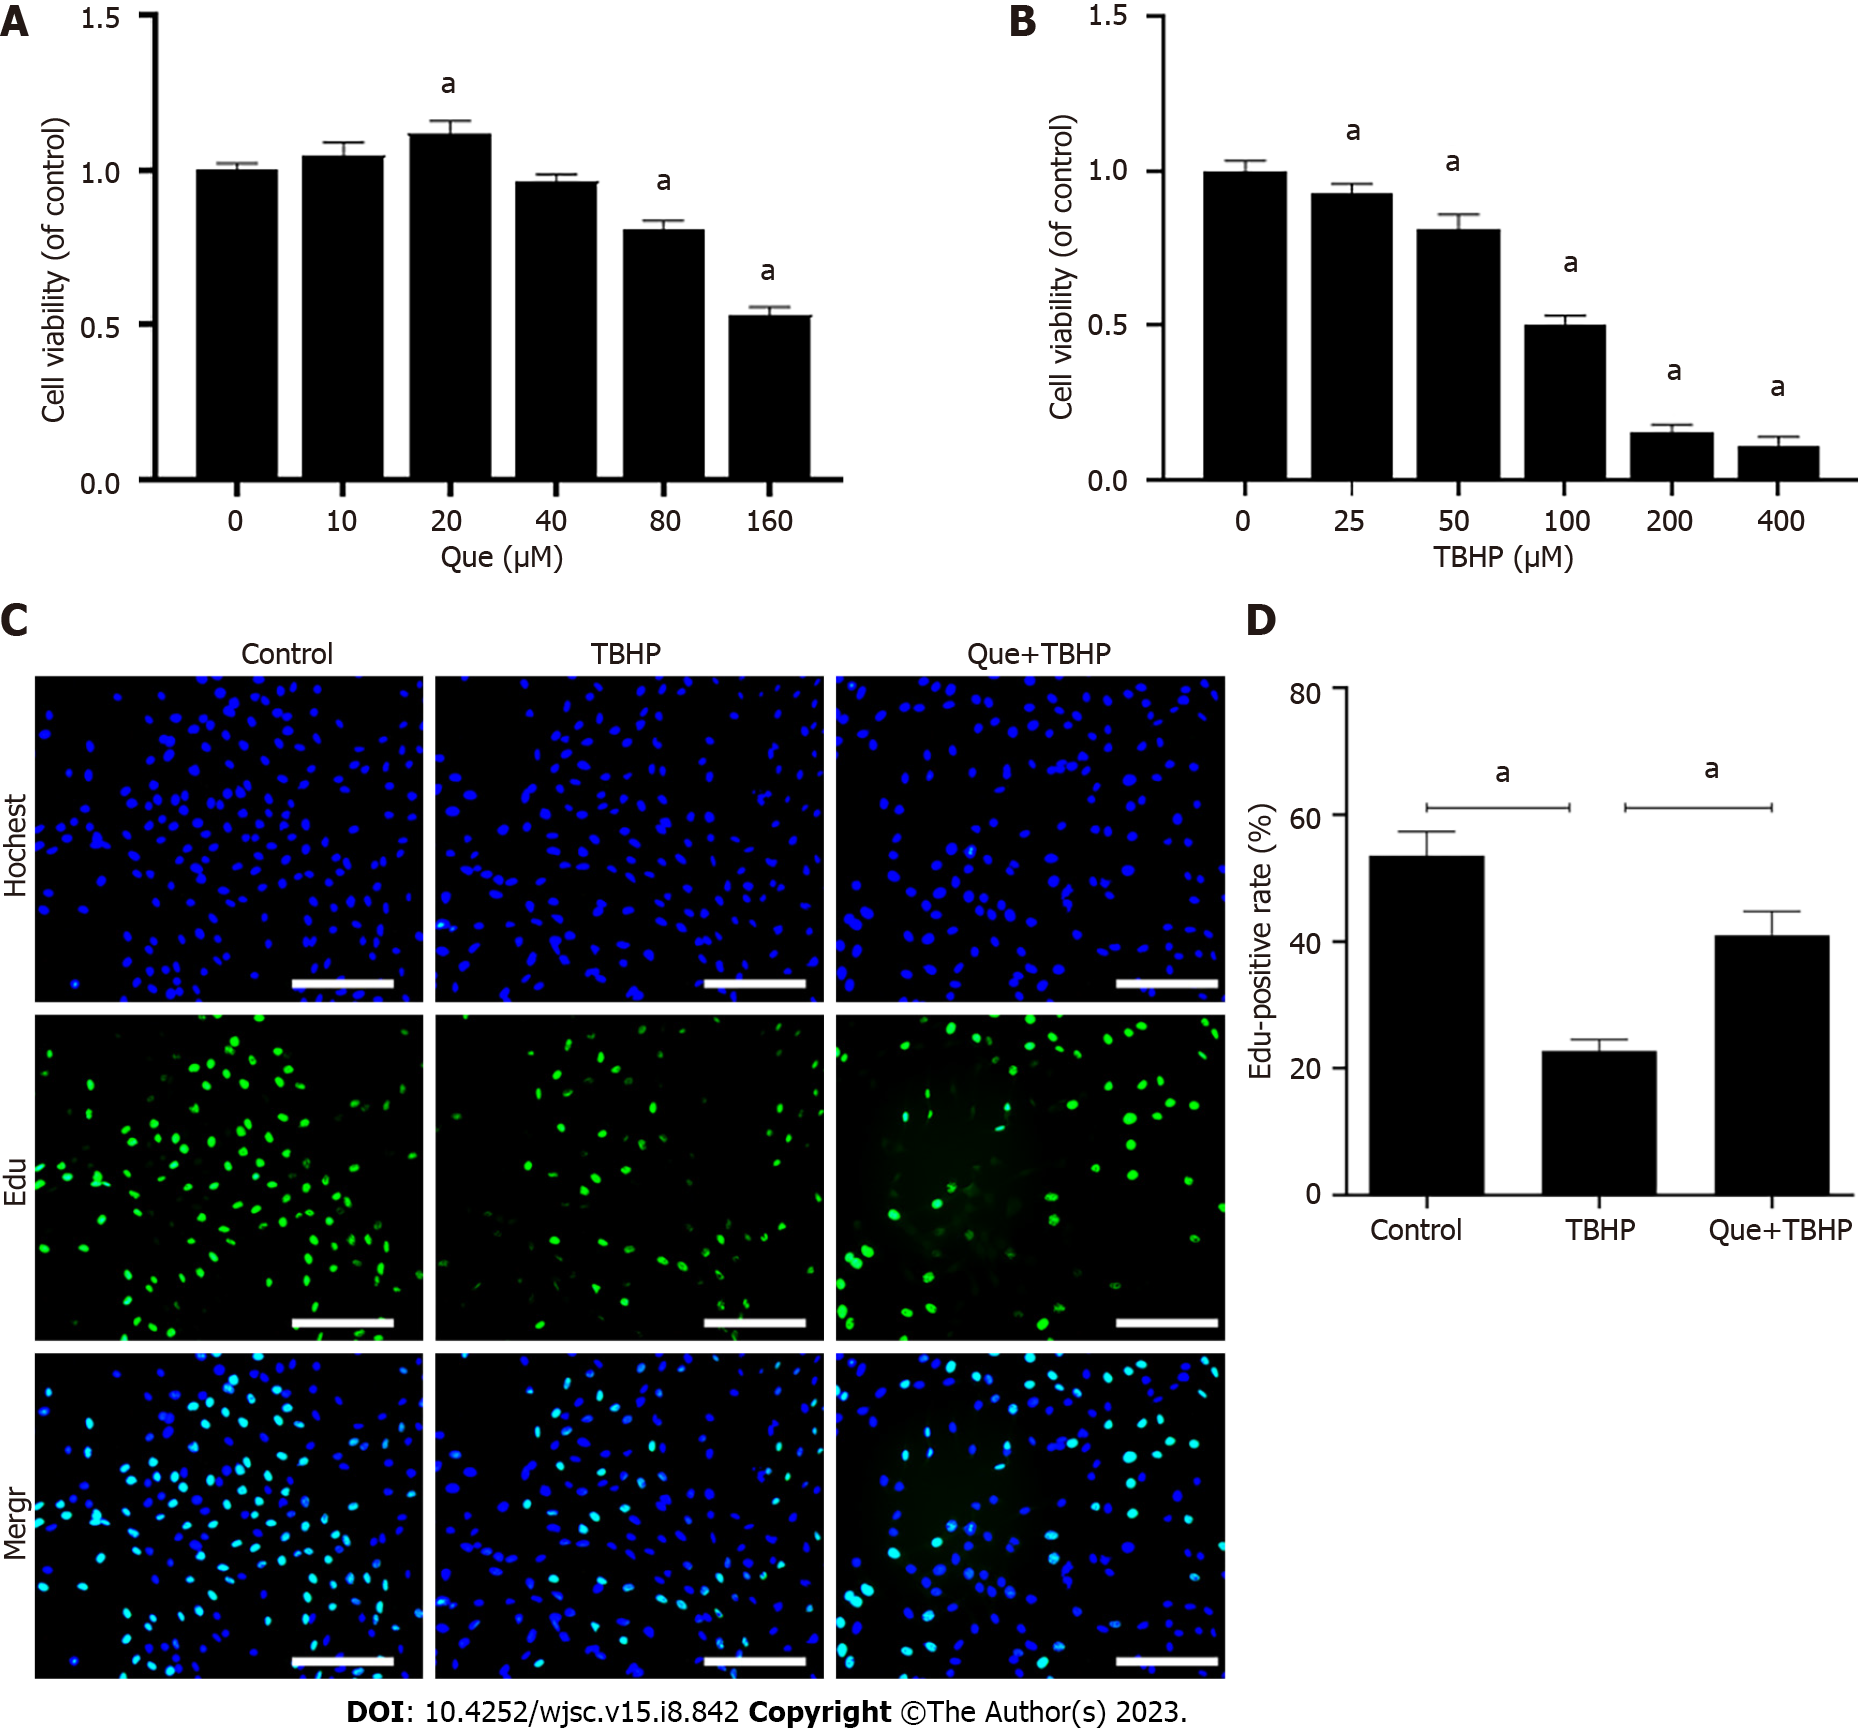
Figure 2 Cell viability assay and cell proliferation assay.
A: Cell counting kit-8 (CCK-8) results of nucleus pulposus-derived mesenchymal stem cells (NPMSCs) treated with different concentrations of quercetin for 24 h; B: CCK-8 results of NPMSCs treated with different concentrations of tert-butyl hydroperoxide (TBHP) for 24 h; C: EdU assay results of NPMSCs in different groups. Green fluorescence represents cells in a proliferating state, and blue fluorescence represents cell nucleus (scale bar = 200 μm); D: Quantitative analysis of EdU results. Data are represented as mean ± SD. aP < 0.05 compared with control group, n = 3. TBHP: Tert-butyl hydroperoxide; Que: Quercetin.
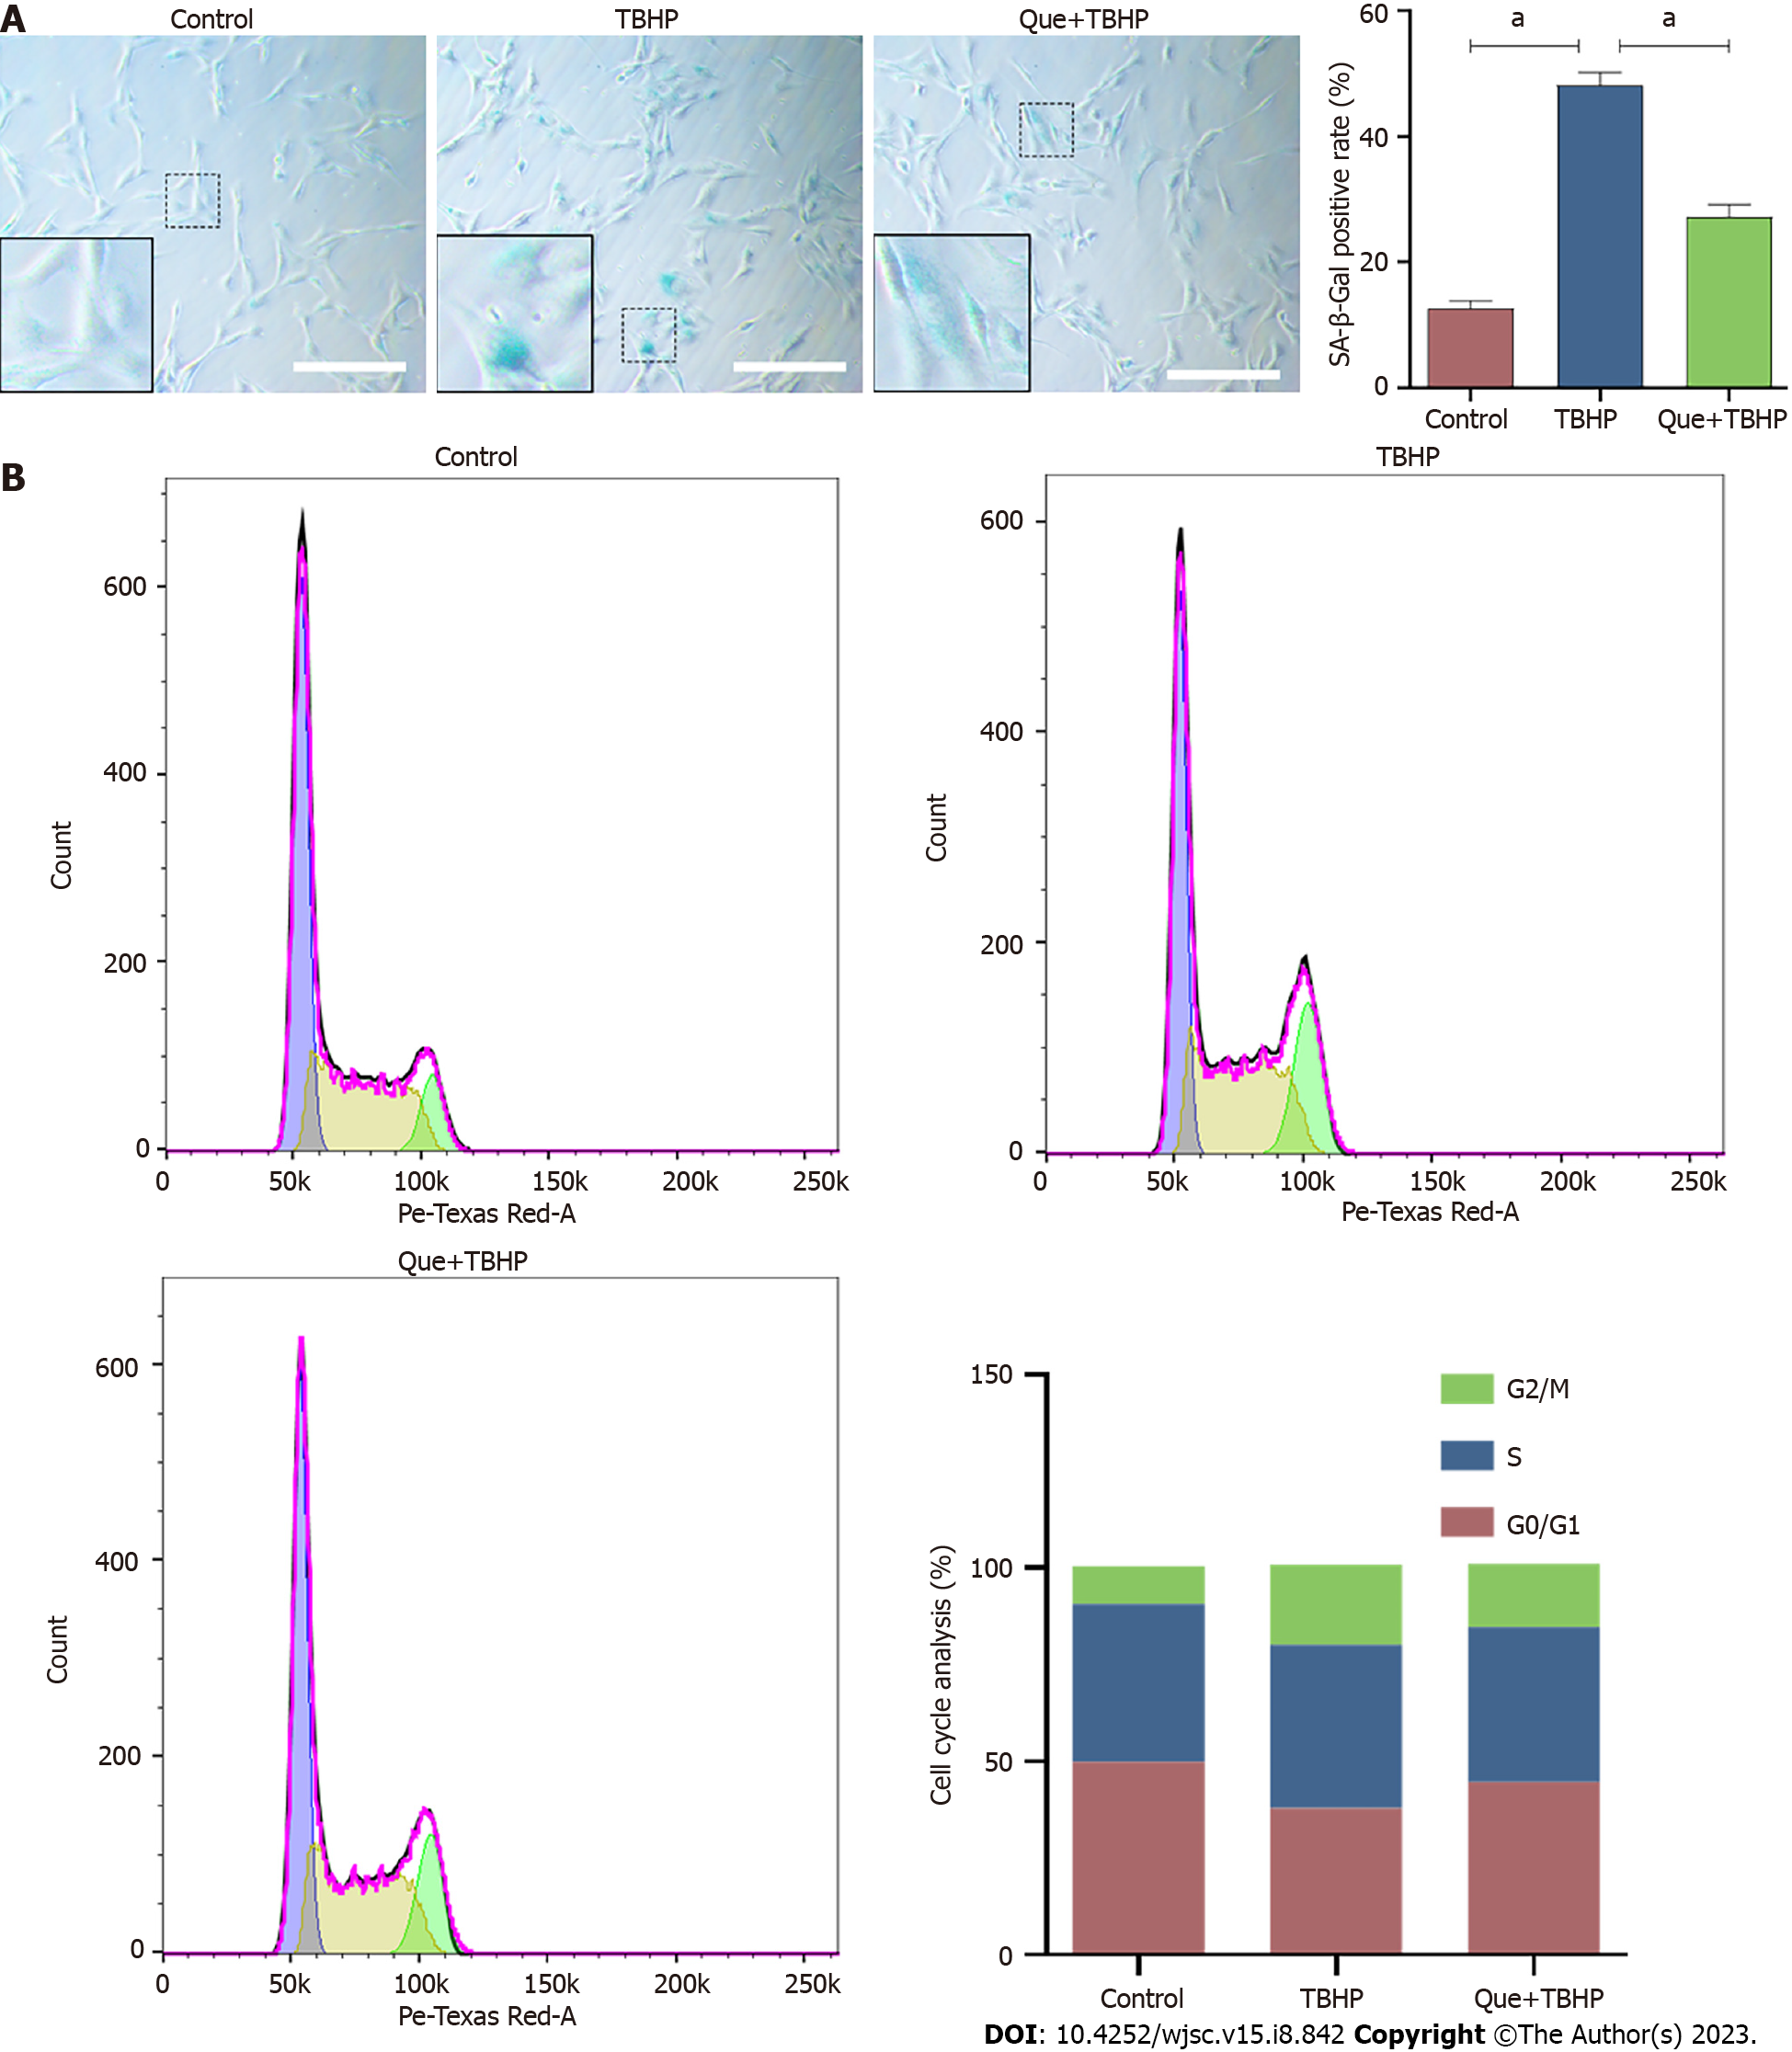
Figure 3 Senescence-associated β-Galactosidase staining assay and cell cycle assay.
A: Senescence-associated β-Galactosidase (SA-β-gal) staining results of nucleus pulposus-derived mesenchymal stem cells (NPMSCs) in different groups. Senescent cells exhibit high expression of SA-β-gal in blue staining; B: Cell cycle results of NPMSCs in different groups. Scar bar = 200 μm. Data are represented as mean ± SD. Significant differences between groups are indicated as aP < 0.05, n = 3. TBHP: Tert-butyl hydroperoxide; Que: Quercetin.
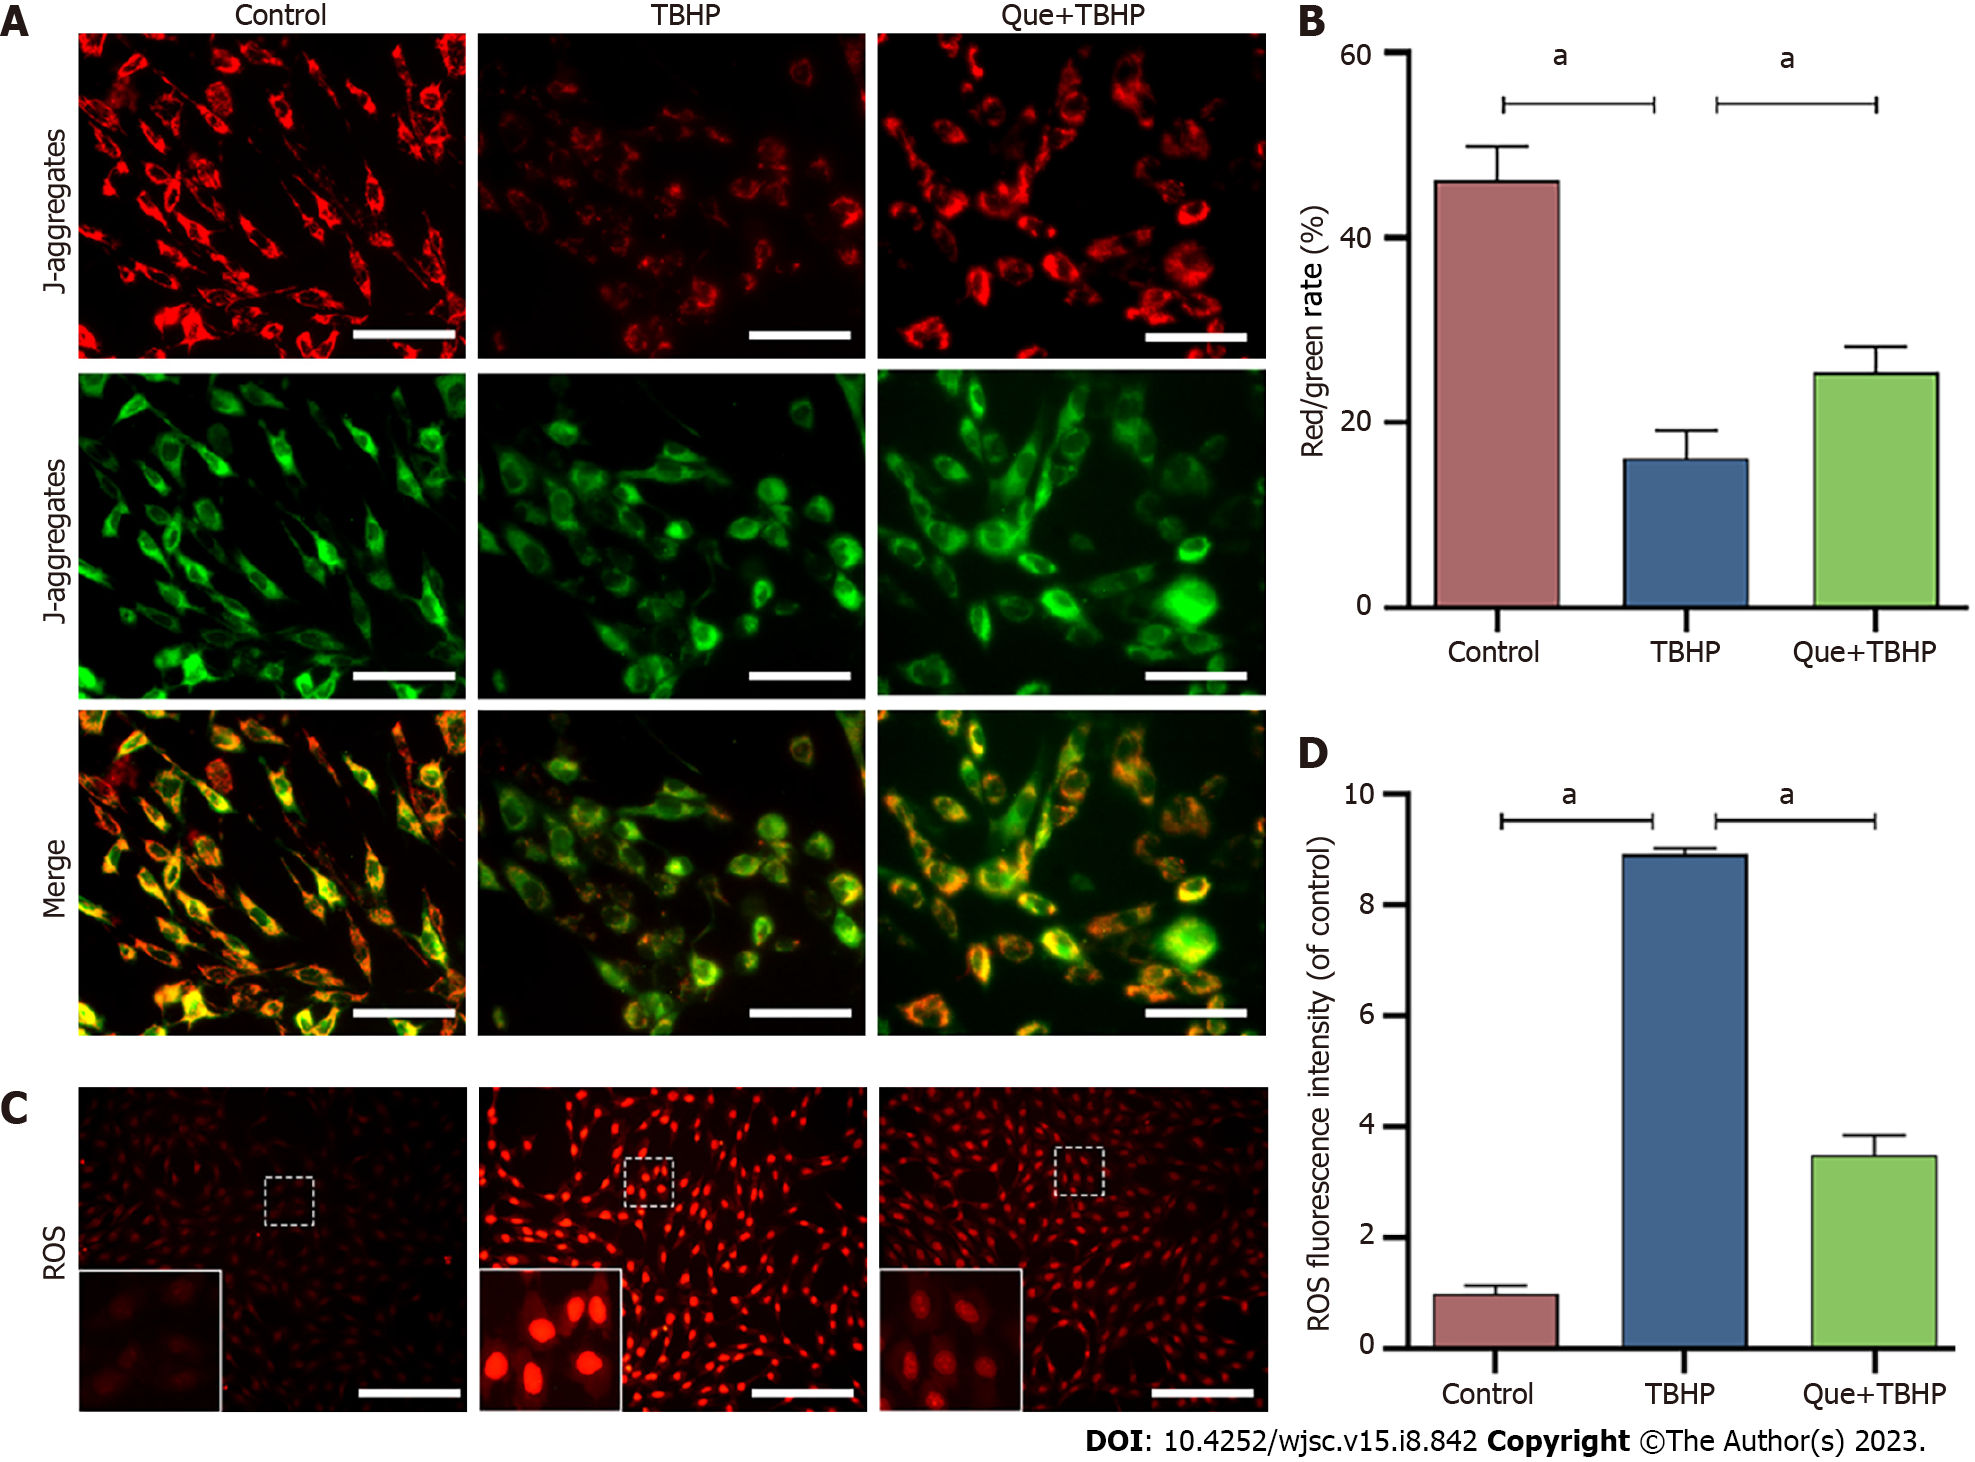
Figure 4 Mitochondrial membrane potential assay and reactive oxygen species assay.
A: Results of Mitochondrial membrane potential (MMP) in different groups detected by fluorescence. Red fluorescence represents the mitochondrial aggregate JC-1 and green fluorescence indicates the monomeric JC-1. Scale bar = 100 μm; B: Quantitative analysis of MMP results; C: Results of ROS in different groups detected by fluorescence. Red fluorescence represents high level of reactive oxygen species assay (ROS). Scale bar = 200 μm; D: Quantitative analysis of ROS results. Data are represented as mean ± SD. Significant differences between groups are indicated as aP < 0.05, n = 3. TBHP: Tert-butyl hydroperoxide; Que: Quercetin; ROS: Reactive oxygen species assay.
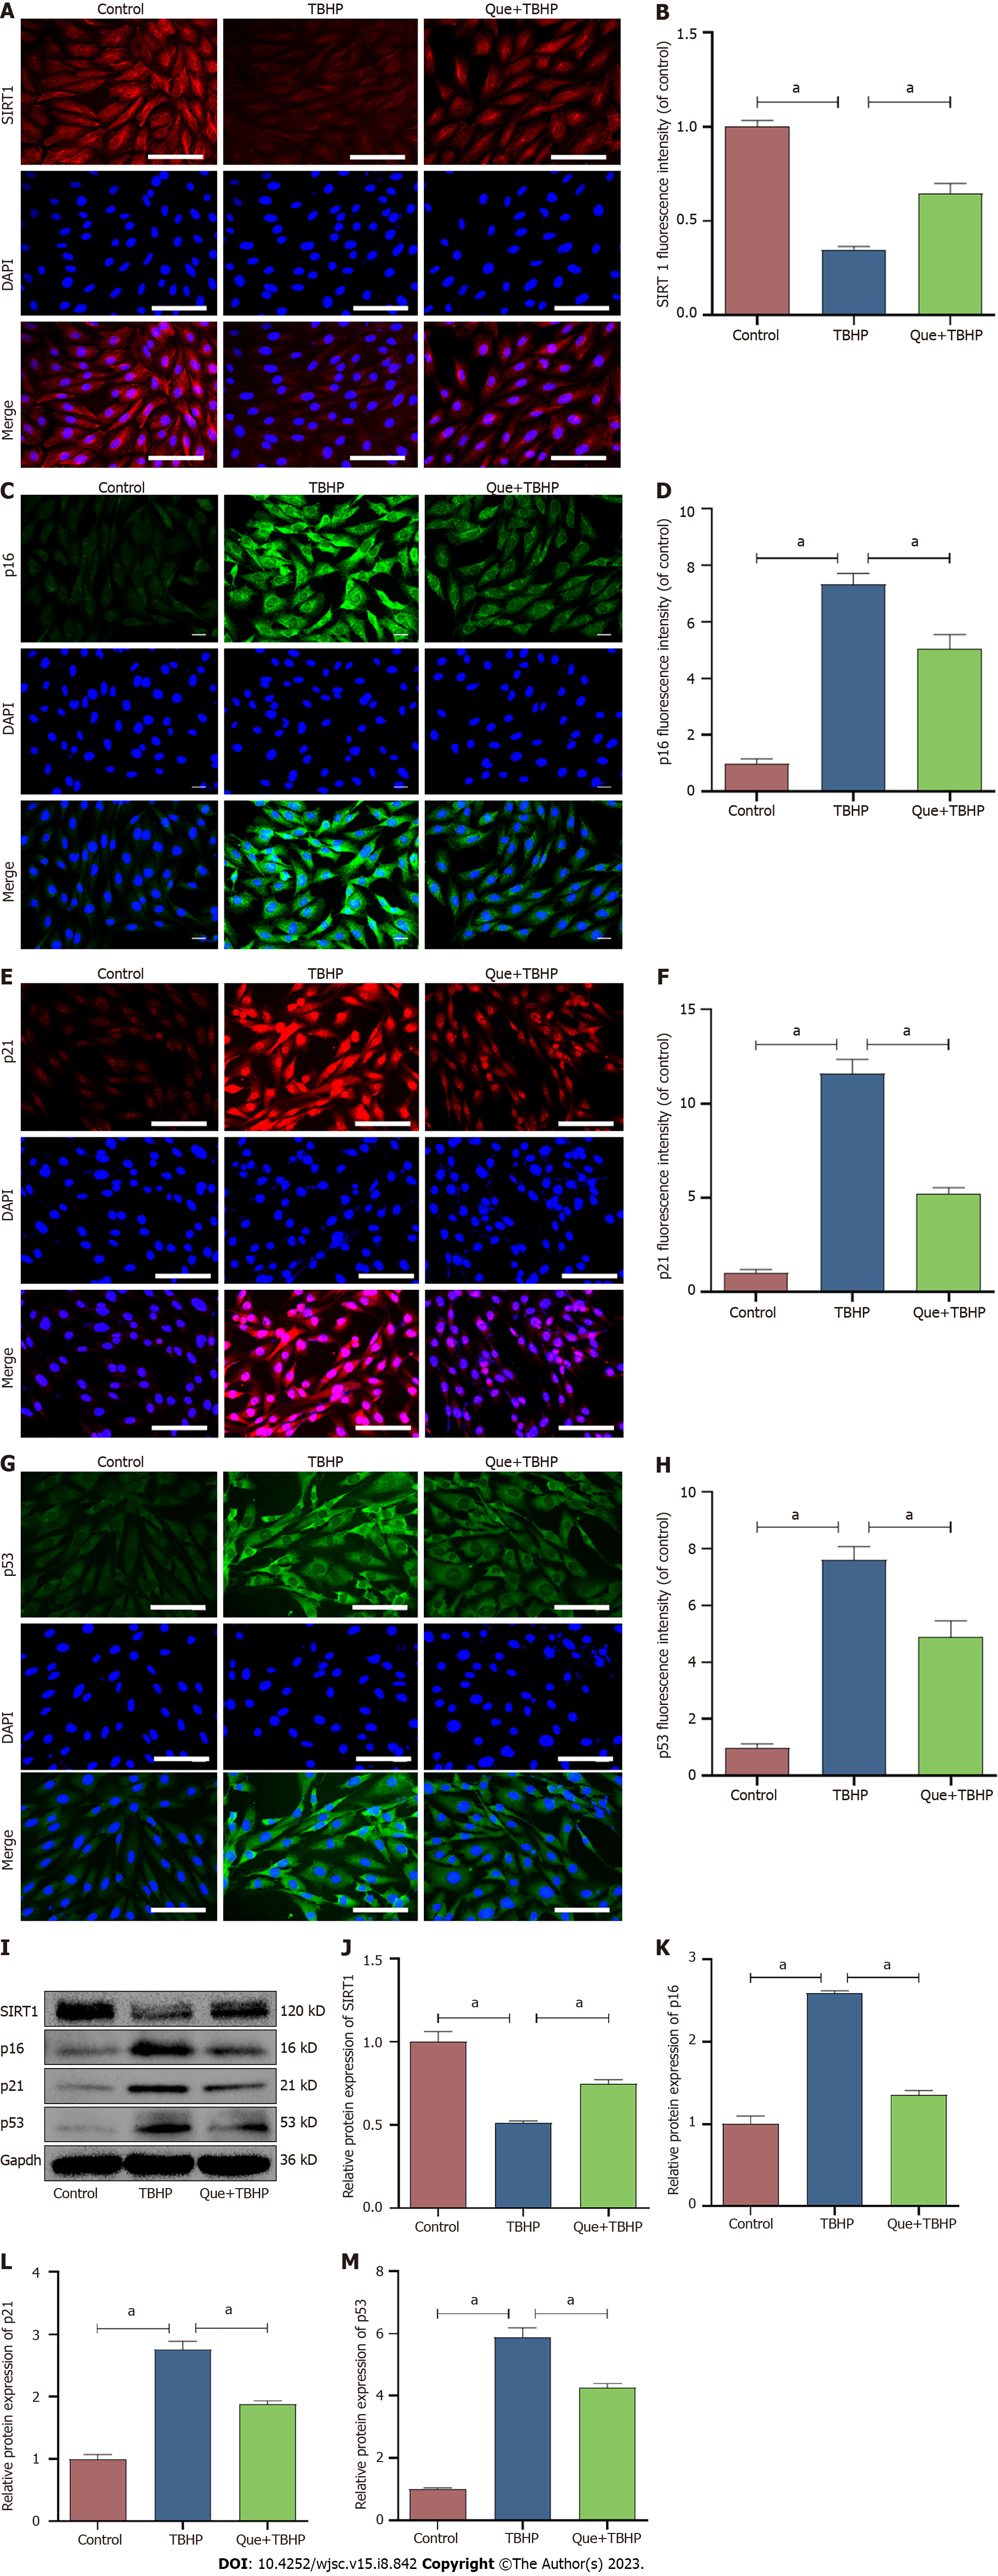
Figure 5 Quercetin upregulates the expression of SIRT1 and downregulates the expression of p16 and p21 and p53.
A and B: Immunofluorescence staining and quantitative analysis of SIRT1; C and D: Immunofluorescence staining and quantitative analysis of p16; E and F: Immunofluorescence staining and quantitative analysis of p21; G and H; Immunofluorescence staining and quantitative analysis of p53; I-M: The protein expressions and quantitative analysis of SIRT1, p16, p21 and p53 in the different groups. Scale bar = 100 μm. Data are represented as mean ± SD. Significant differences between groups are indicated as aP < 0.05, n = 3. TBHP: Tert-butyl hydroperoxide; Que: Quercetin.
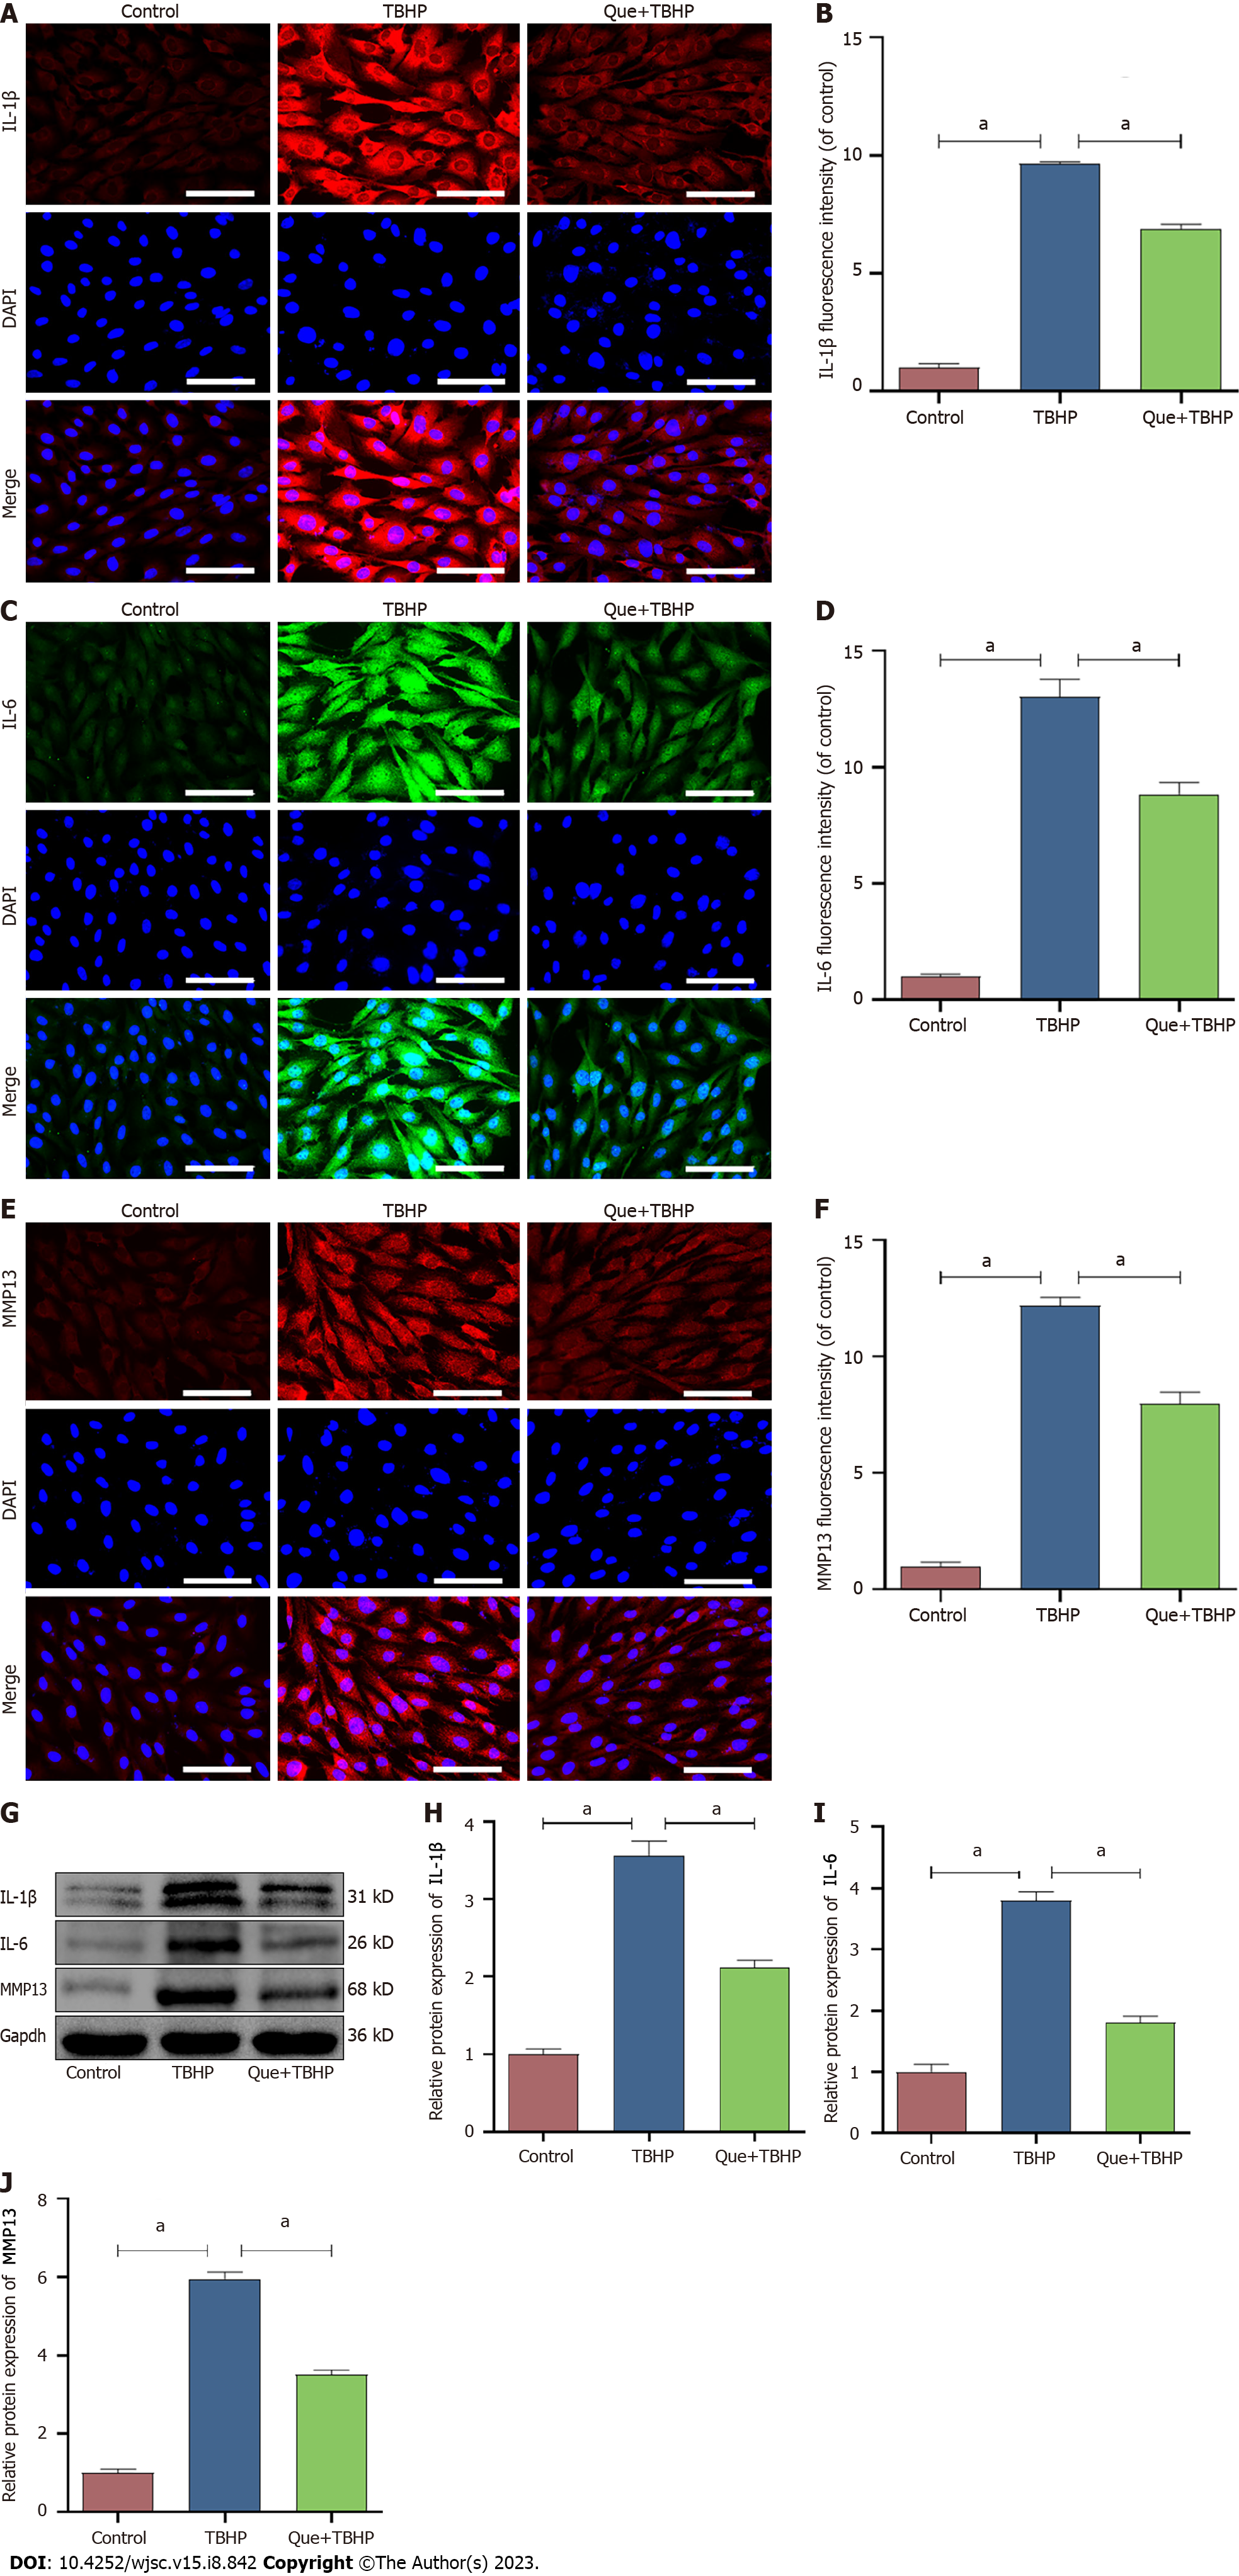
Figure 6 Quercetin downregulates the expression of senescence associated secreted phenotype: IL-1β, IL-6 and MMP13.
A and B: Immunofluorescence staining and quantitative analysis of IL-1β; C and D: Immunofluorescence staining and quantitative analysis of IL-6; E and F: Immunofluorescence staining and quantitative analysis of MMP-13; G-J: The protein expressions and quantitative analysis of IL-1β, IL-6 and MMP-13 in different groups. Scale bar = 100 μm. Data are represented as mean ± SD. Significant differences between groups are indicated as aP < 0.05, n = 3. TBHP: Tert-butyl hydroperoxide; Que: Quercetin.
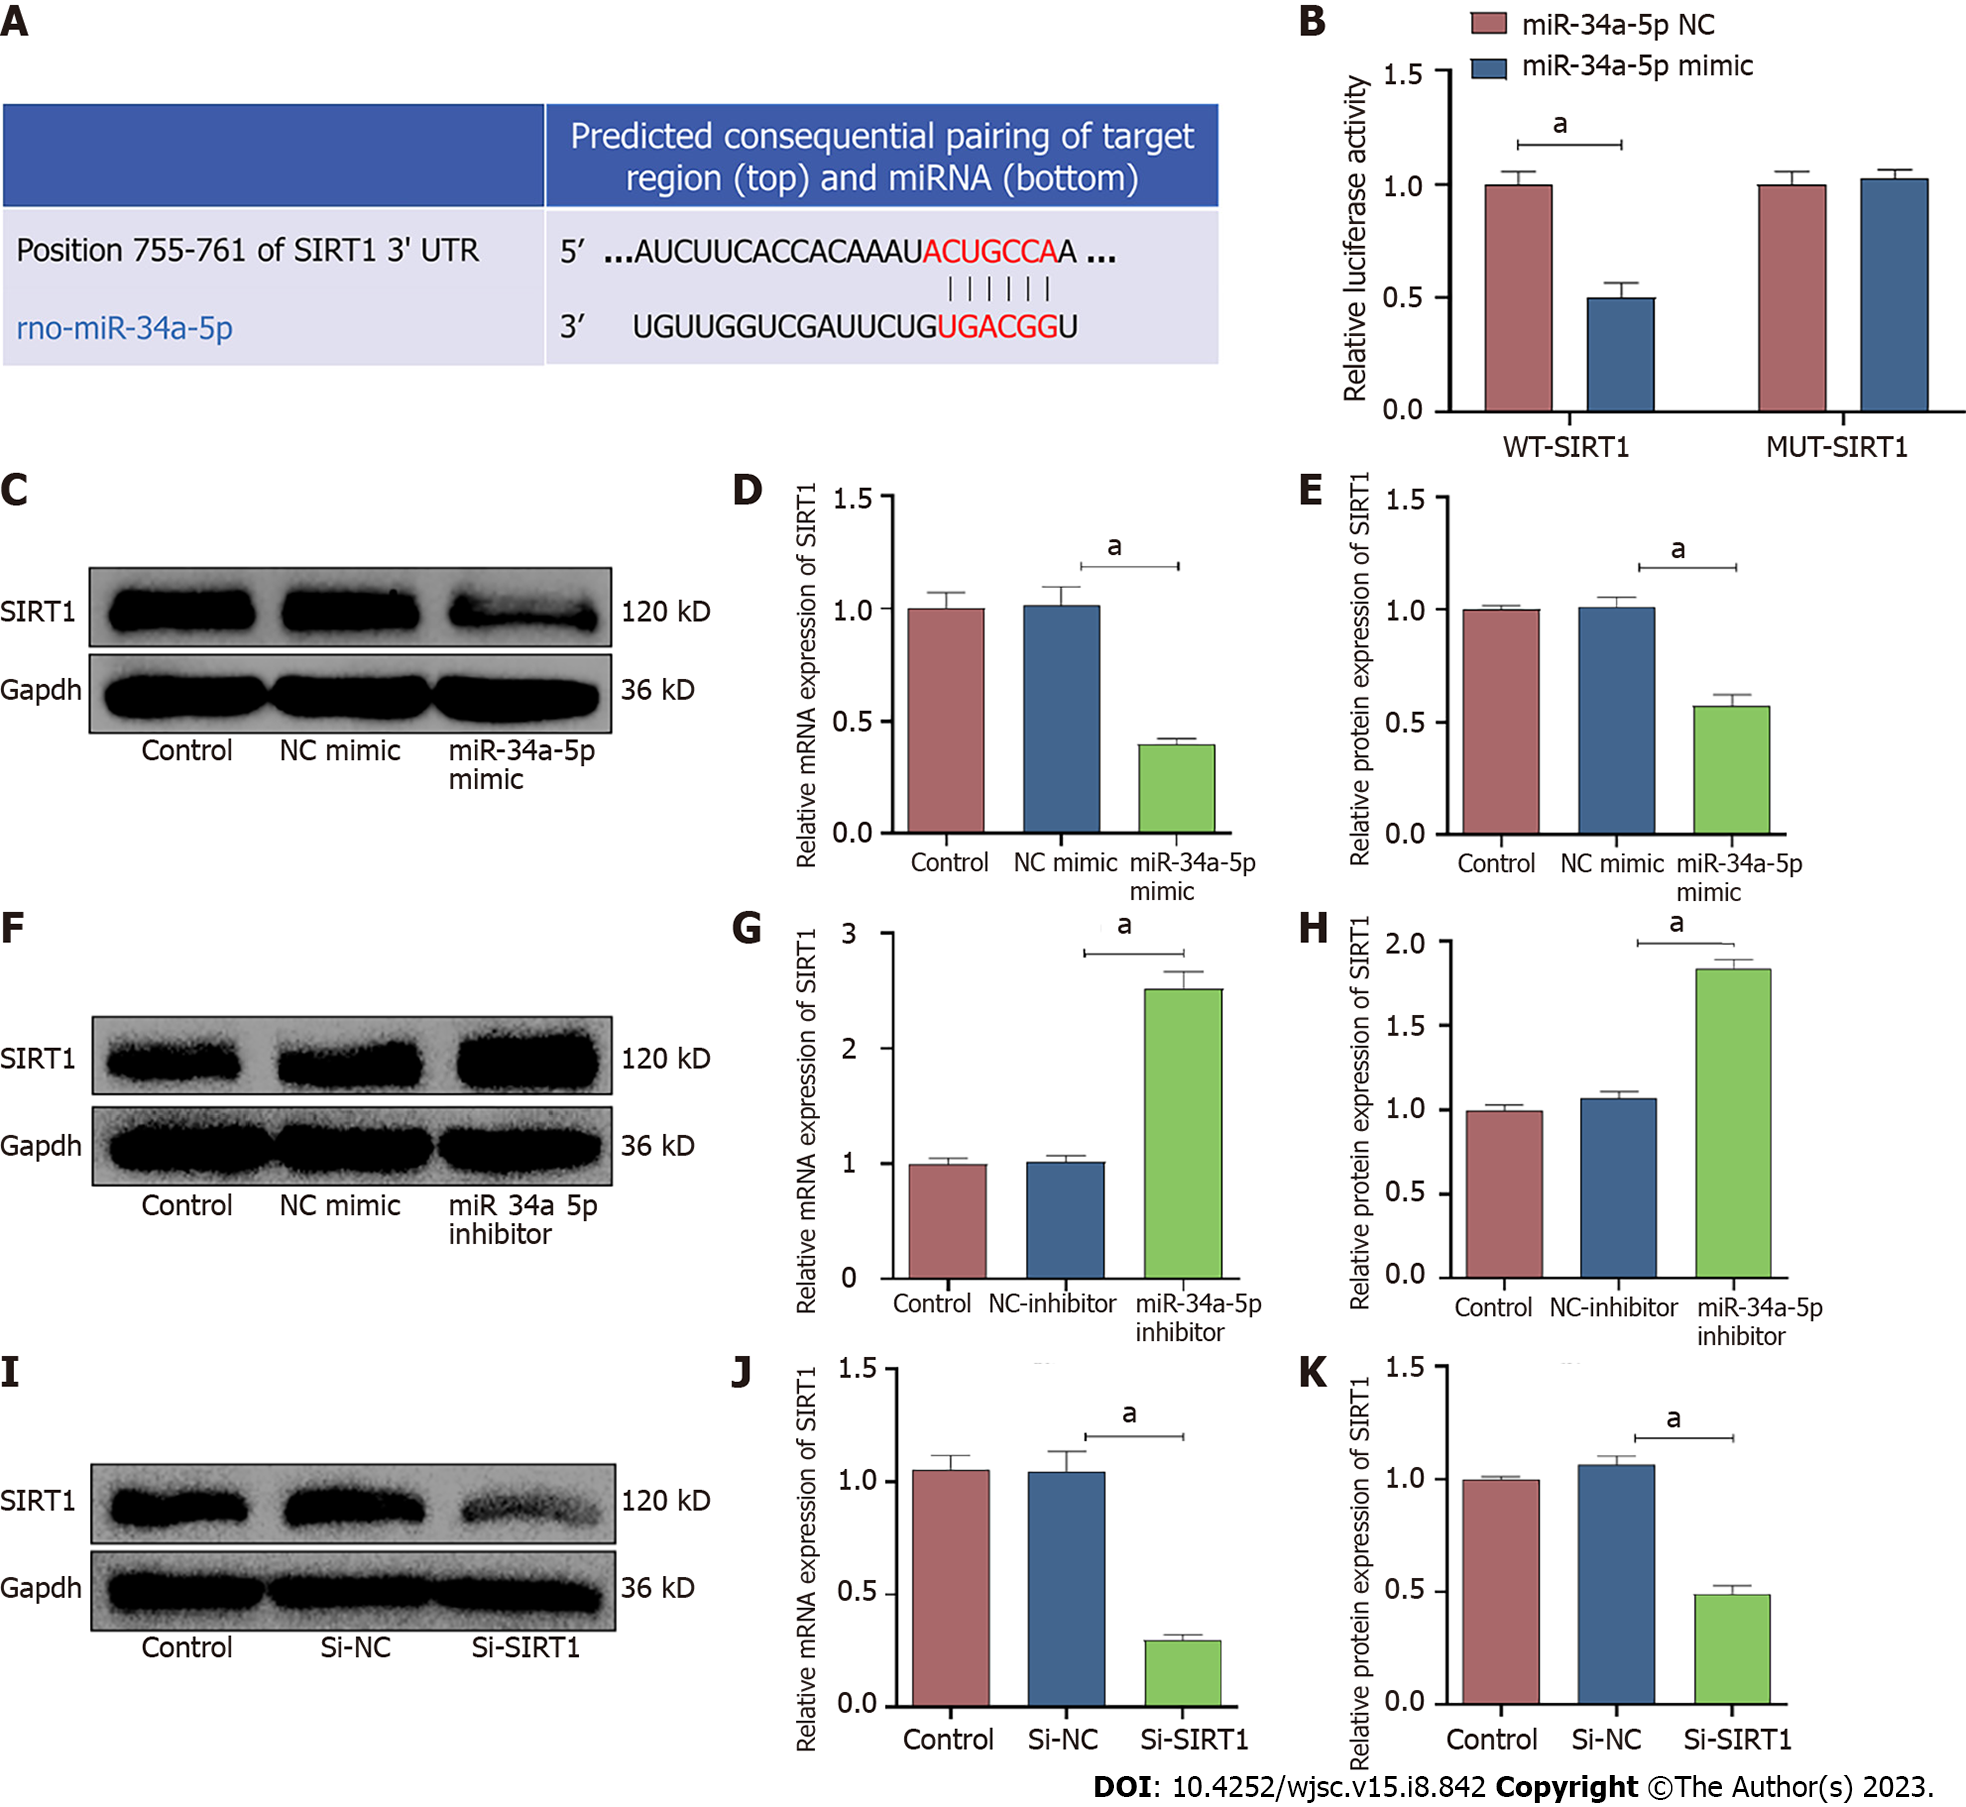
Figure 7 miR-34a-5p represses SIRT1 expression by targeting the 3'-UTR of SIRT1.
A: Schematic of the predicted miR-34a-5p binding sites in the 3'-UTR of SIRT1 mRNA from TargetScan online database; B: Luciferase reporter activity of SIRT1 co-transfected with miR-34a-5p nc or miR-34a-5p mimic; C-E: The protein and mRNA expression level of SIRT1 in nucleus pulposus-derived mesenchymal stem cells (NPMSCs) transfected with miR-34a-5p mimic; F-H: The protein and mRNA expression level of SIRT1 in NPMSCs transfected with miR-34a-5p inhibitor; I-K: The protein and mRNA expression level of SIRT1 in NPMSCs transfected with Si-SIRT1. Data are represented as mean ± SD. Significant differences between groups are indicated as aP < 0.05, n = 3. TBHP: Tert-butyl hydroperoxide.
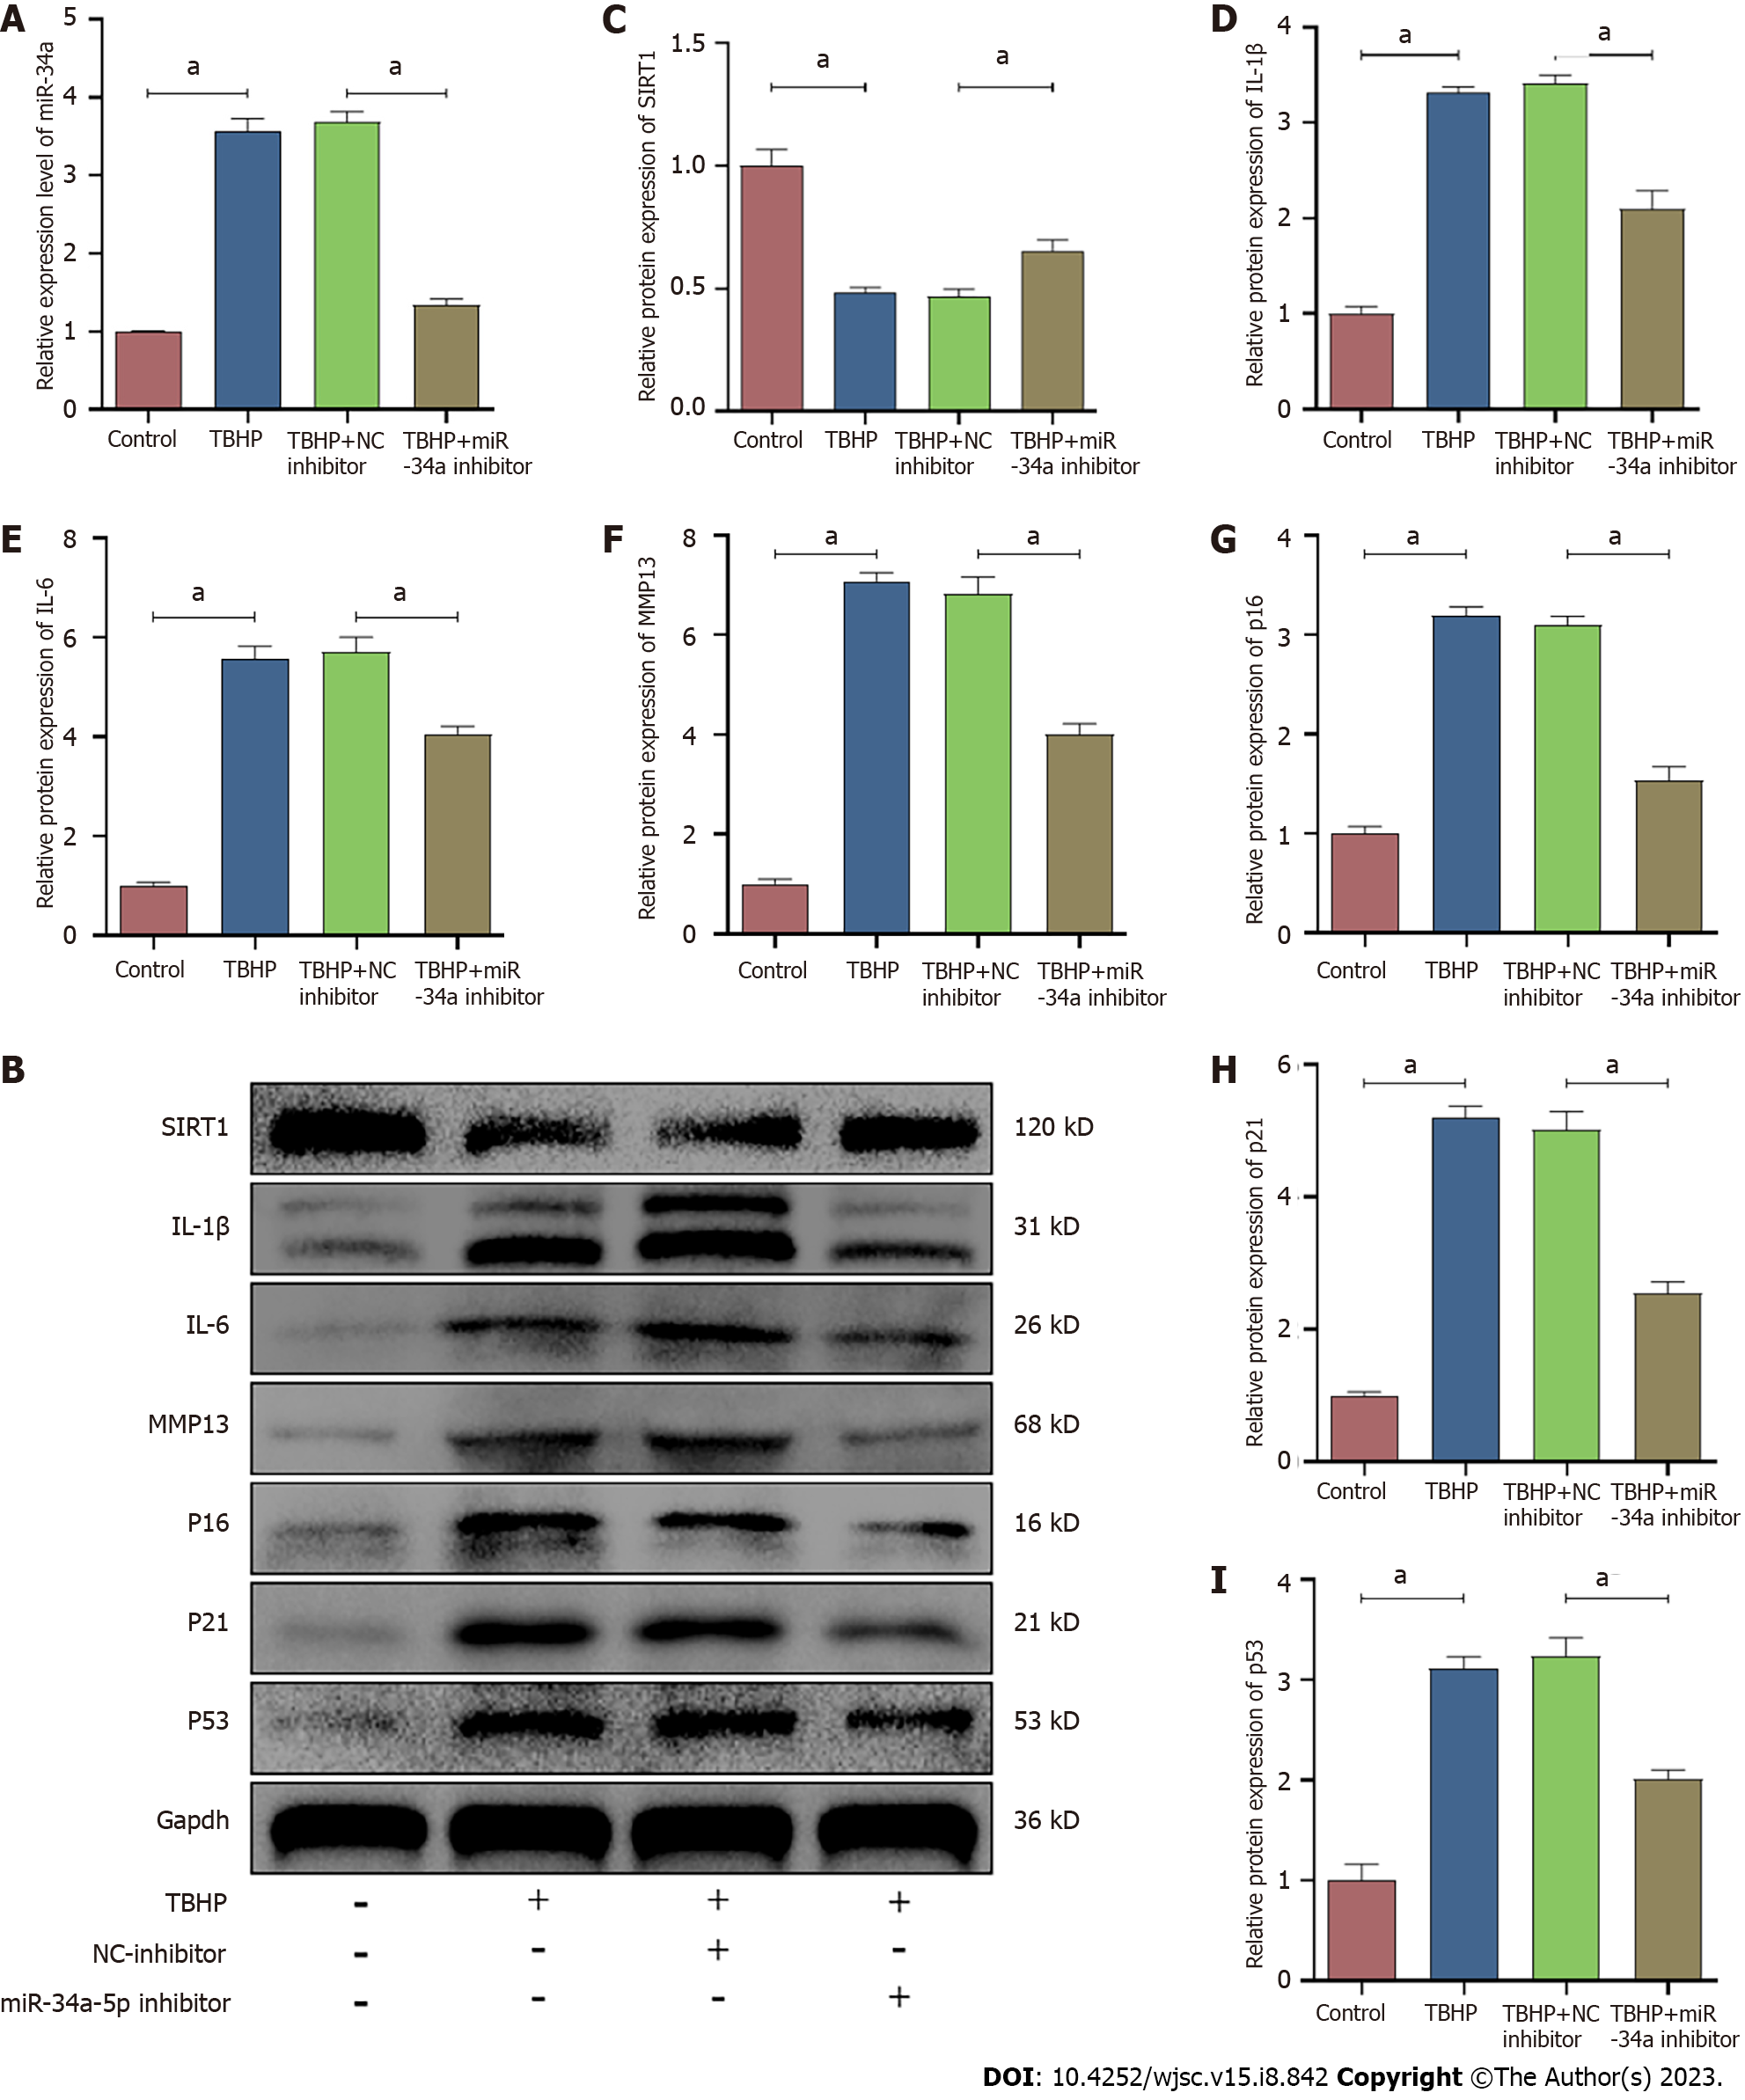
Figure 8 Downregulation of miR-34a-5p alleviated oxidative stress-induced nucleus pulposus-derived mesenchymal stem cells senescence.
A: The RNA levels of miR-34a-5p in nucleus pulposus-derived mesenchymal stem cells (NPMSCs) were transfected with miR-34a-5p inhibitor and treated with tert-butyl hydroperoxide; B: The protein levels of SIRT1, p16, p21, p53, IL-1β, IL-6 and MMP-13 in NPMSCs transfected with miR-34a-5p inhibitor; C-I: Quantitative analysis of protein expression in the different groups. Data are represented as mean ± SD. Significant differences between groups are indicated as aP < 0.05, n = 3. TBHP: Tert-butyl hydroperoxide.
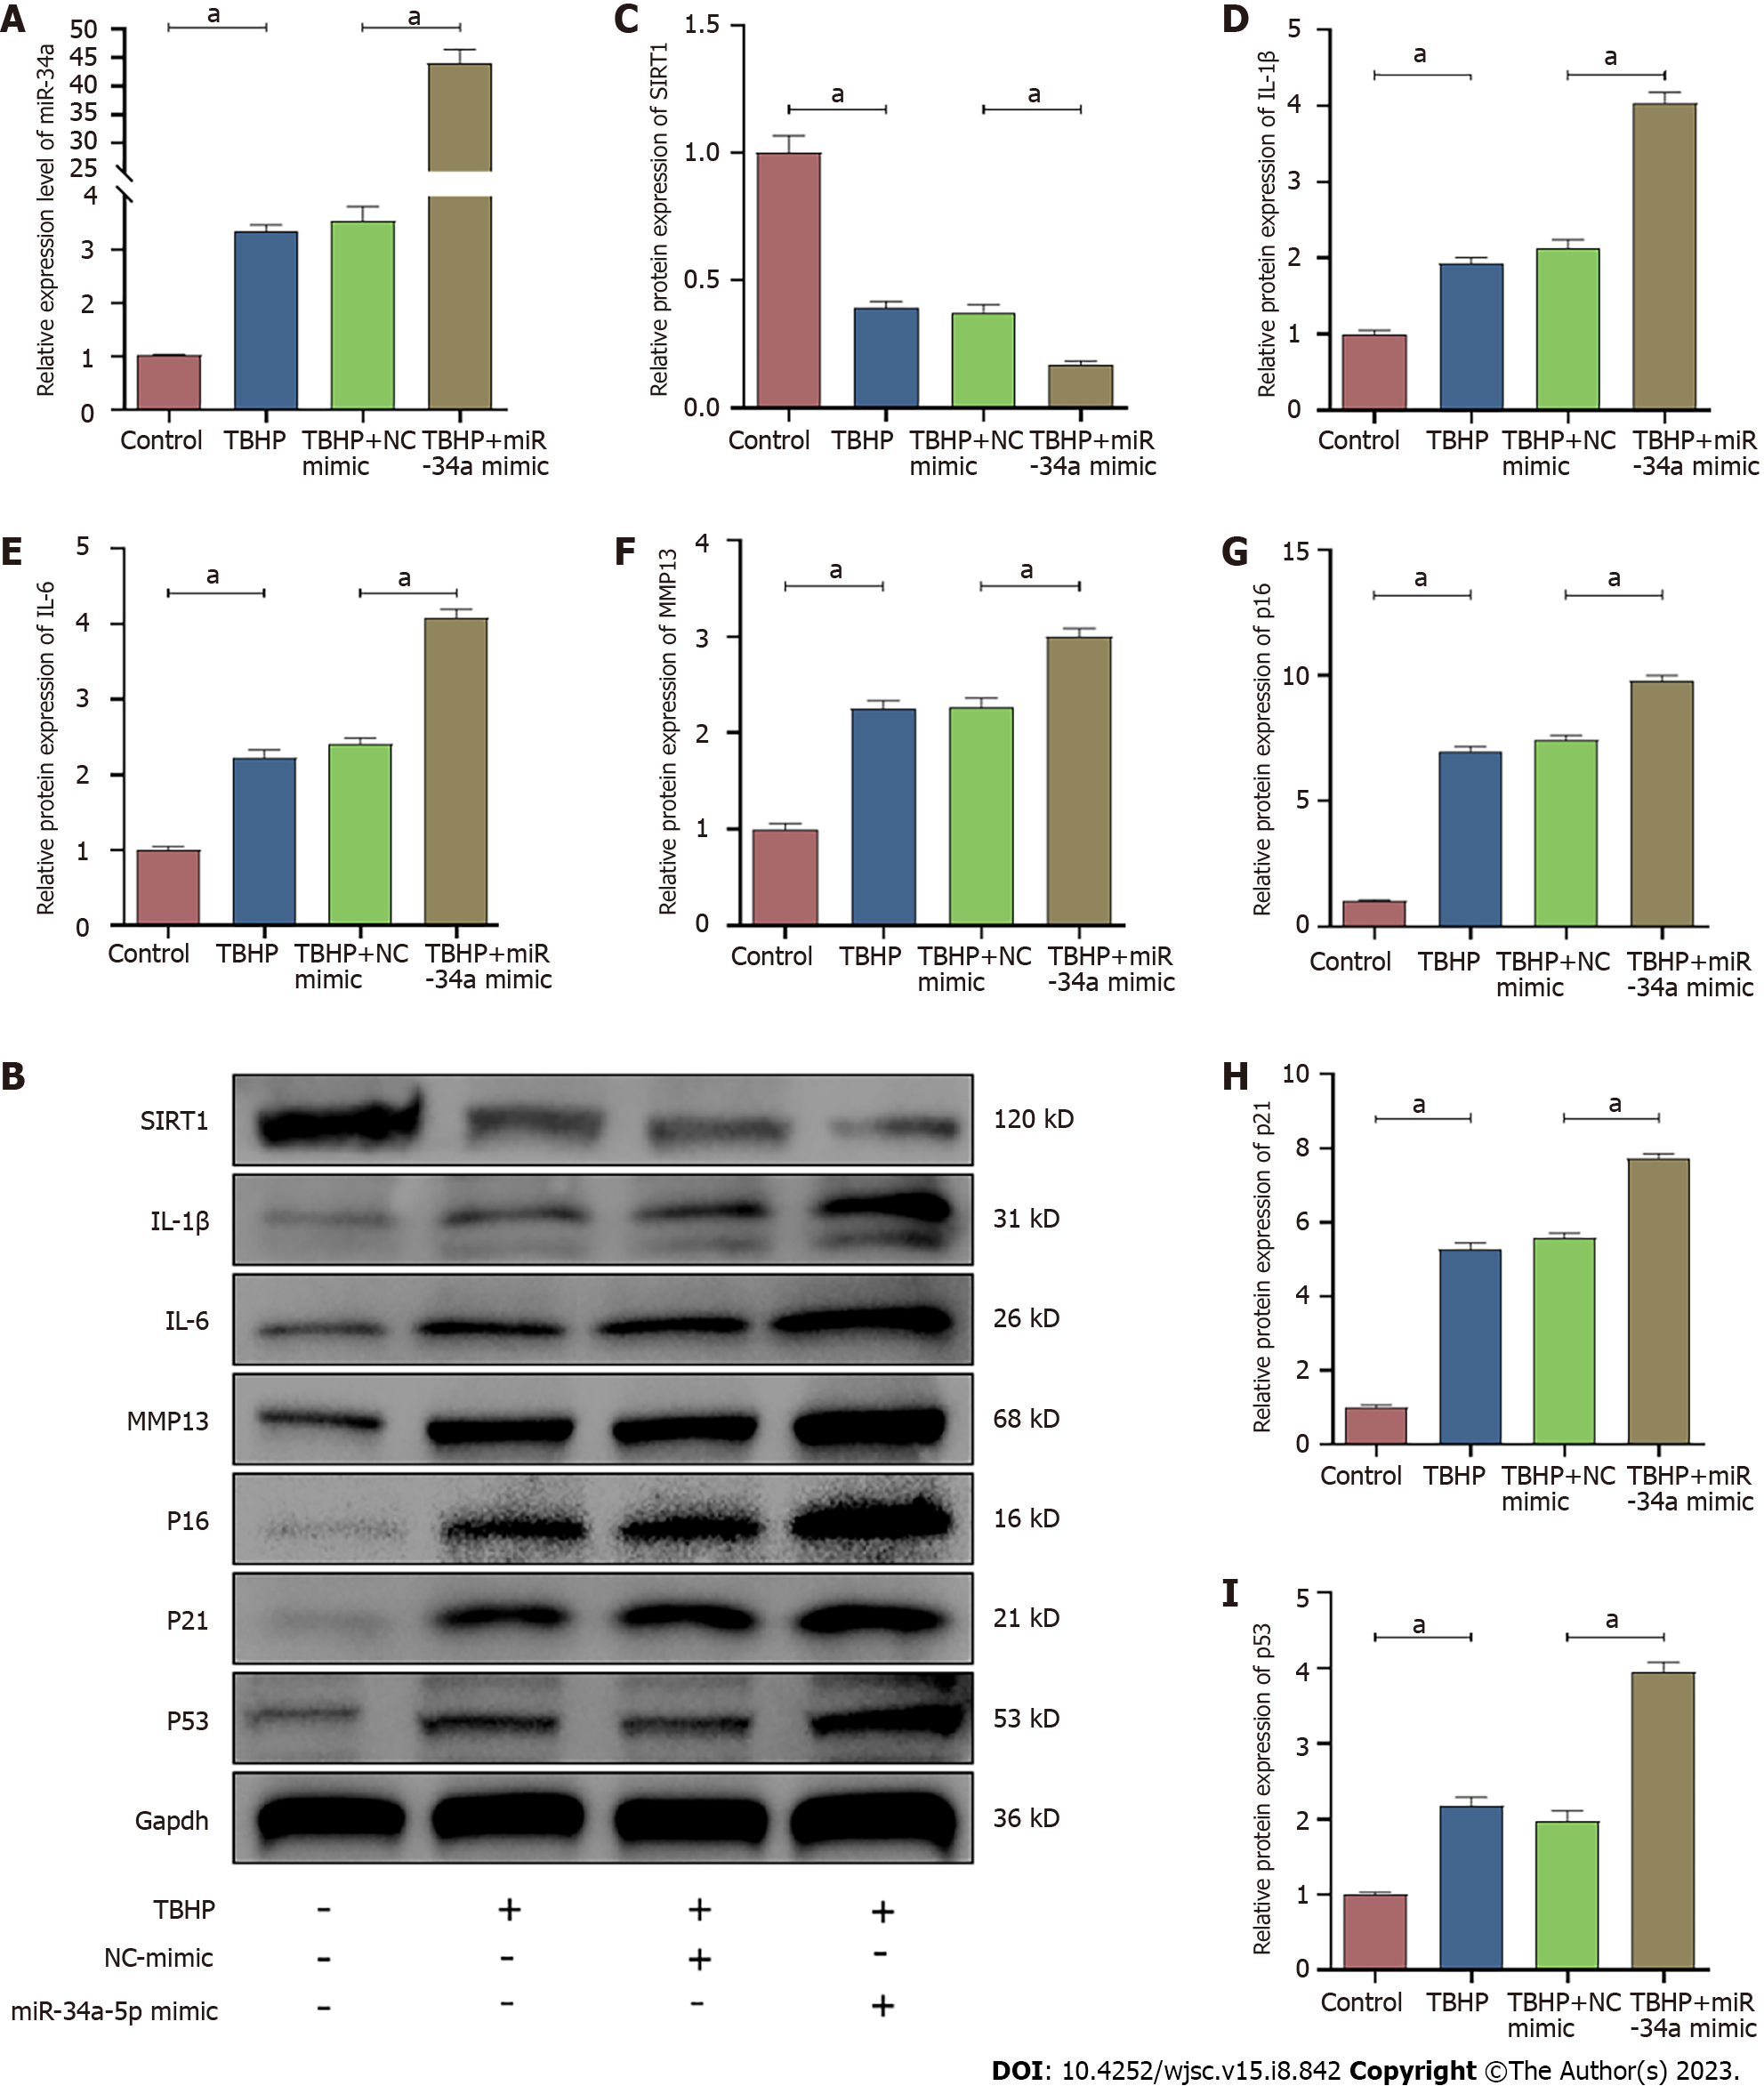
Figure 9 Overexpression of miR-34a-5p enhanced oxidative stress-induced nucleus pulposus-derived mesenchymal stem cells senescence.
A: The RNA levels of miR-34a-5p in nucleus pulposus-derived mesenchymal stem cells (NPMSCs) were transfected with miR-34a-5p mimic and treated with TBHP; B: The protein levels of SIRT1, p16, p21, p53, IL-1β, IL-6 and MMP-13 in NPMSCs transfected with miR-34a-5p mimic; C-I: Quantitative analysis of protein expression in different groups. Data are represented as mean ± SD. Significant differences between groups are indicated as aP < 0.05, n = 3. TBHP: Tert-butyl hydroperoxide.
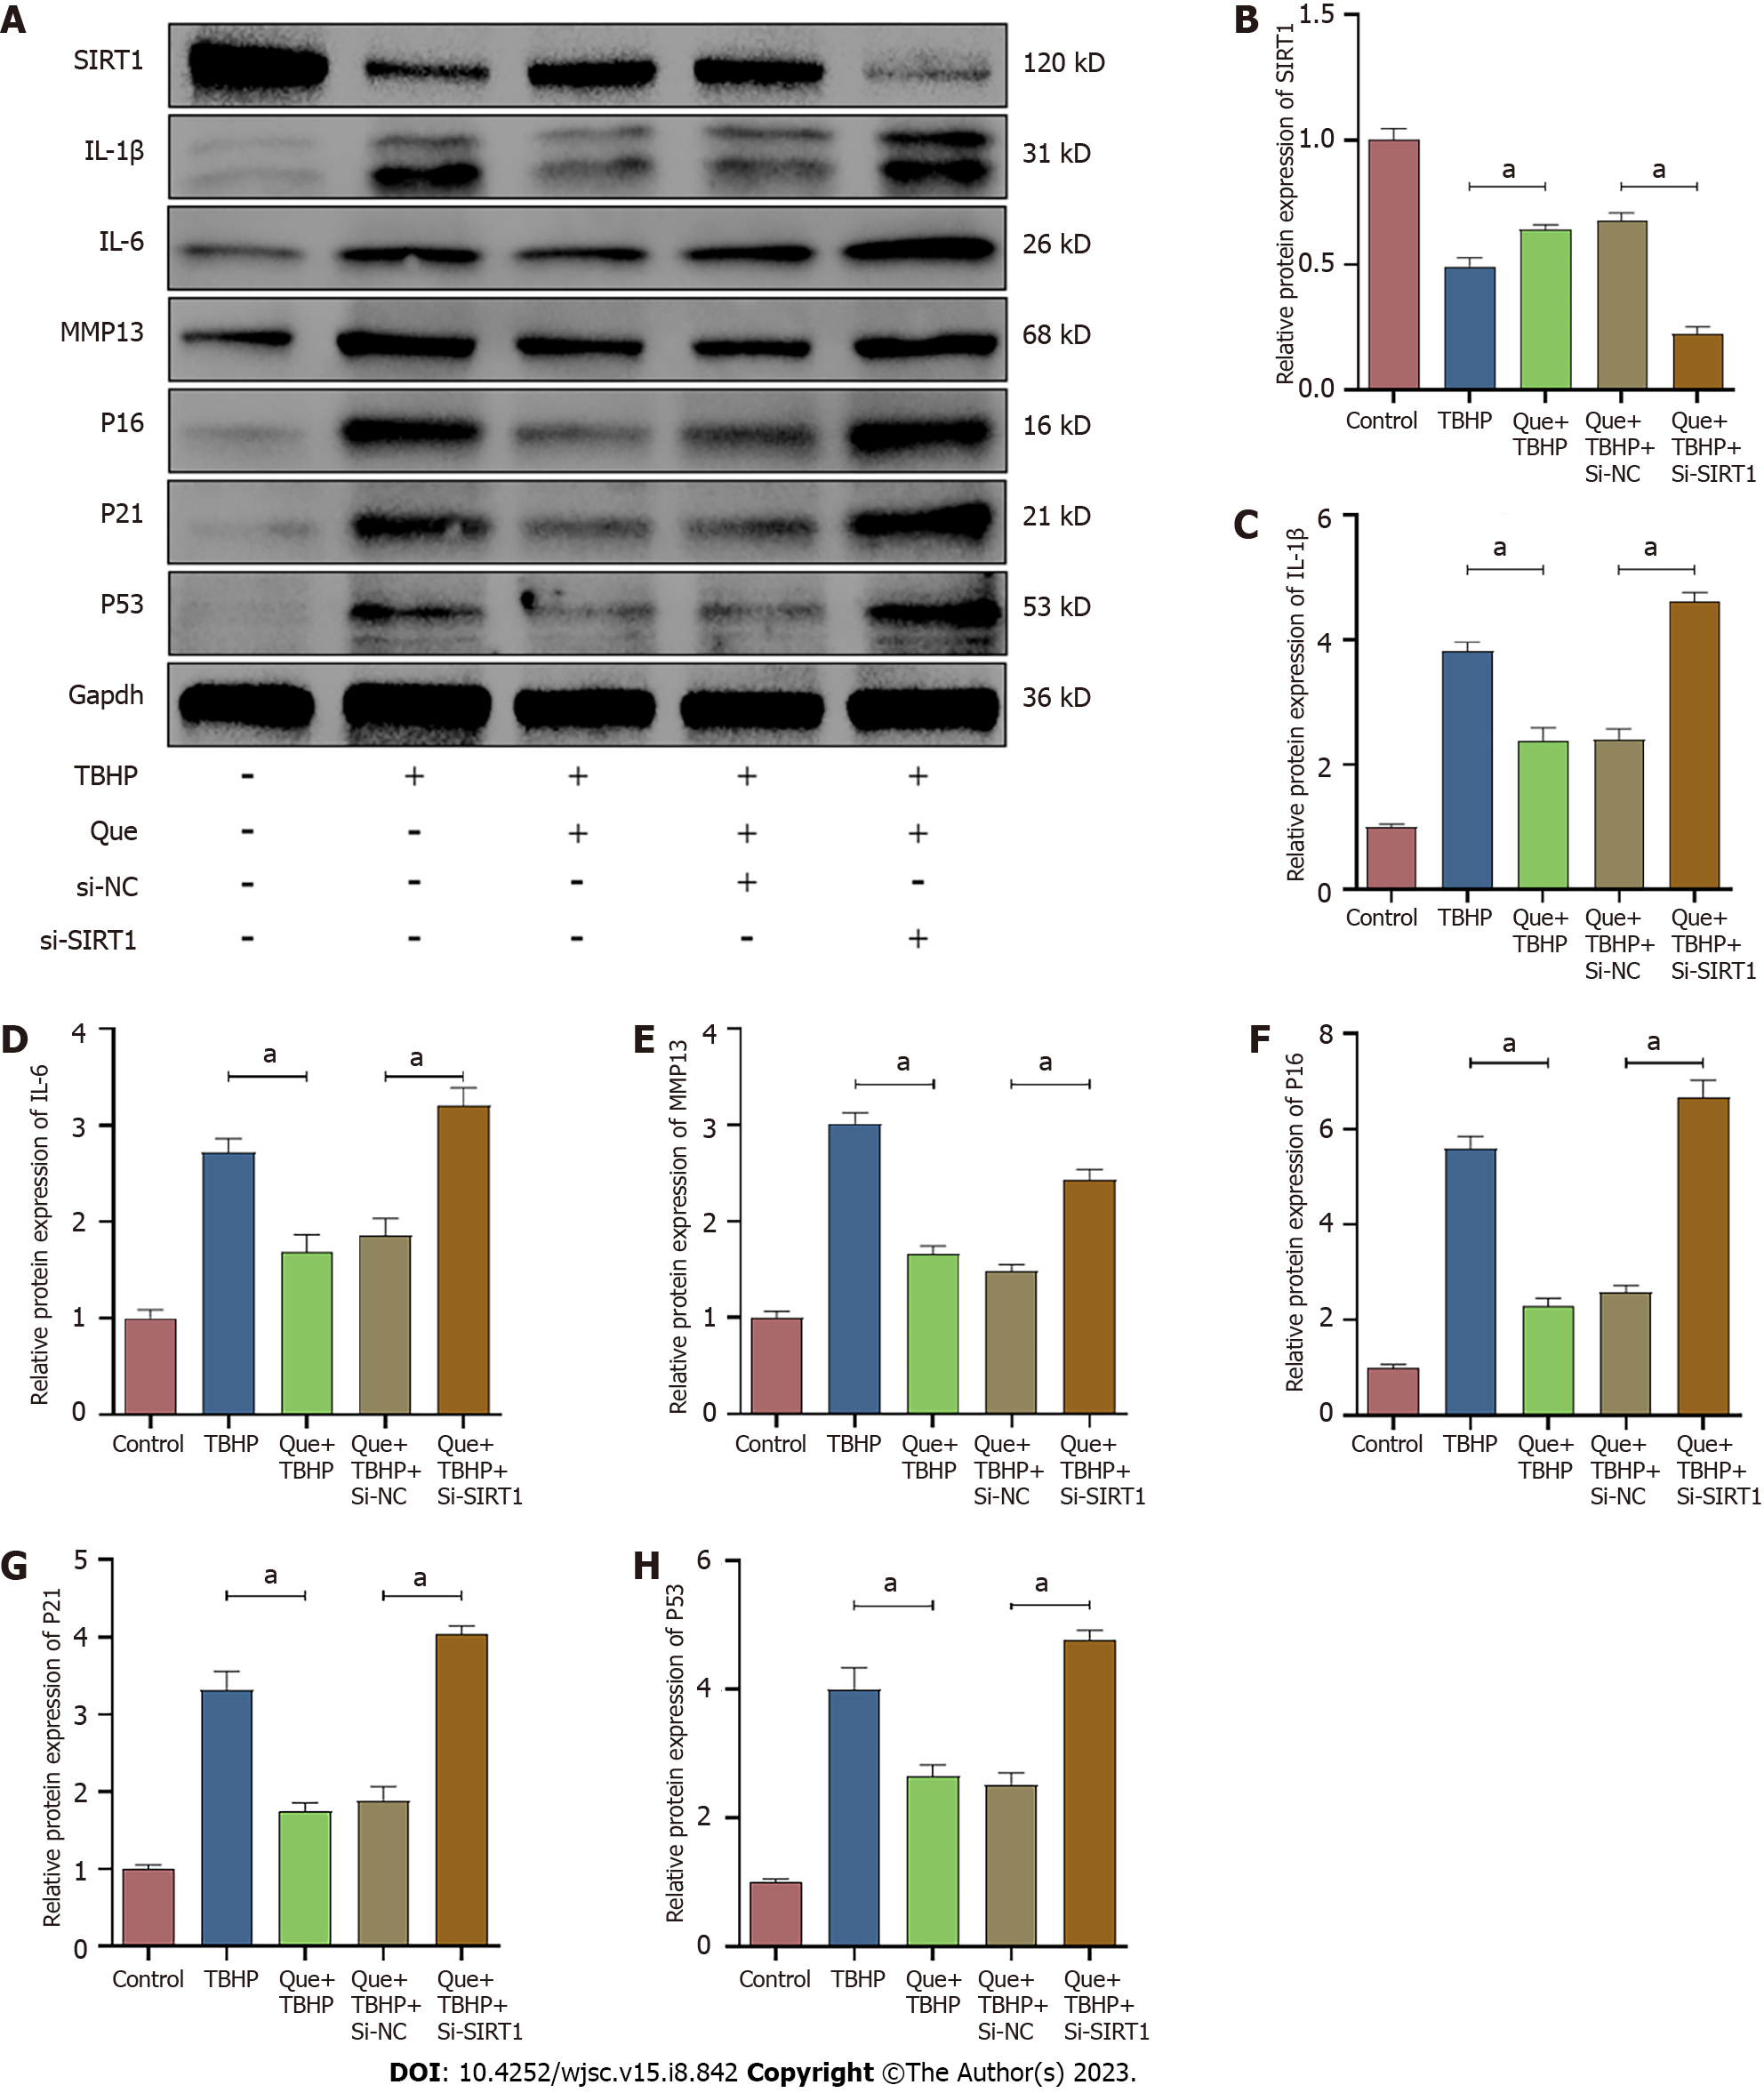
Figure 10 Quercetin alleviates TBHP-induced senescence via miR-34a-5p/SIRT1 axis.
A: The protein levels of SIRT1, p16, p21, p53, IL-1β, IL-6 and MMP-13 in different groups; B-H: Quantitative analysis of protein expression in different groups. Data are represented as mean ± SD. Significant differences between groups are indicated as aP < 0.05, n = 3. TBHP: Tert-butyl hydroperoxide; Que: Quercetin.
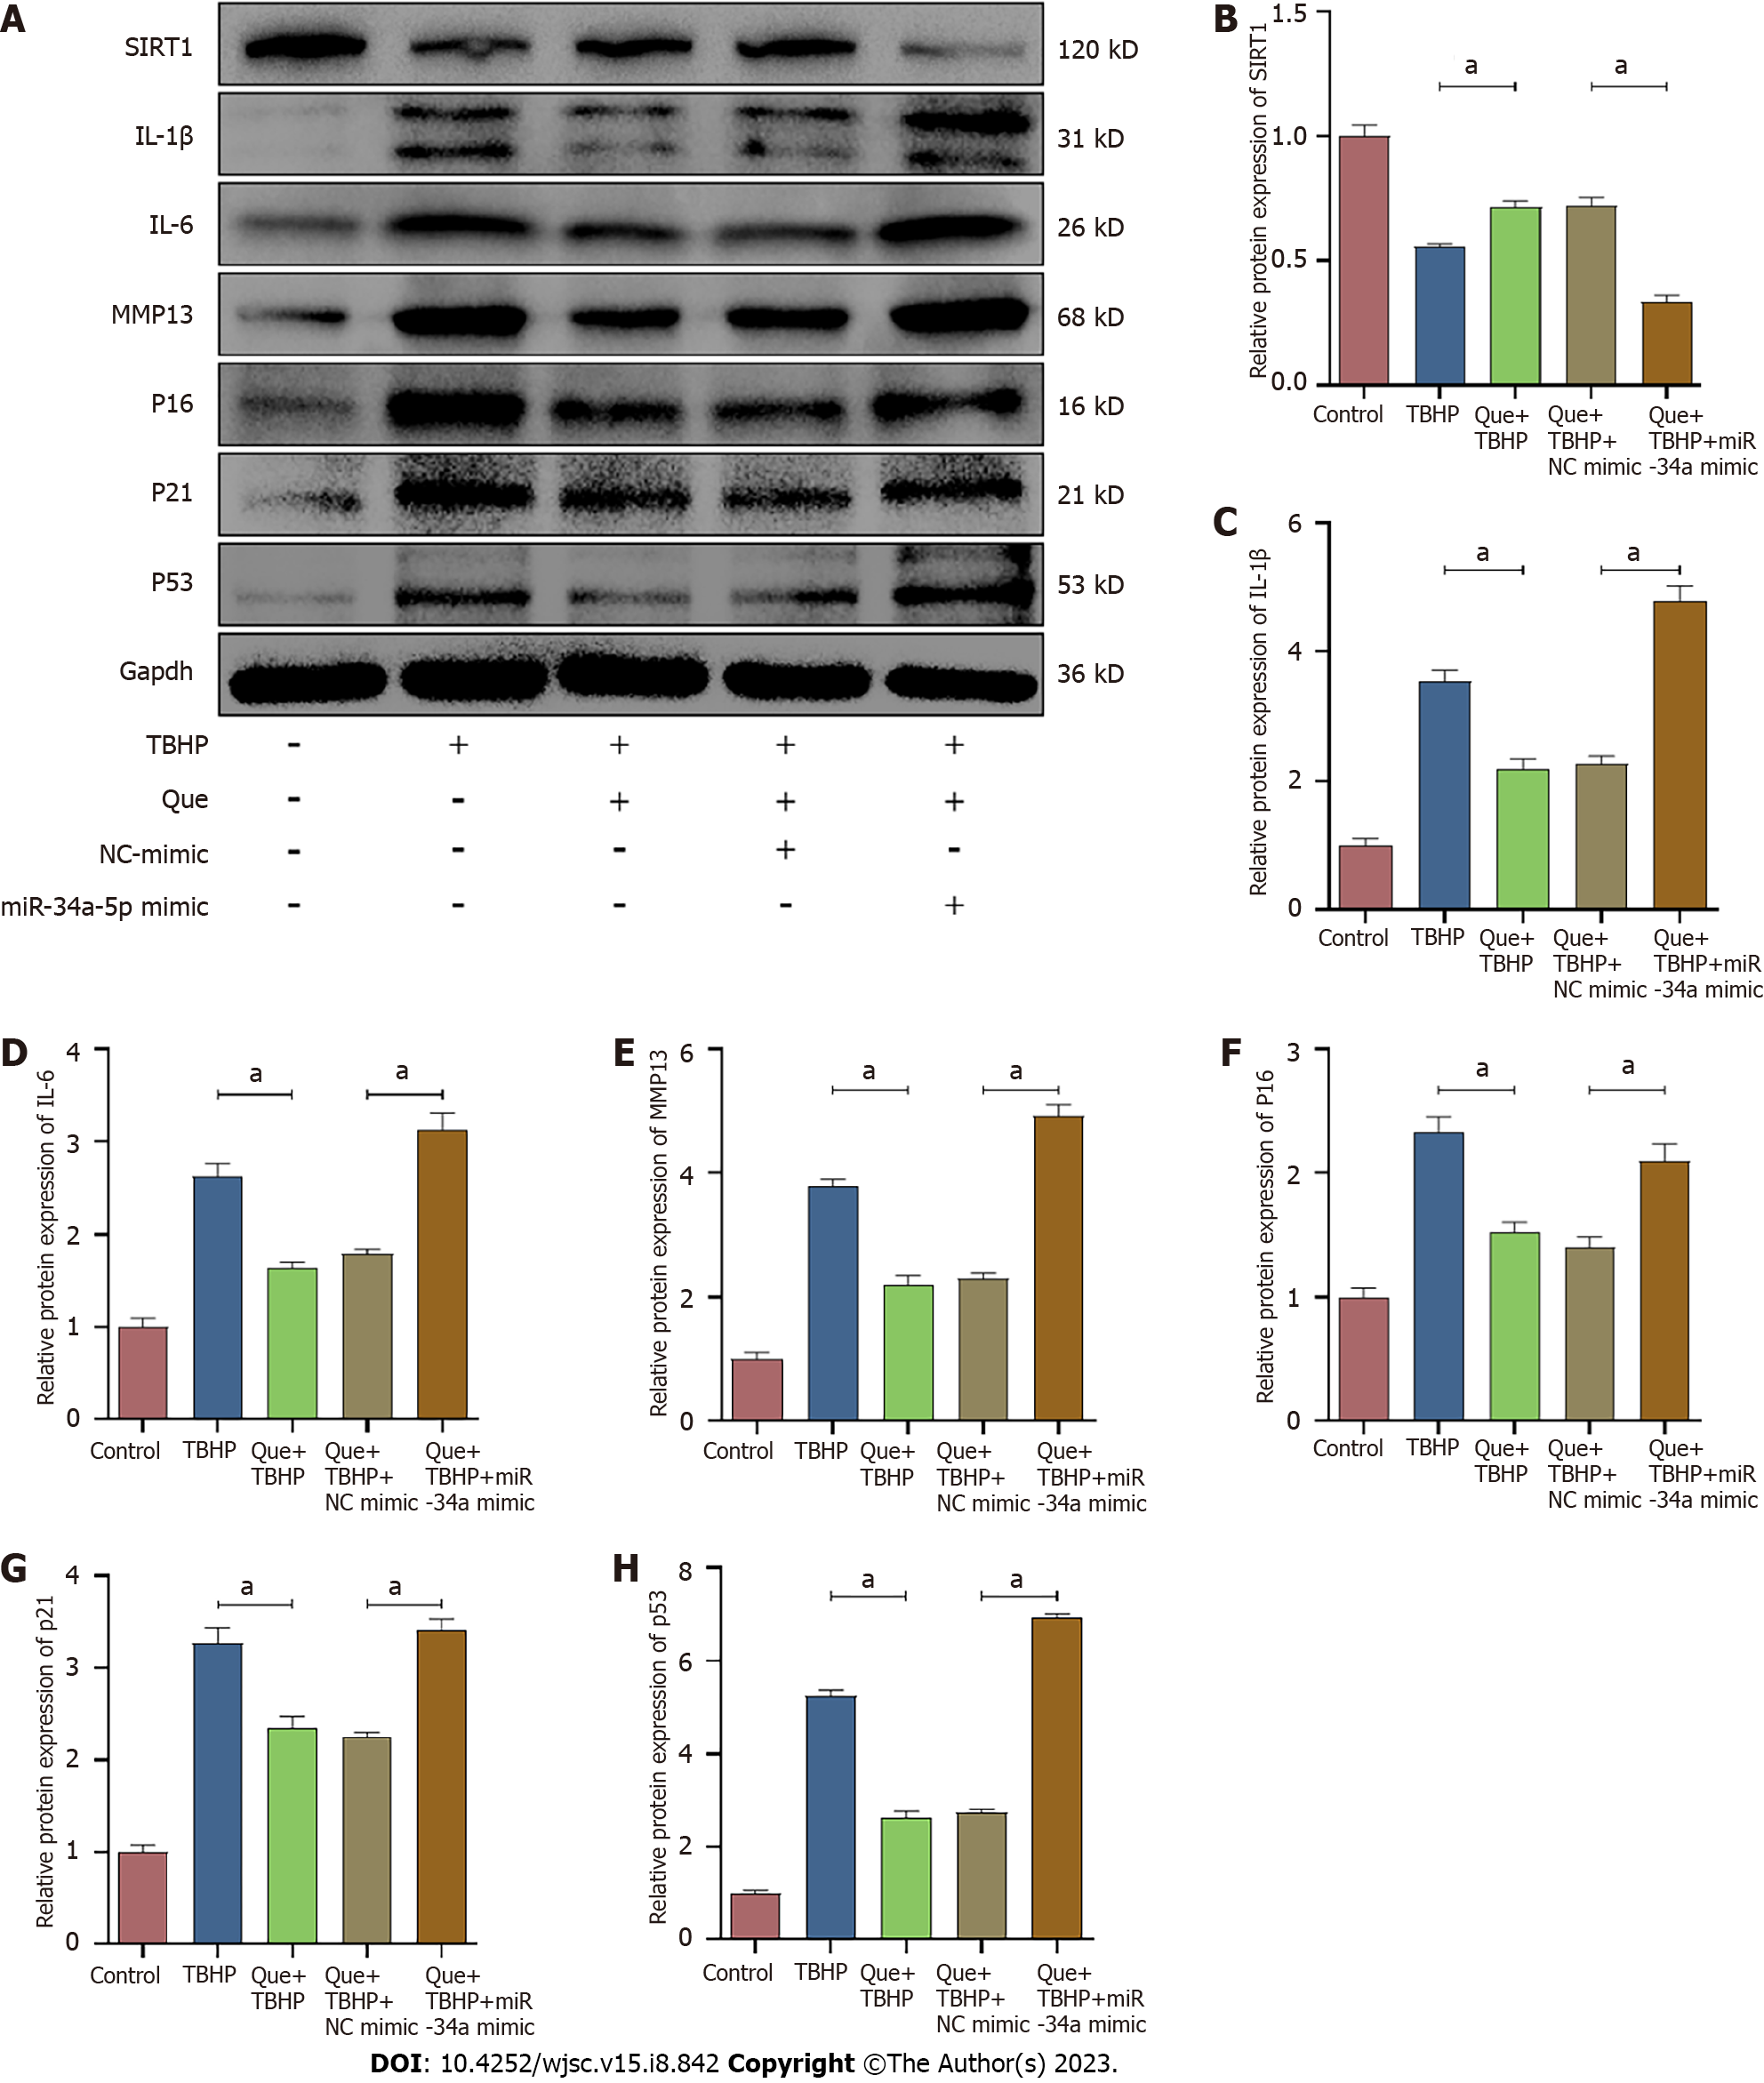
Figure 11 Quercetin alleviates TBHP-induced senescence via miR-34a-5p/SIRT1 axis.
A: The protein levels of SIRT1, p16, p21, p53, IL-1β, IL-6 and MMP-13 in different groups; B-H: Quantitative analysis of protein expression in different groups. Data are represented as mean ± SD. Significant differences between groups are indicated as aP < 0.05, n = 3. TBHP: Tert-butyl hydroperoxide; Que: Quercetin.
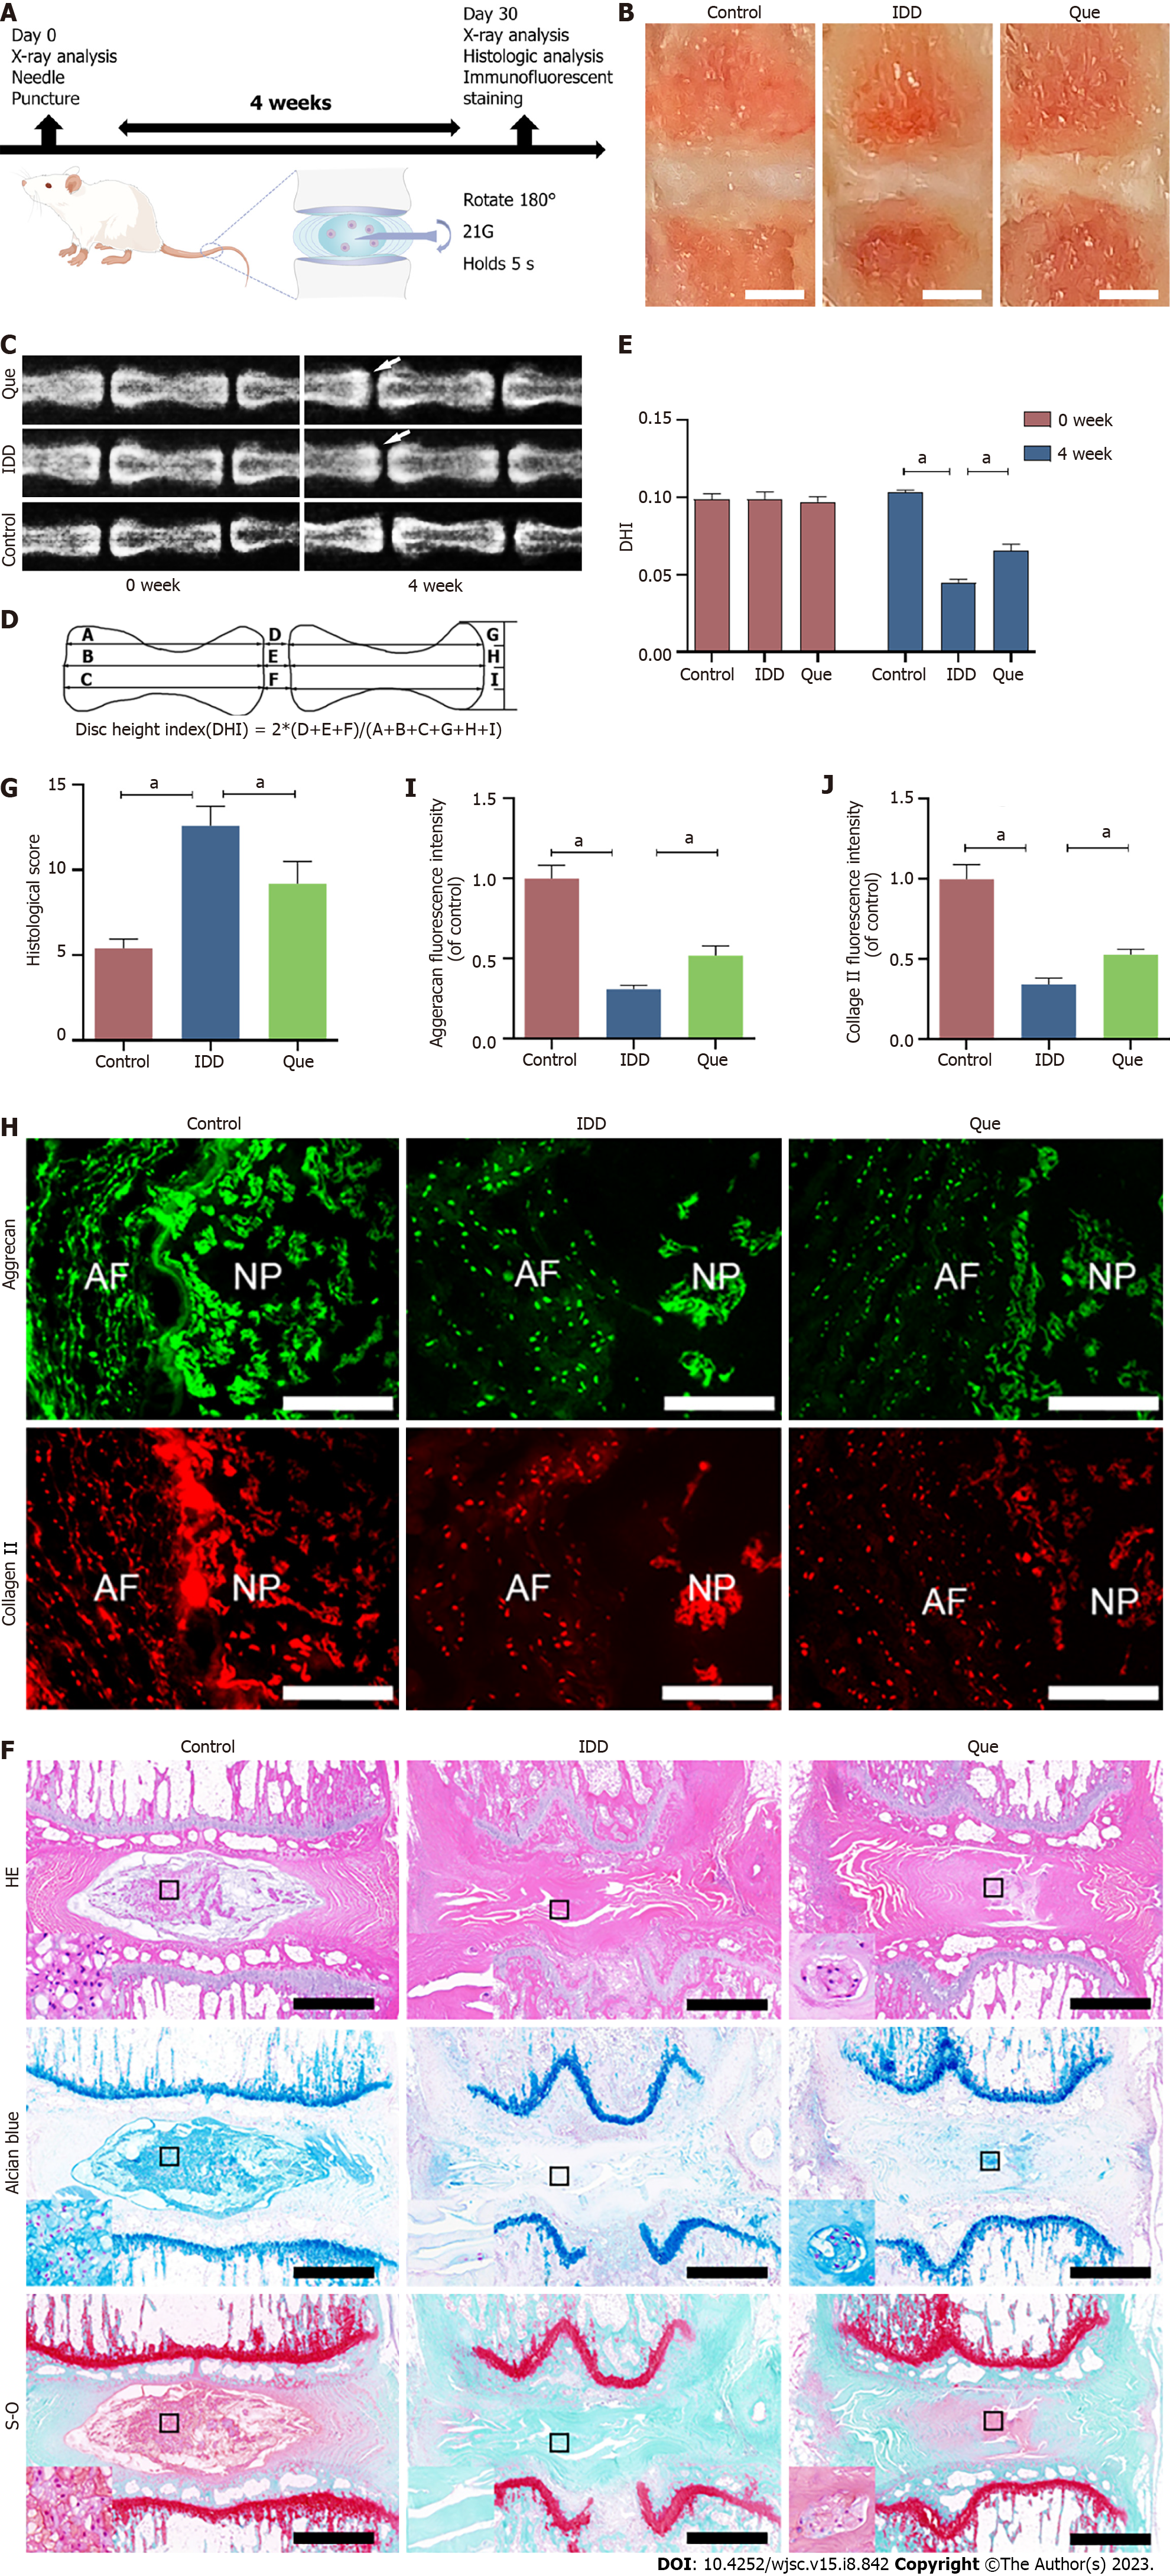
Figure 12 Quercetin ameliorates IVDD invivo.
A: Schematic of the basic process of in vivo experiment (By Figdraw); B: Macroscopic appearances of rat tail intact disc mid-sagittal sections in control group, intervertebral disc degeneration group and quercetin group (Scar bar = 2 mm); C: The X-ray in different groups at 0 wk and 4 wk after puncturing; D: Measurements of intervertebral disc height index (DHI); E: Quantitative analysis of DHI; F-G: Hematoxylin-eosin staining and quantitative analysis of histological score at 4 wk after puncture in different groups (scale bar = 1mm); H: The expression of aggrecan and collagen type II in different groups (scale bar = 400 μm); I-J: Quantitative analysis of aggrecan and collagen type II in different groups. Data are represented as mean ± SD. Significant differences between groups are indicated as aP < 0.05, n = 3. HE: Hematoxylin-eosin; NP: Nucleus pulposus; AF: Annulus fibrosus; IDD: Intervertebral disc degeneration; TBHP: Tert-butyl hydroperoxide; Que: Quercetin.
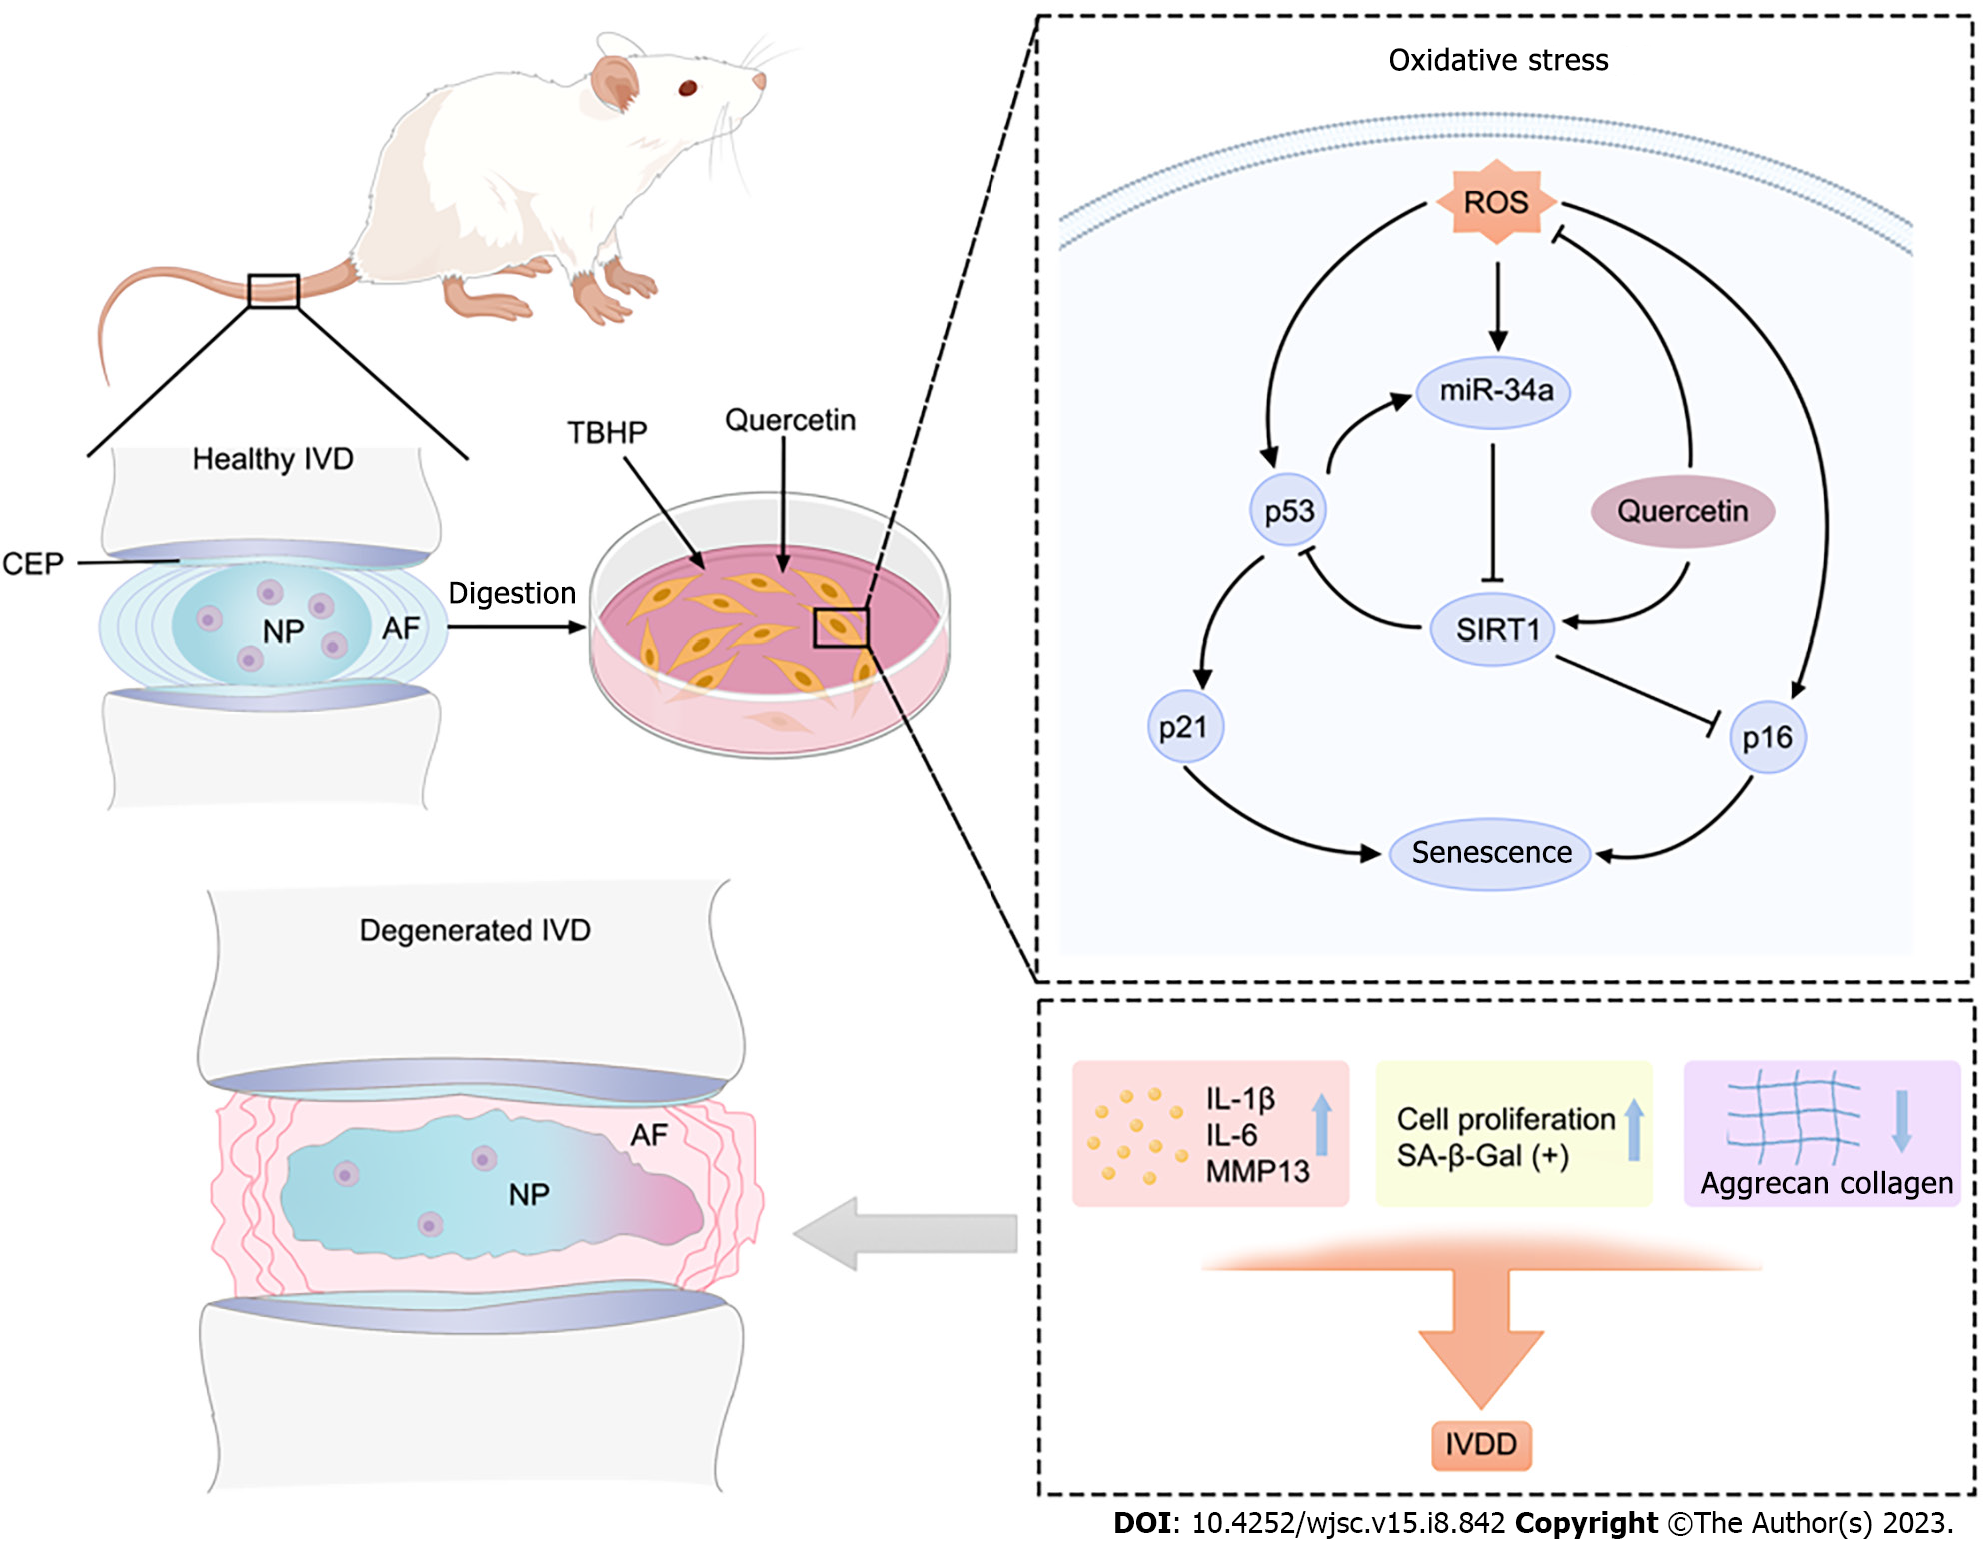
Figure 13 Schematic representation of the mode of action of quercetin.
Quercetin ameliorates oxidative stress-induced senescence in nucleus pulposus-derived mesenchymal stem cells via miR-34a-5p/SIRT1 axis. HE: Hematoxylin-eosin; NP: Nucleus pulposus; AF: Annulus fibrosus; IVD: Intervertebral disc; TBHP: Tert-butyl hydroperoxide; ROS: Reactive oxygen species assay. By Figdraw.
- Citation: Zhao WJ, Liu X, Hu M, Zhang Y, Shi PZ, Wang JW, Lu XH, Cheng XF, Tao YP, Feng XM, Wang YX, Zhang L. Quercetin ameliorates oxidative stress-induced senescence in rat nucleus pulposus-derived mesenchymal stem cells via the miR-34a-5p/SIRT1 axis. World J Stem Cells 2023; 15(8): 842-865
- URL: https://www.wjgnet.com/1948-0210/full/v15/i8/842.htm
- DOI: https://dx.doi.org/10.4252/wjsc.v15.i8.842


