Copyright
©The Author(s) 2023.
World J Stem Cells. Aug 26, 2023; 15(8): 821-841
Published online Aug 26, 2023. doi: 10.4252/wjsc.v15.i8.821
Published online Aug 26, 2023. doi: 10.4252/wjsc.v15.i8.821
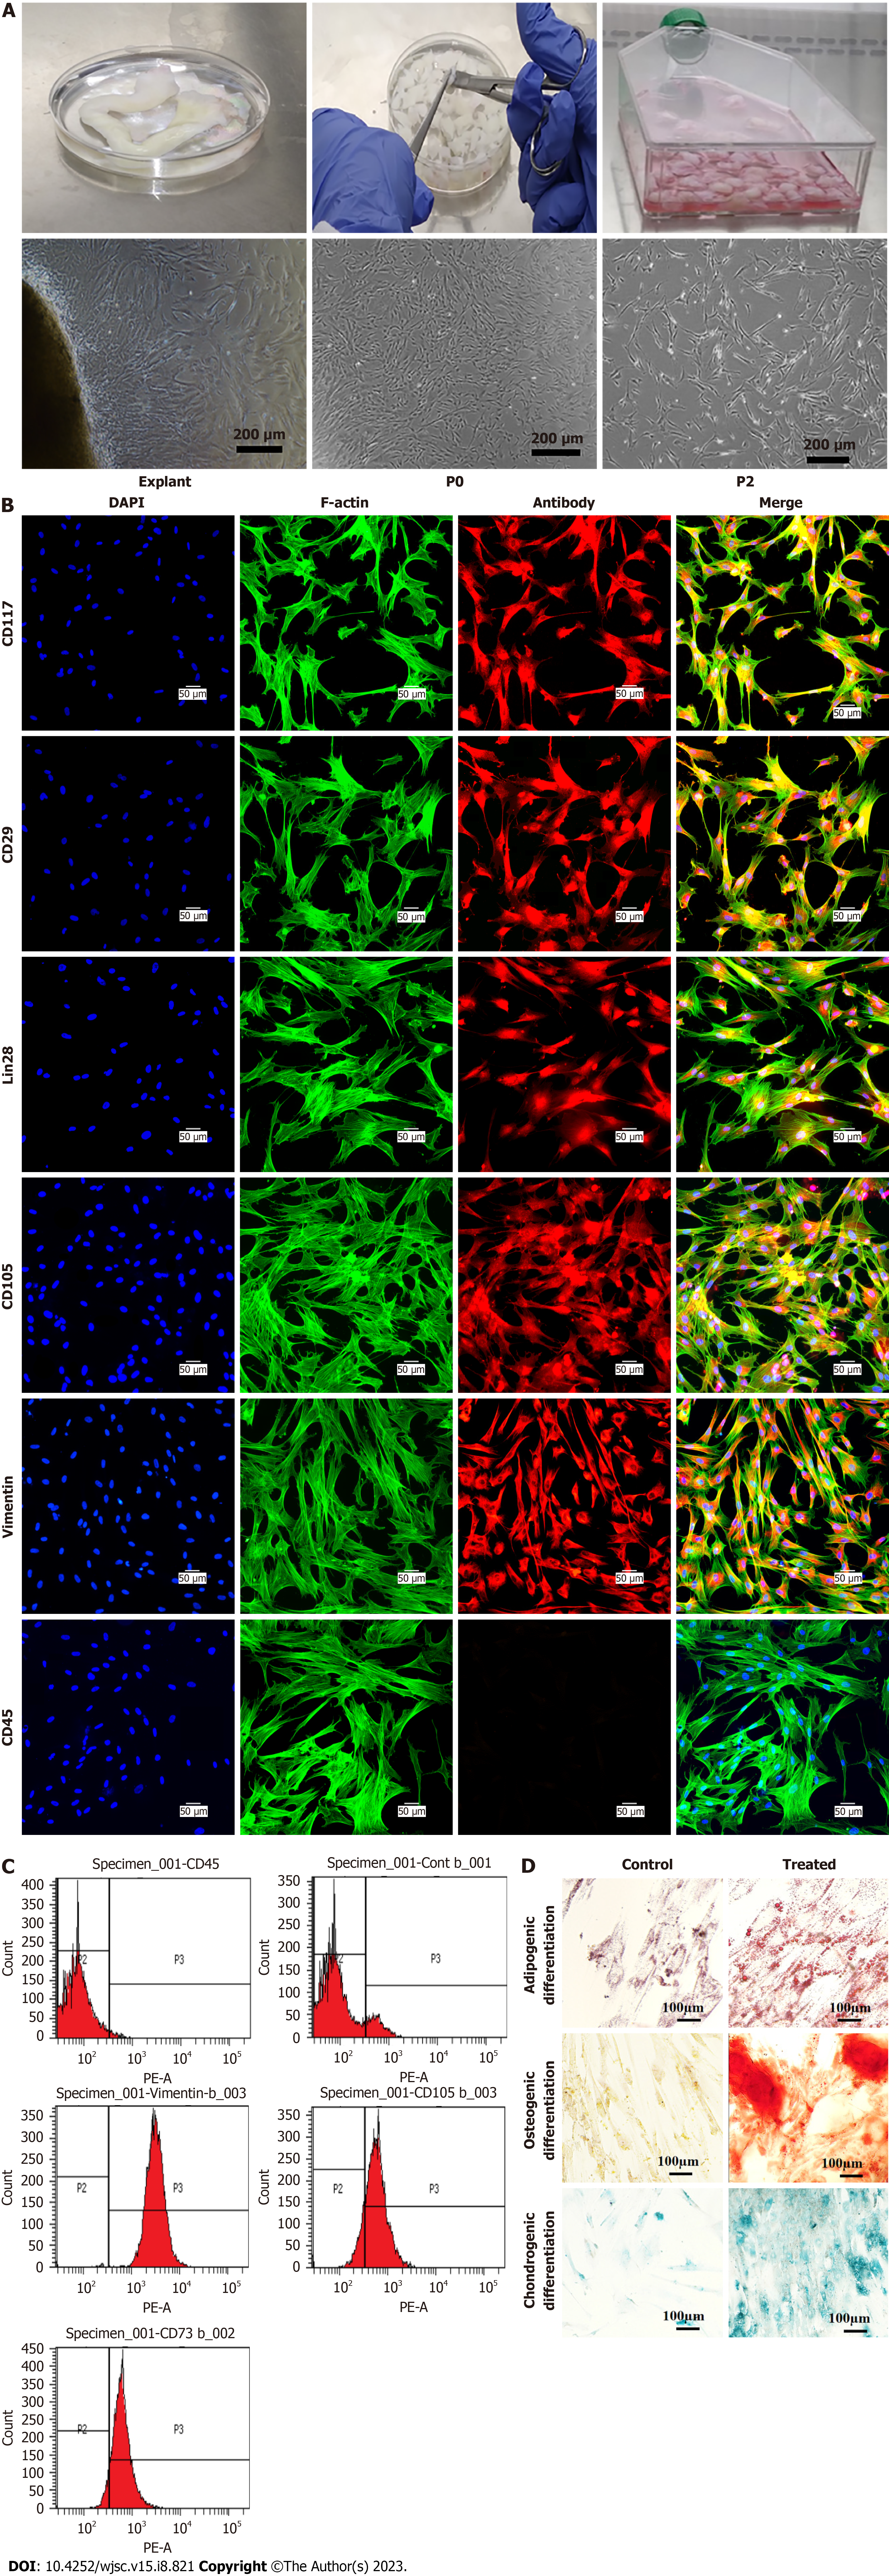
Figure 1 Isolation, propagation, and characterization of human umbilical cord-derived mesenchymal stem cells.
A: Explant processing and isolation of human umbilical cord-derived mesenchymal stem cells (MSCs). Phase contrast images showing homogenous fibroblast like morphology and growth; B: Characterization of MSCs by immunocytochemistry representing the positive expression of CD117, CD29, Lin28, CD105, Vimentin, and negative expression of CD45; C: Immunophenotyping of MSCs by flow cytometry showing positive expression of CD105, Vimentin, and CD73, and negative expression of CD45; D: Tri-lineages differentiation of MSCs into osteogenic, adipogenic, and chondrogenic lineages.
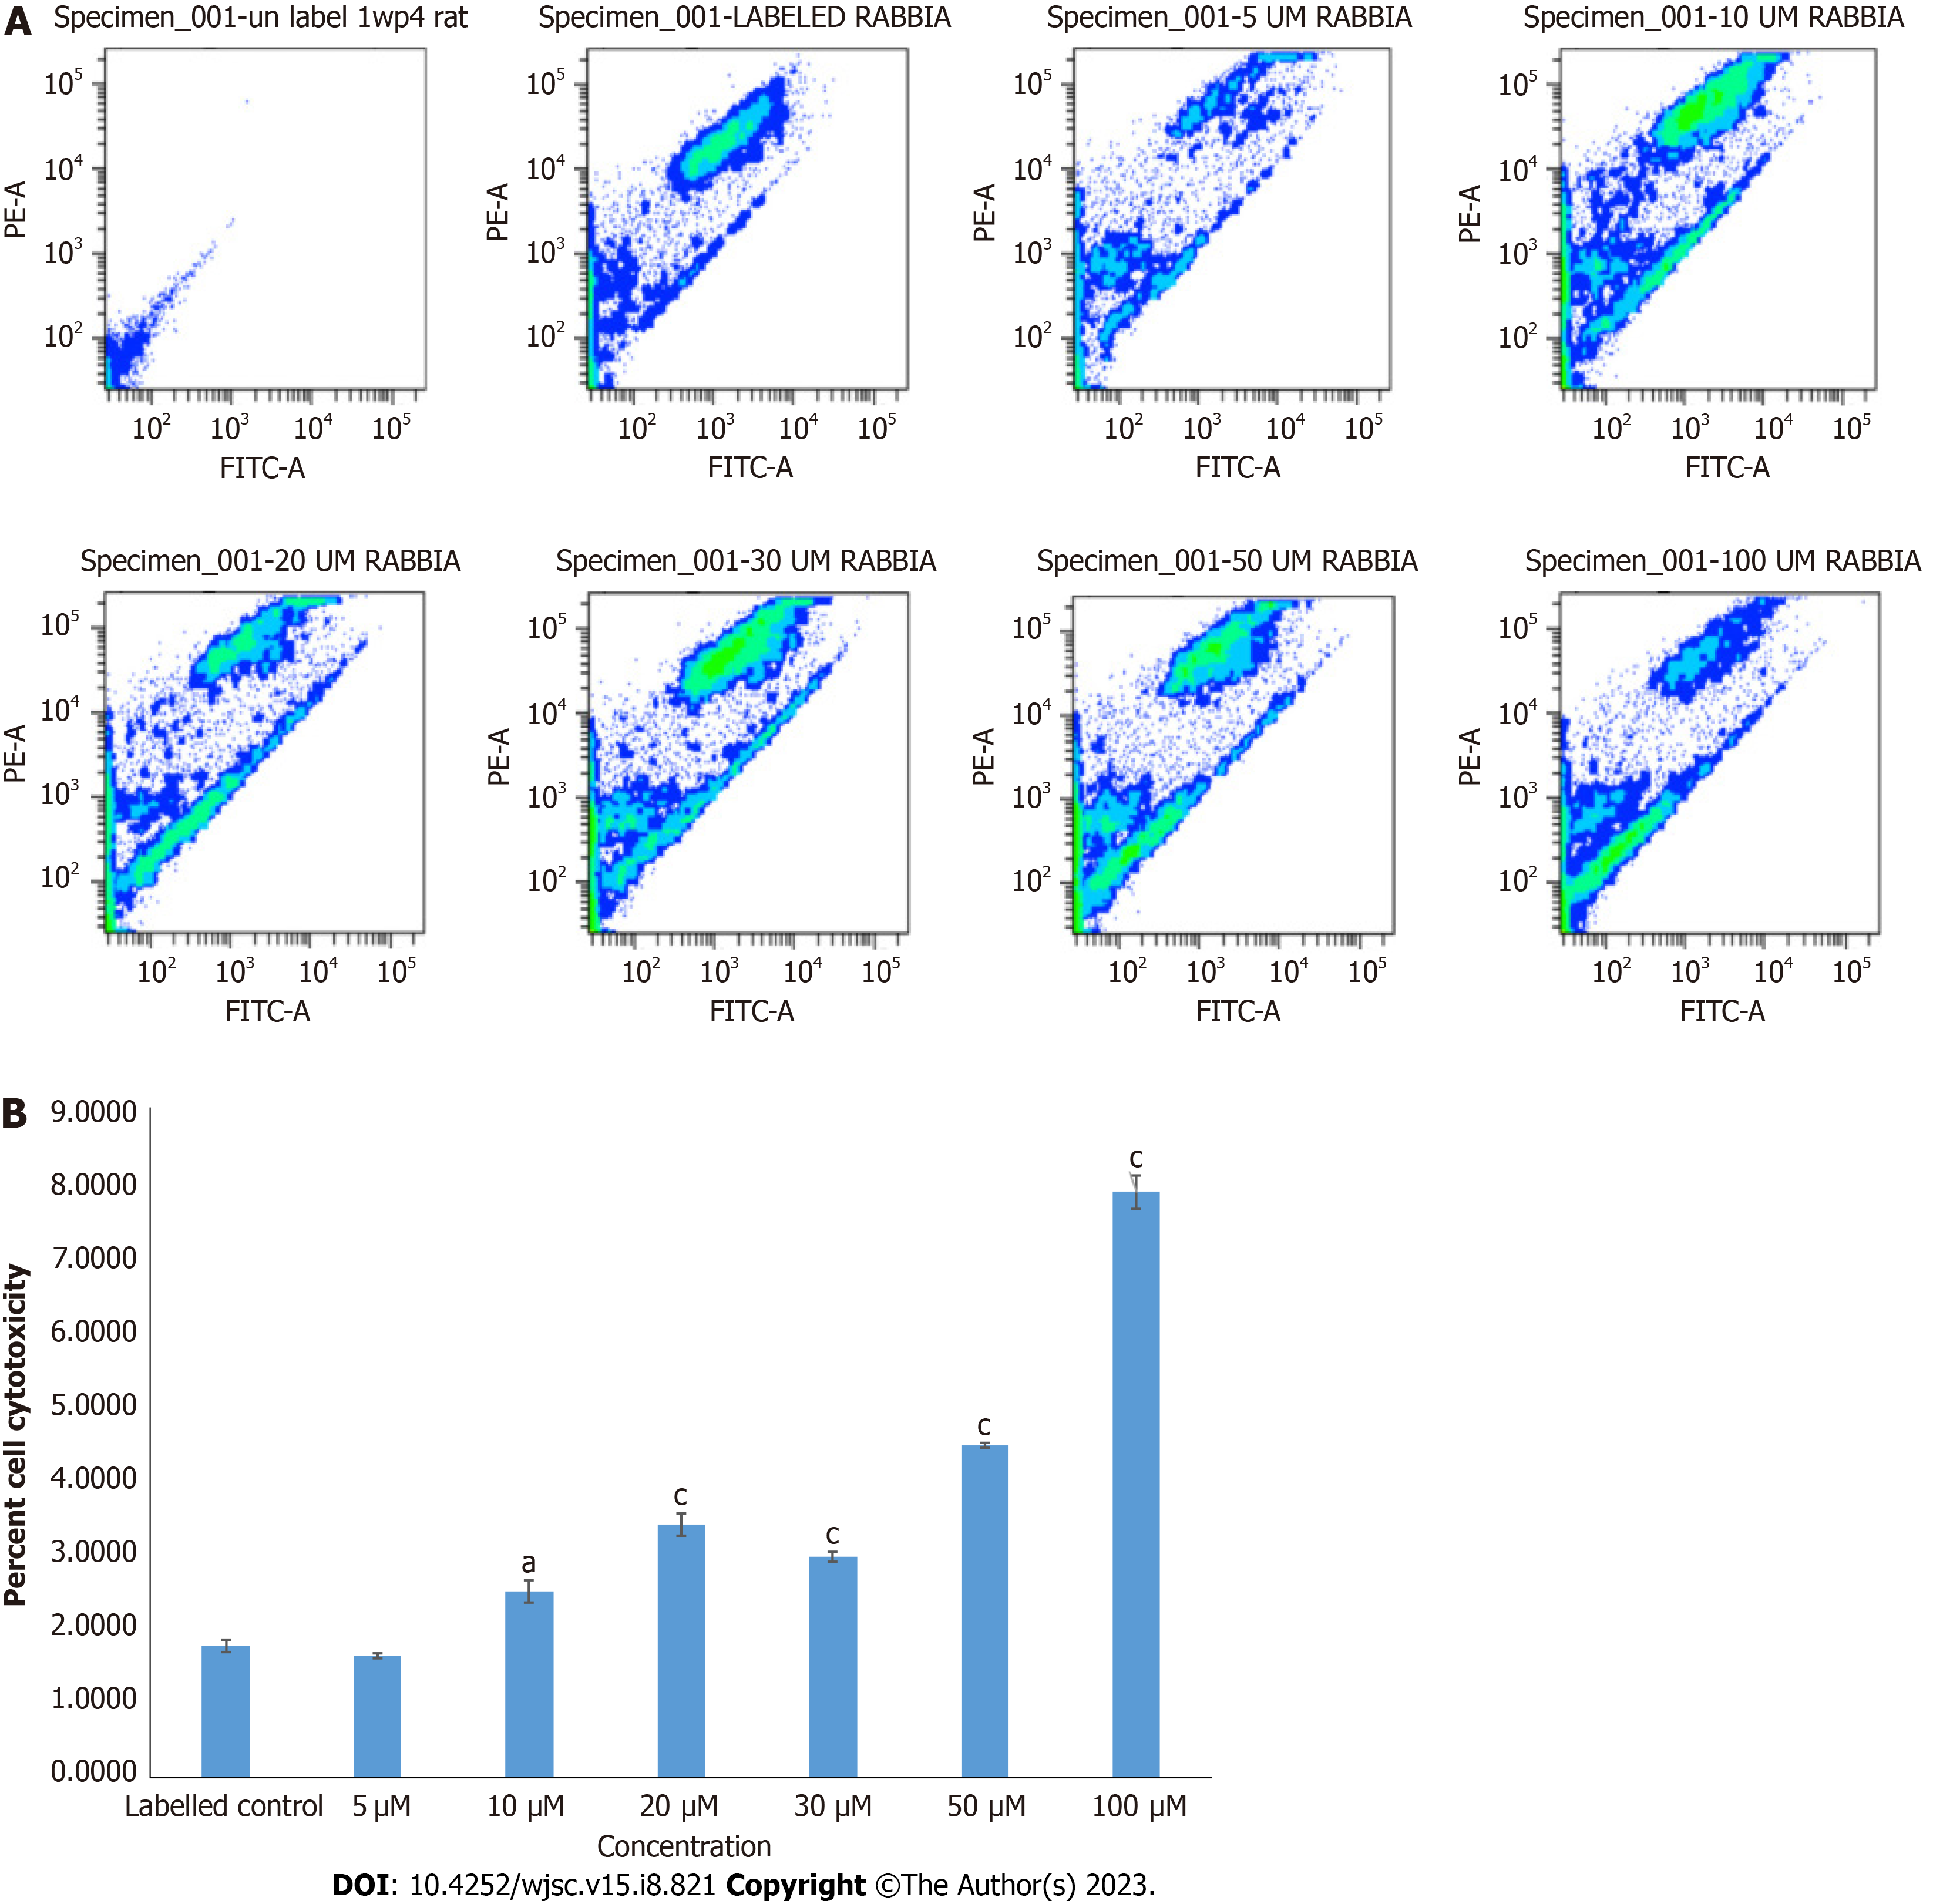
Figure 2 Cytotoxicity analysis of mesenchymal stem cells treated with different concentrations of inhibitor Wnt production-4 by JC-1 assay.
A: Mesenchymal stem cells (MSCs) treated with 5 μM concentration of inhibitor Wnt production-4 showed non-significant number of apoptotic cells, while 10 μM concentration or above showed significant cytotoxic effect on MSCs; B: Quantification of apoptotic and non-apoptotic cells presented in bar graphs. For statistical analysis, One-way ANOVA was used followed by the Bonferroni post-hoc test. Values are expressed as means ± SEM; level of significance is P < 0.05 (aP < 0.05, cP < 0.001).
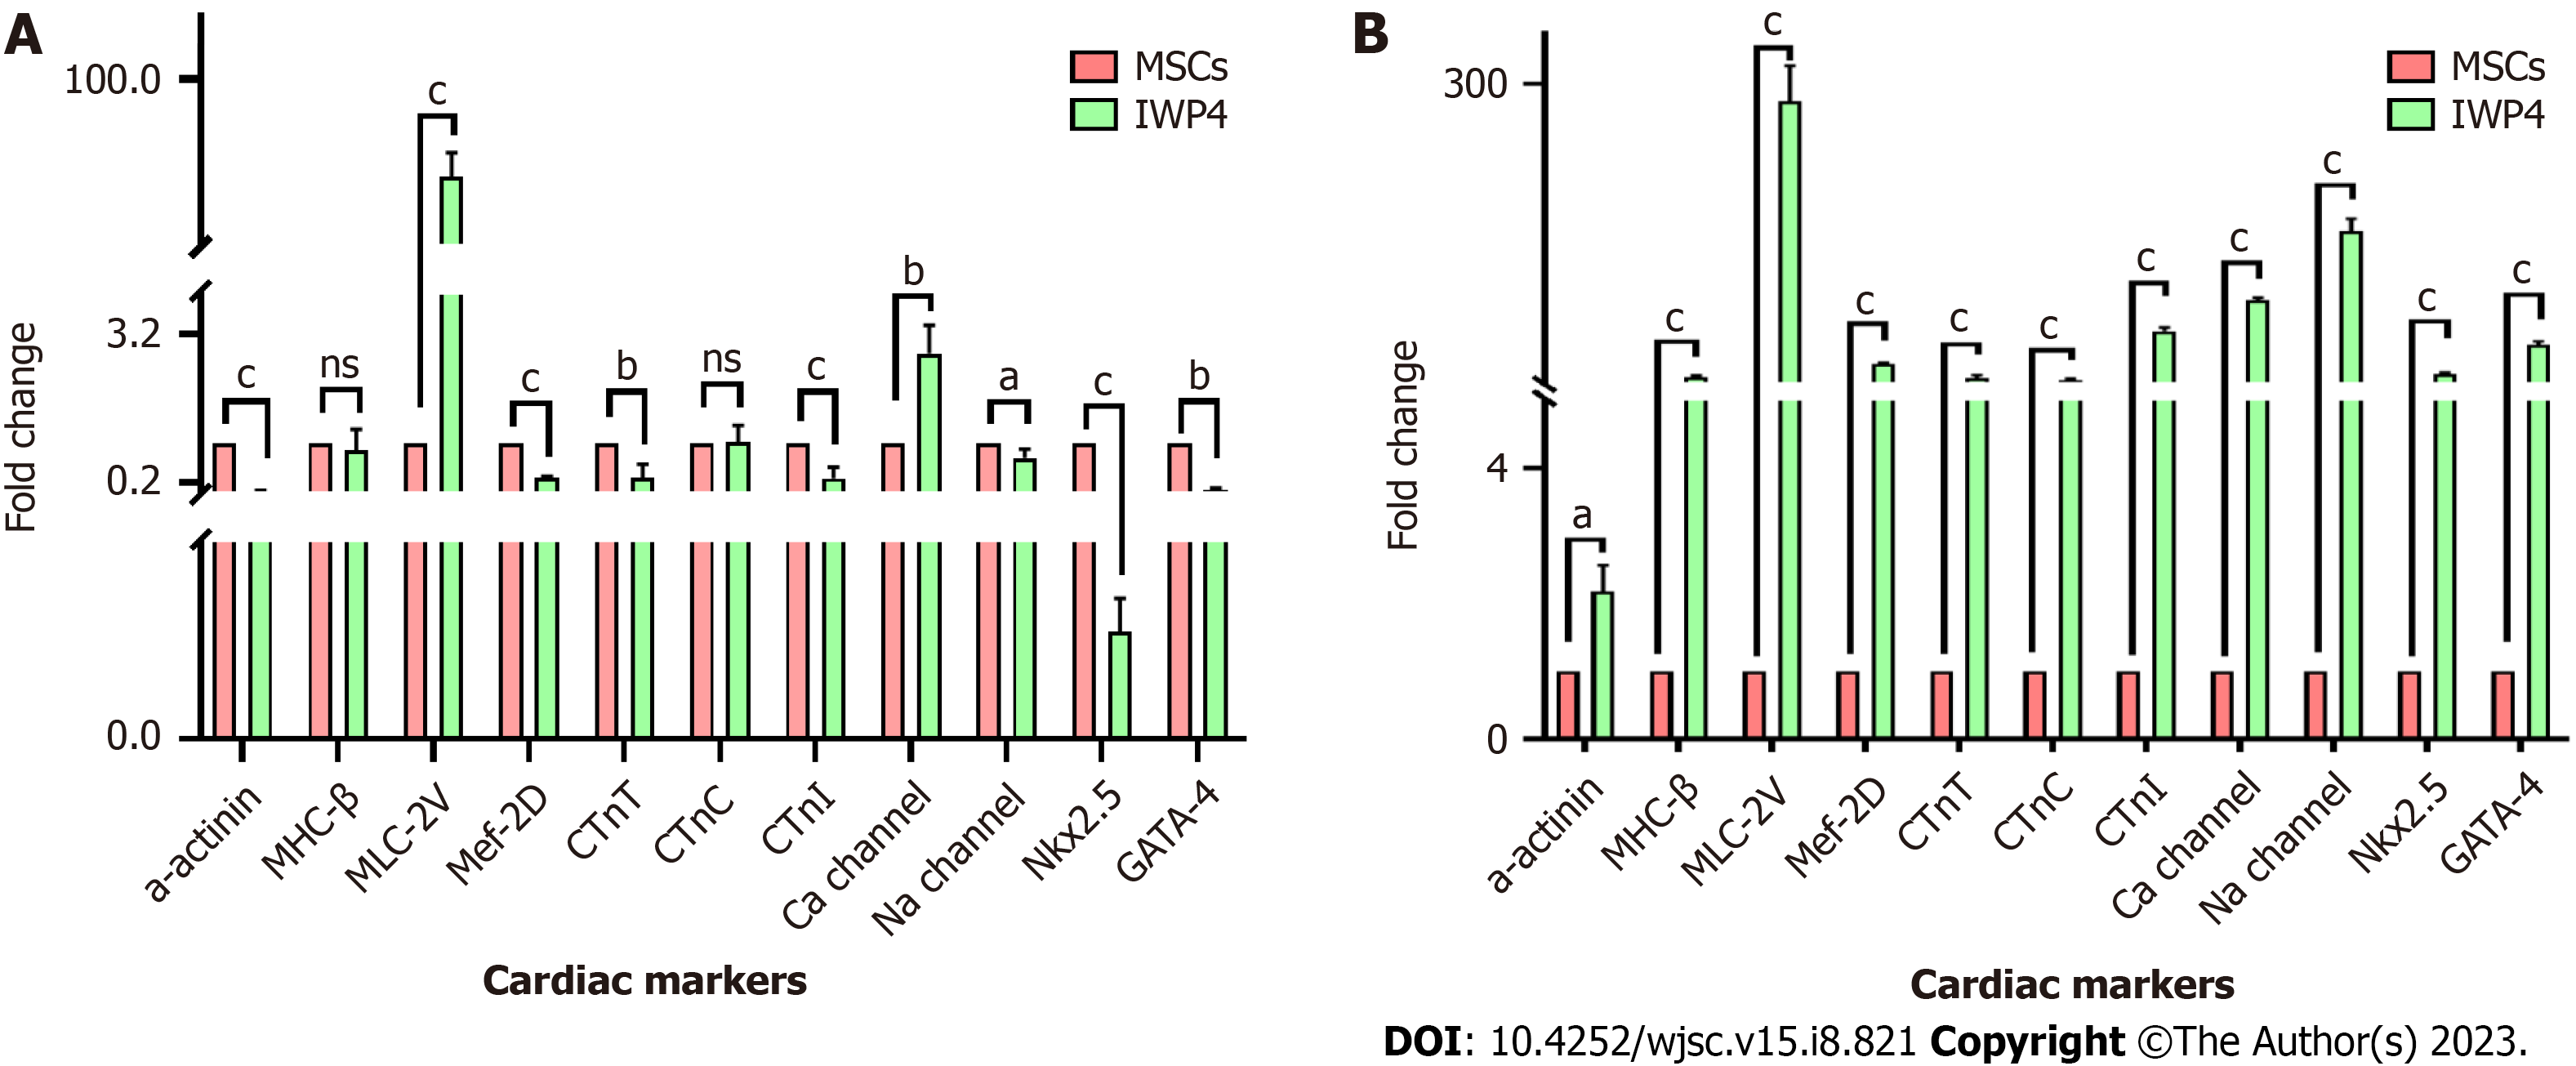
Figure 3 Cardiac markers gene expression analysis by quantitative real-time polymerase chain reaction.
A: Seven days treatment of mesenchymal stem cells (MSCs) with inhibitor Wnt production-4 (IWP-4); B: Fourteen days treatment of MSCs with IWP-4 in comparison with untreated control showing significant increase in the expression of early cardiac markers, GATA-4, Nkx2.5, and late cardiac markers, MHC-β, MLC-2v, Mef-2D, cTnT, cTnC, cTnI, α-actinin, Ca-channel and Na-channel. Quantitative two fold (2-ΔΔCT) difference of mean is represented by ΔΔCt method. Statistical analysis was performed using an Independent sample t-test. Values are presented as mean ± SEM from three independent biological triplicates; level of significance is P < 0.05 (aP < 0.05, bP < 0.01, and cP < 0.001). IWP-4: Inhibitor Wnt production-4; MSC: Mesenchymal stem cell; NS: No significant.
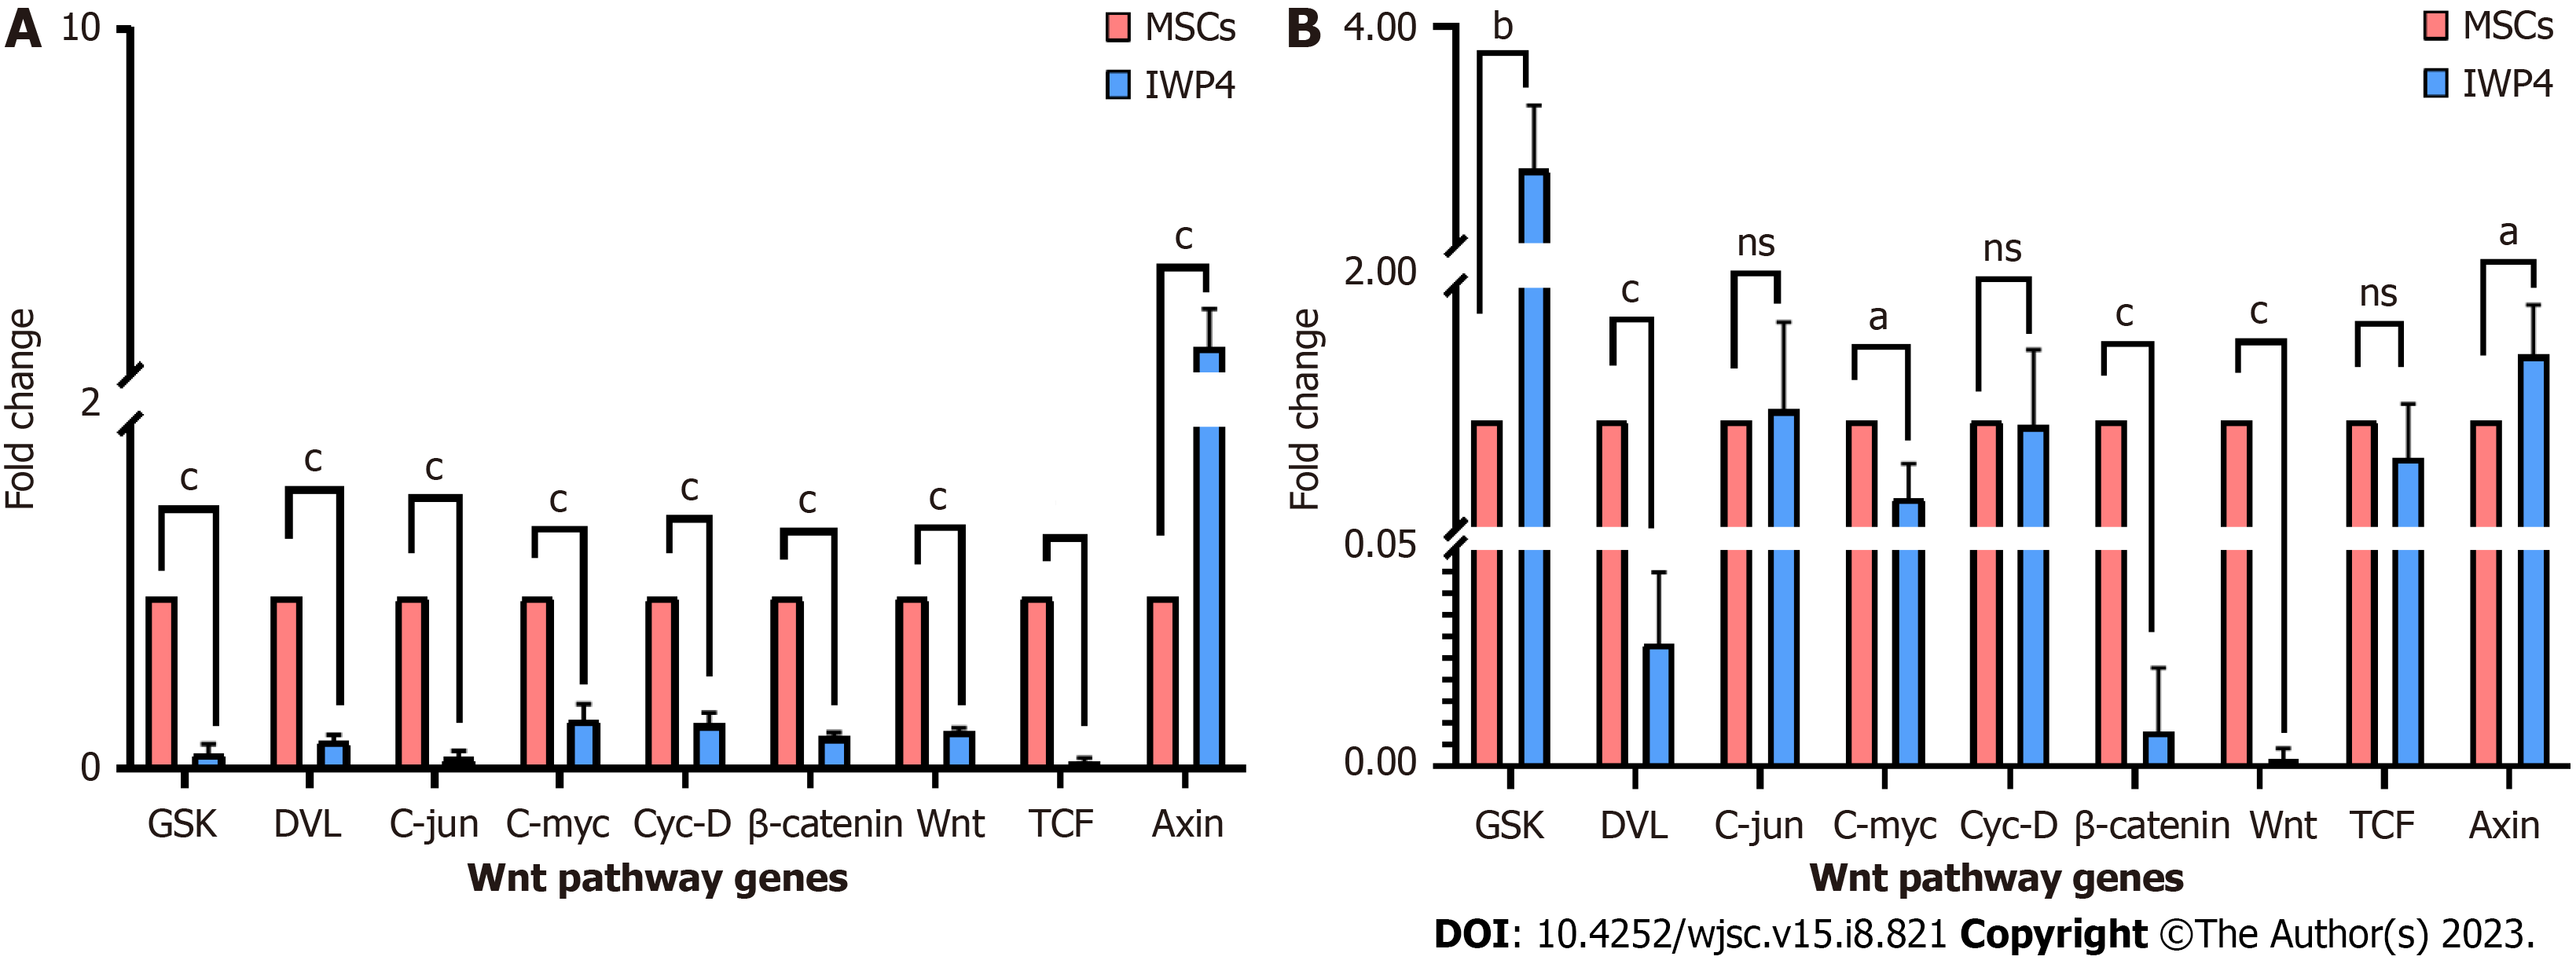
Figure 4 Wnt pathway gene expression analysis: Wnt pathway gene expression analysis by quantitative real-time polymerase chain reaction.
Seven days, and fourteen days treatment of mesenchymal stem cells with inhibitor Wnt production-4, in comparison with untreated control showing significant decrease in the expression of Wnt pathway genes, DVL, Wnt, TCF, Axin, and β-catenin, and downstream transcription factors C-jun, C-myc, and Cyc-D. A: Seven days; B: Fourteen days. GSK increased in the fourteen days treatment. Quantitative two fold (2-ΔΔCT) difference of mean is represented by ΔΔCt method. Statistical analysis was performed using an Independent sample t-test. Values are presented as mean ± SEM from three independent biological triplicates; level of significance is P < 0.05 (aP < 0.05, bP < 0.01, and cP < 0.001). IWP-4: Inhibitor Wnt production-4; MSC: Mesenchymal stem cell; NS: No significant.
Figure 5 Analysis of fourteen days inhibitor Wnt production-4 treated mesenchymal stem cells.
A: Morphology of untreated mesenchymal stem cells (MSCs), seven days inhibitor Wnt production-4 (IWP-4) treated MSCs and fourteen days IWP-4 treated MSCs; B: Immunocytochemical analysis of untreated MSCs, seven days and fourteen days IWP-4 treated MSCs showing positive expression of cardiac-specific proteins α-actinin, connexin-43, cTnI, Desmin, GATA-4, Nkx2.5, secondary control, and DAPI control. Alexa fluor 488 secondary antibody was used for detection, then counterstained with DAPI to stain the nuclei; C: Quantification of fluorescence intensities in untreated MSCs, seven days, and fourteen days IWP-4 treated MSCs. For statistical analysis, One-way ANOVA was used followed by the Bonferroni post-hoc test. Data are presented as mean ± SEM with significance level P < 0.05 (where aP < 0.05, cP < 0.001). IWP-4: Inhibitor Wnt production-4; MSC: Mesenchymal stem cell; NS: No significant.
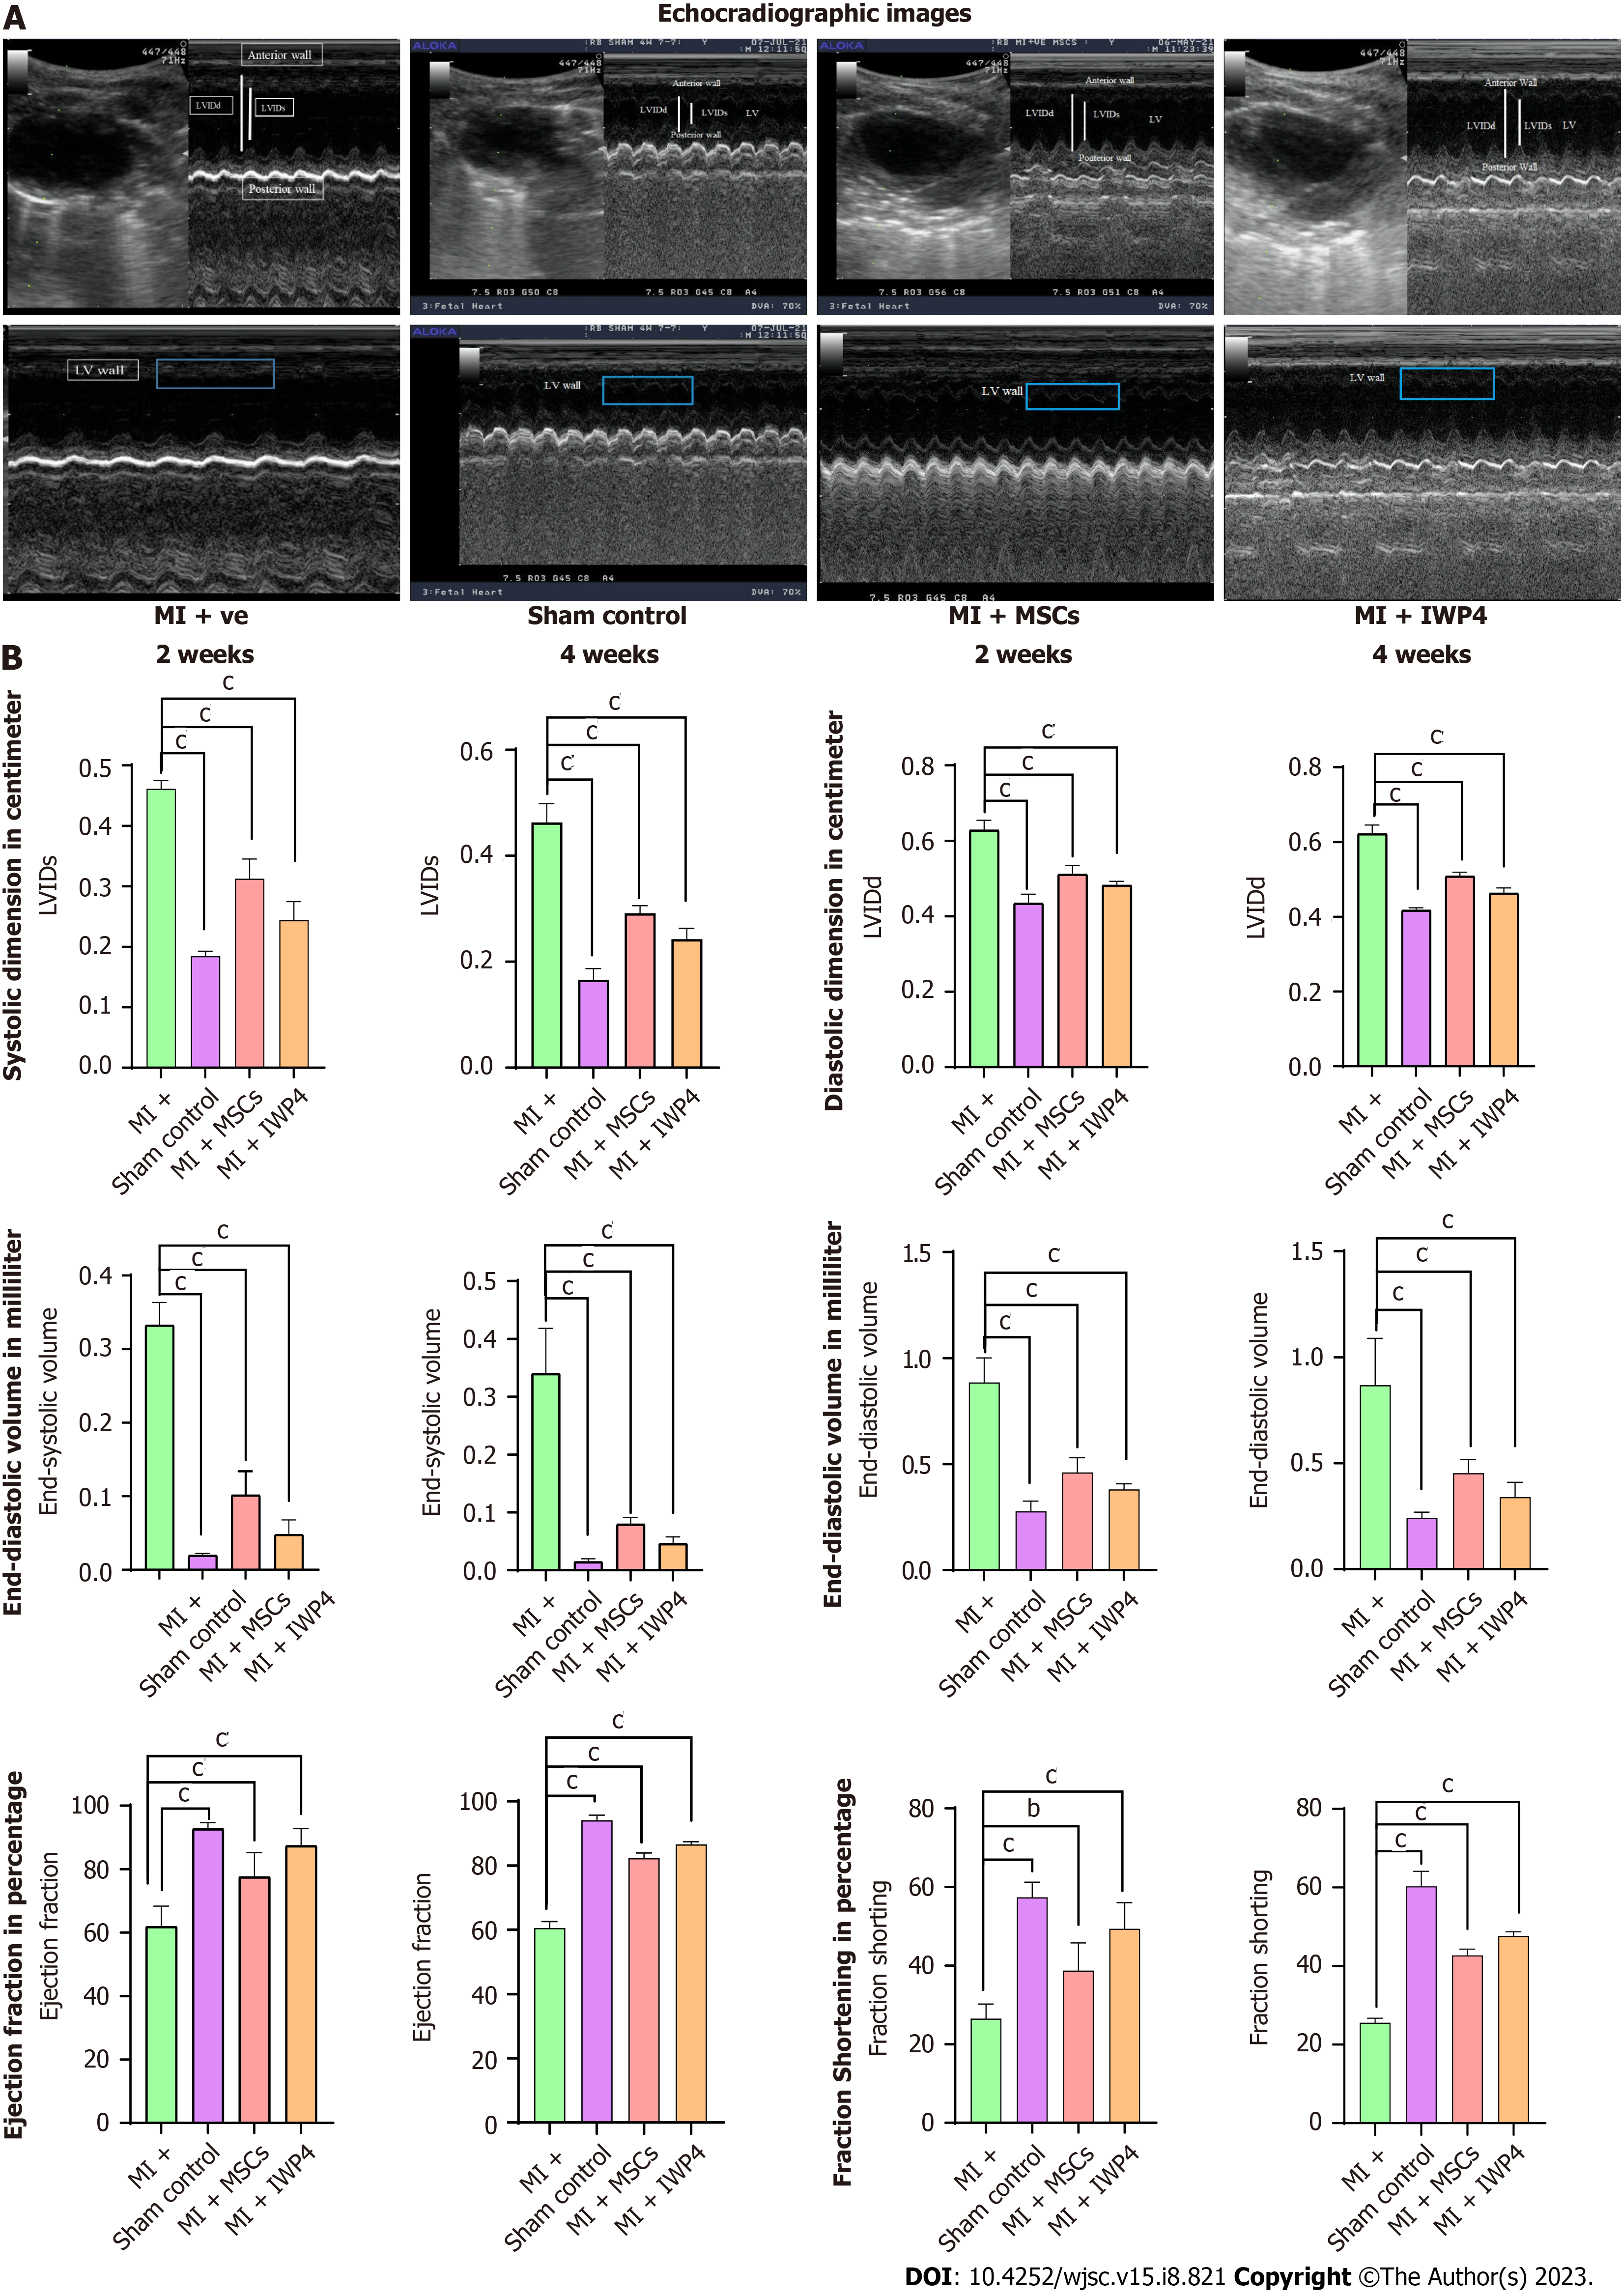
Figure 6 Cardiac functional analysis by echocardiography.
A: Ultrasound images taken at parasternal long axis showing B and M mode scans of left ventricle in sham control, myocardial infarction (MI+) group, mesenchymal stem cells (MI+MSC) treated group, and inhibitor Wnt production-4 (IWP-4) (MI+IWP-4) treated groups; B: Bar graphs representing cardiac functional analysis in terms of left ventricular systolic internal dimensions, left ventricular diastolic internal dimensions, end-systolic volume and end-diastolic volume, ejection fraction and fractional shortening, after 2 and 4 wk of MI model development. Both untreated and IWP-4 treated MSC groups showed cardiac functional improvement. However, IWP-4 treated group exhibited more significant results. Statistical analysis was performed using One-way ANOVA followed by Bonferroni post-hoc test. Data are presented as mean ± SEM with significance level P < 0.05 (where bP < 0.01; cP < 0.001). IWP-4: Inhibitor Wnt production-4; MSC: Mesenchymal stem cell; MI: Myocardial infarction; LVIDs: Left ventricular systolic internal dimensions; LVIDd: Left ventricular diastolic internal dimensions.
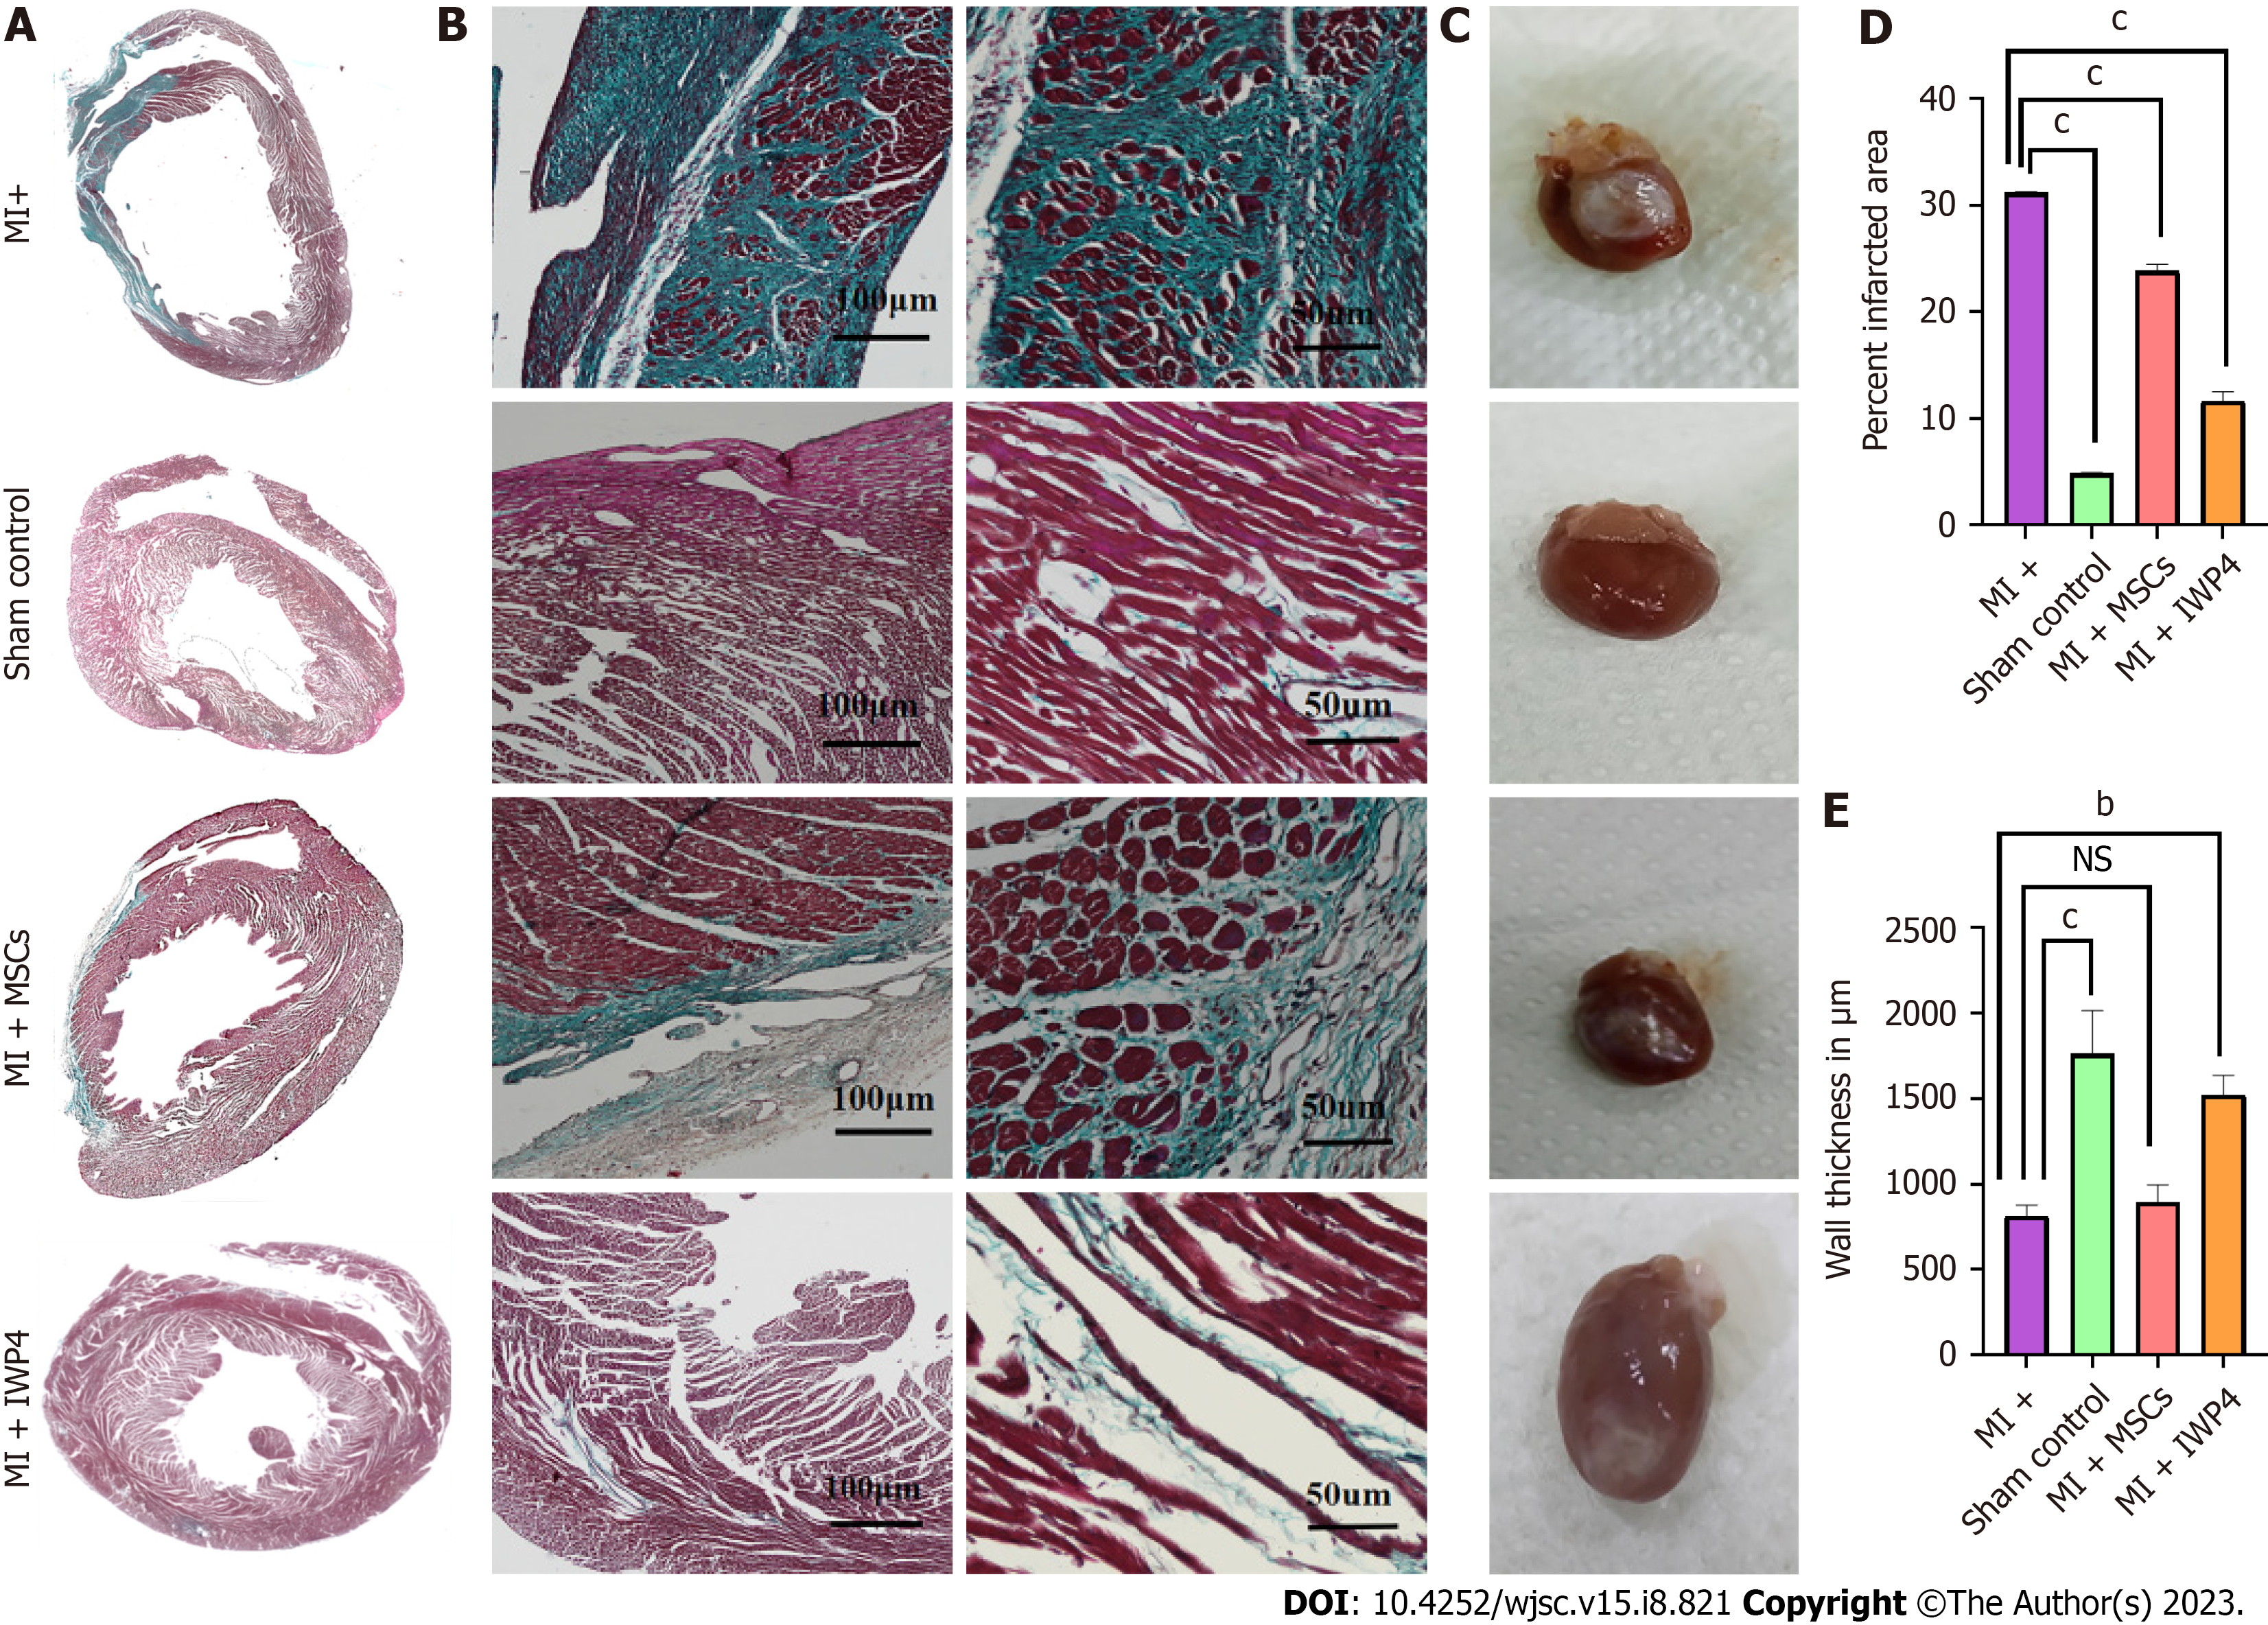
Figure 7 Histological analysis of heart sections.
A: Large scan images showing Masson’s trichrome stained transverse section of the whole heart; B: Magnified images showing Masson’s trichrome stained sections in sham control, myocardial infarction (MI+), mesenchymal stem cells (MSCs) (MI+MSCs), and inhibitor Wnt production-4 (IWP-4) treated MSCs (MI+IWP-4) groups after 4 wk of MI; C: Images showing isolated rat hearts of sham control, MI+ group, MI+MSC group, and MI+IWP-4 groups; D: Bar graph showing percent infarcted area as compared to MI+ group. Percent infarcted area was significantly decreased in MI+MSC and MI+IWP-4 groups after 4 wk of MI; E: Bar graph showing left ventricular wall thickness as compared to MI+ group; left ventricular wall thickness was non-significant in MI+MSC group and significantly increased in the MI+IWP-4 group after 4 wk of MI. For statistical analysis, One-way ANOVA was used followed by the Bonferroni post-hoc test. Data is presented as mean ± SEM with significance level P < 0.05 where (bP < 0.01, cP < 0.001). IWP-4: Inhibitor Wnt production-4; MSC: Mesenchymal stem cell; MI: Myocardial infarction; NS: No significant.
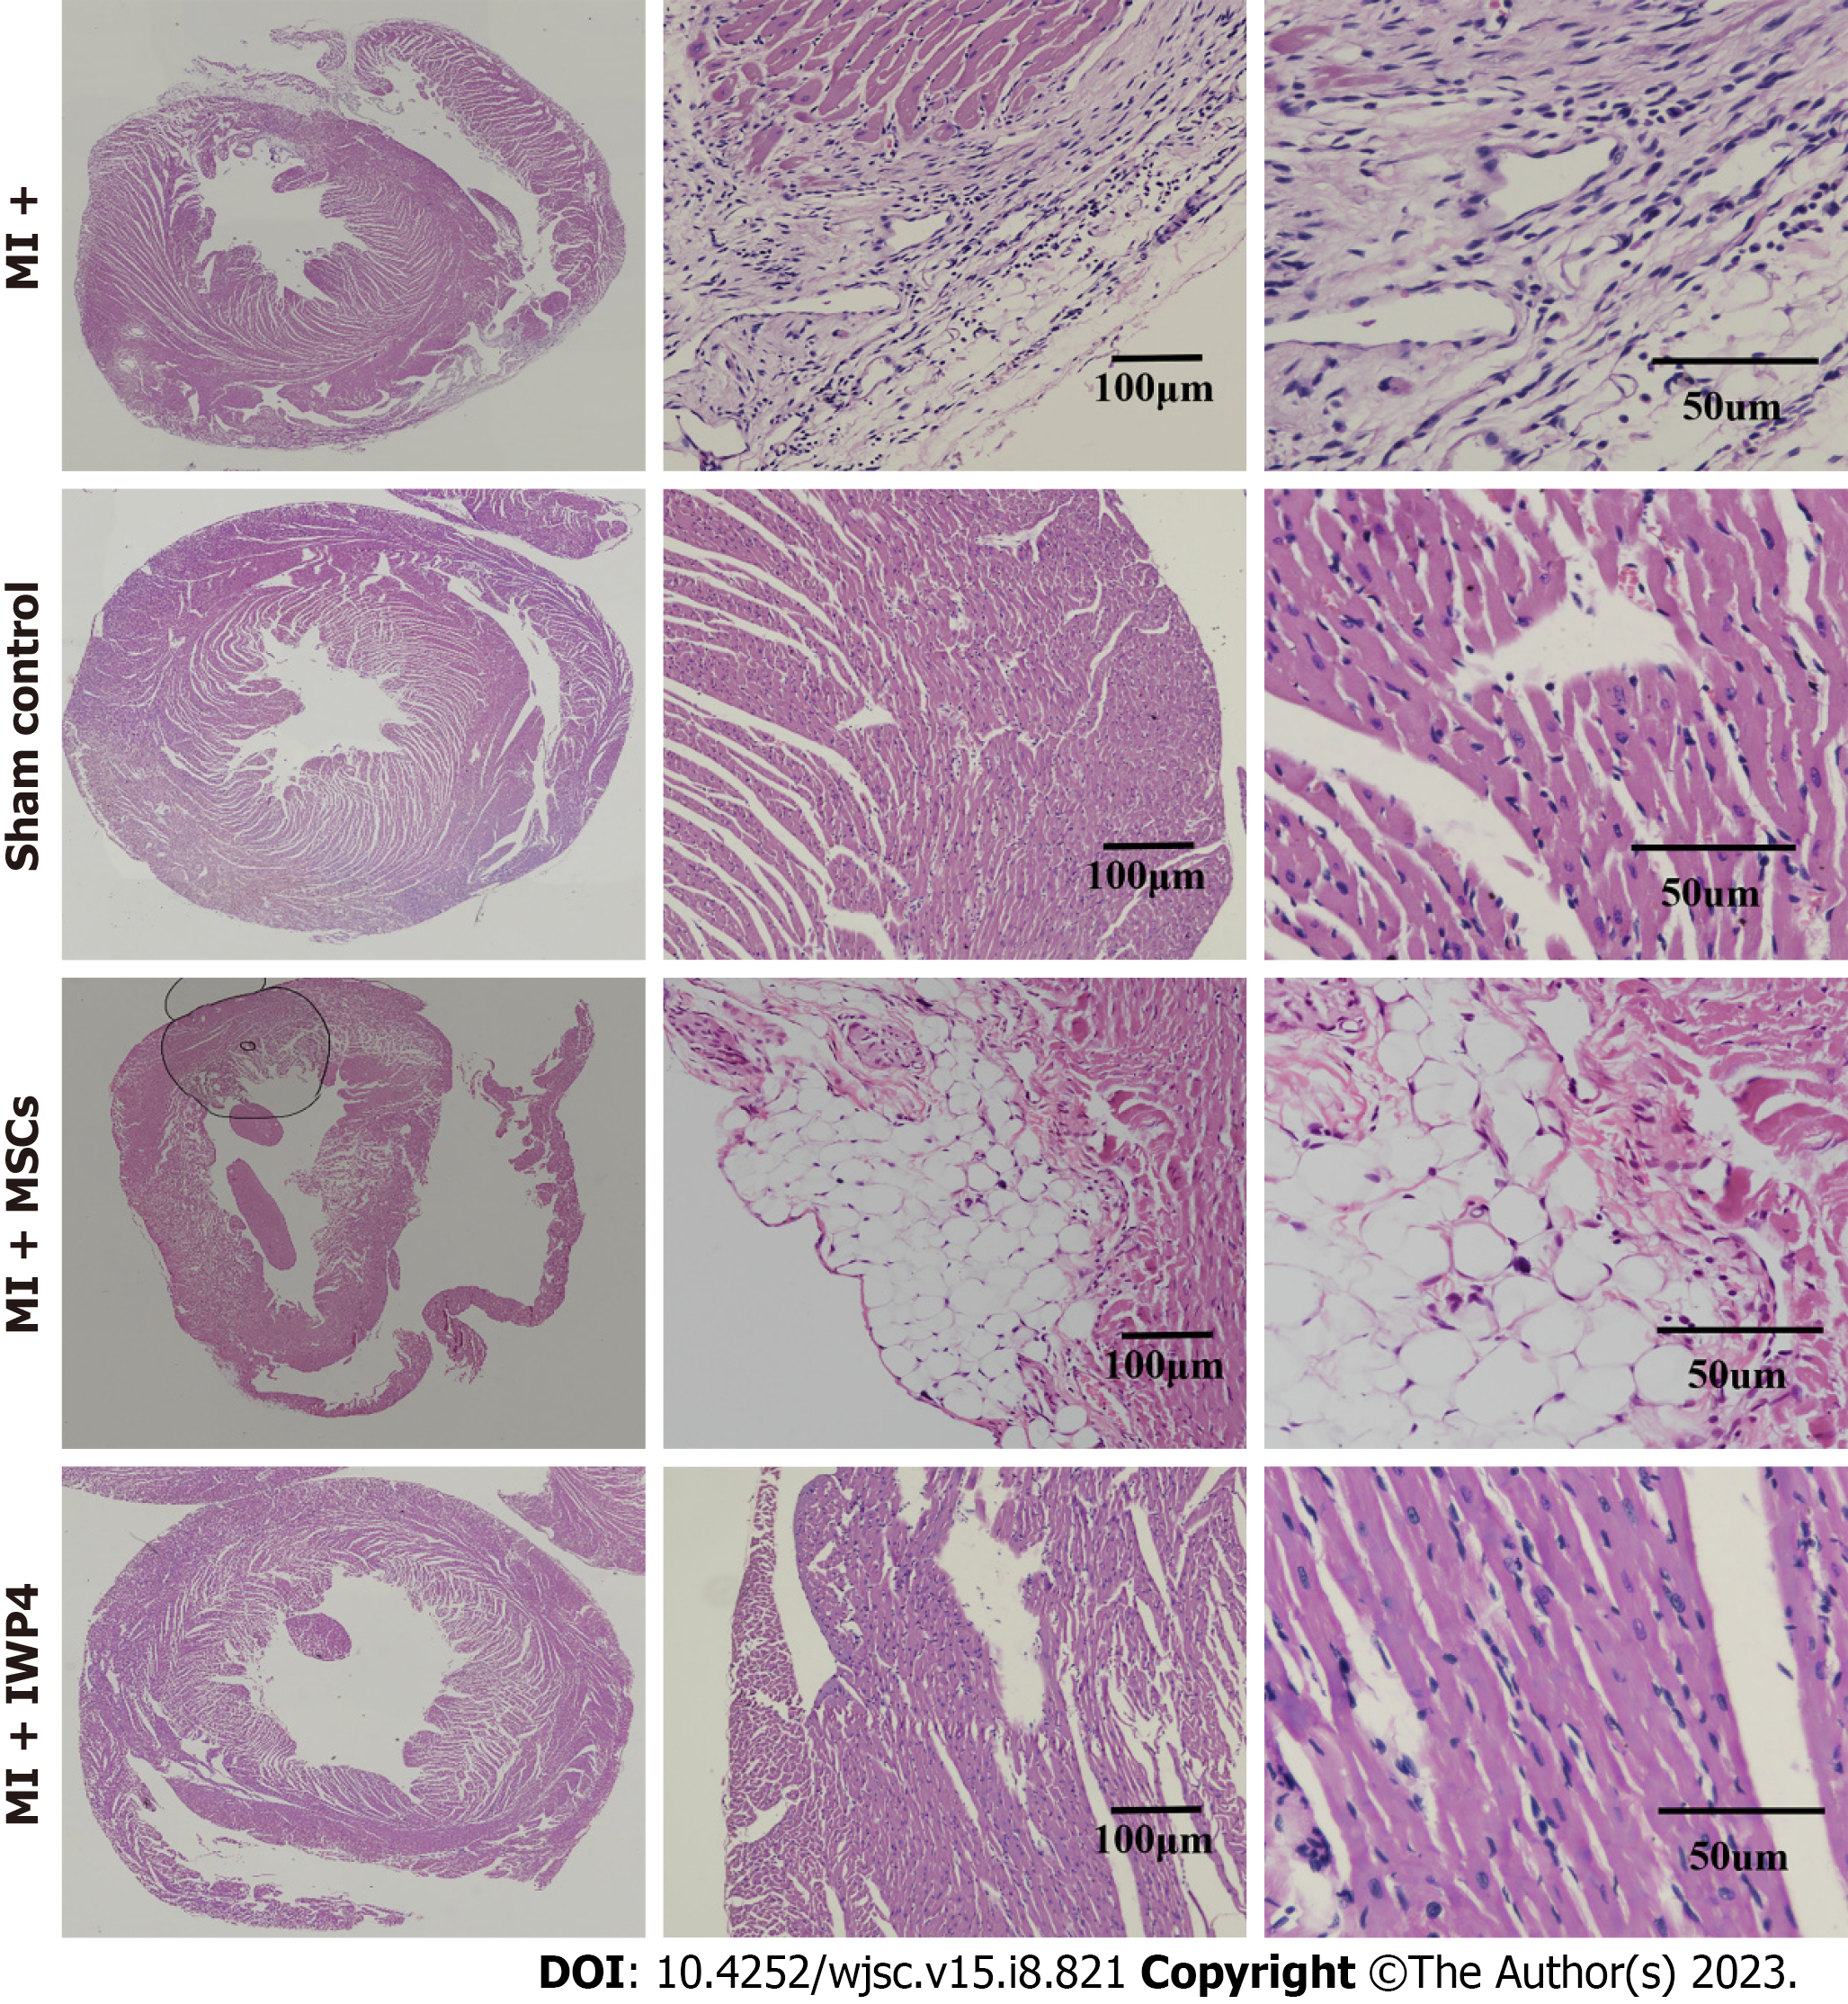
Figure 8 Hematoxylin-Eosin staining of heart section.
Large scan images showing Hematoxylin-Eosin (H&E) stained transverse section of the whole heart. Magnified images showing H&E stained sections in sham control, myocardial infarction (MI) group, mesenchymal stem cells (MSCs) (MI+MSC) group, and inhibitor Wnt production-4 (IWP-4) treated MSCs (MI+IWP-4) group after 4 wk of MI. IWP-4: Inhibitor Wnt production-4; MSC: Mesenchymal stem cell; MI: Myocardial infarction.
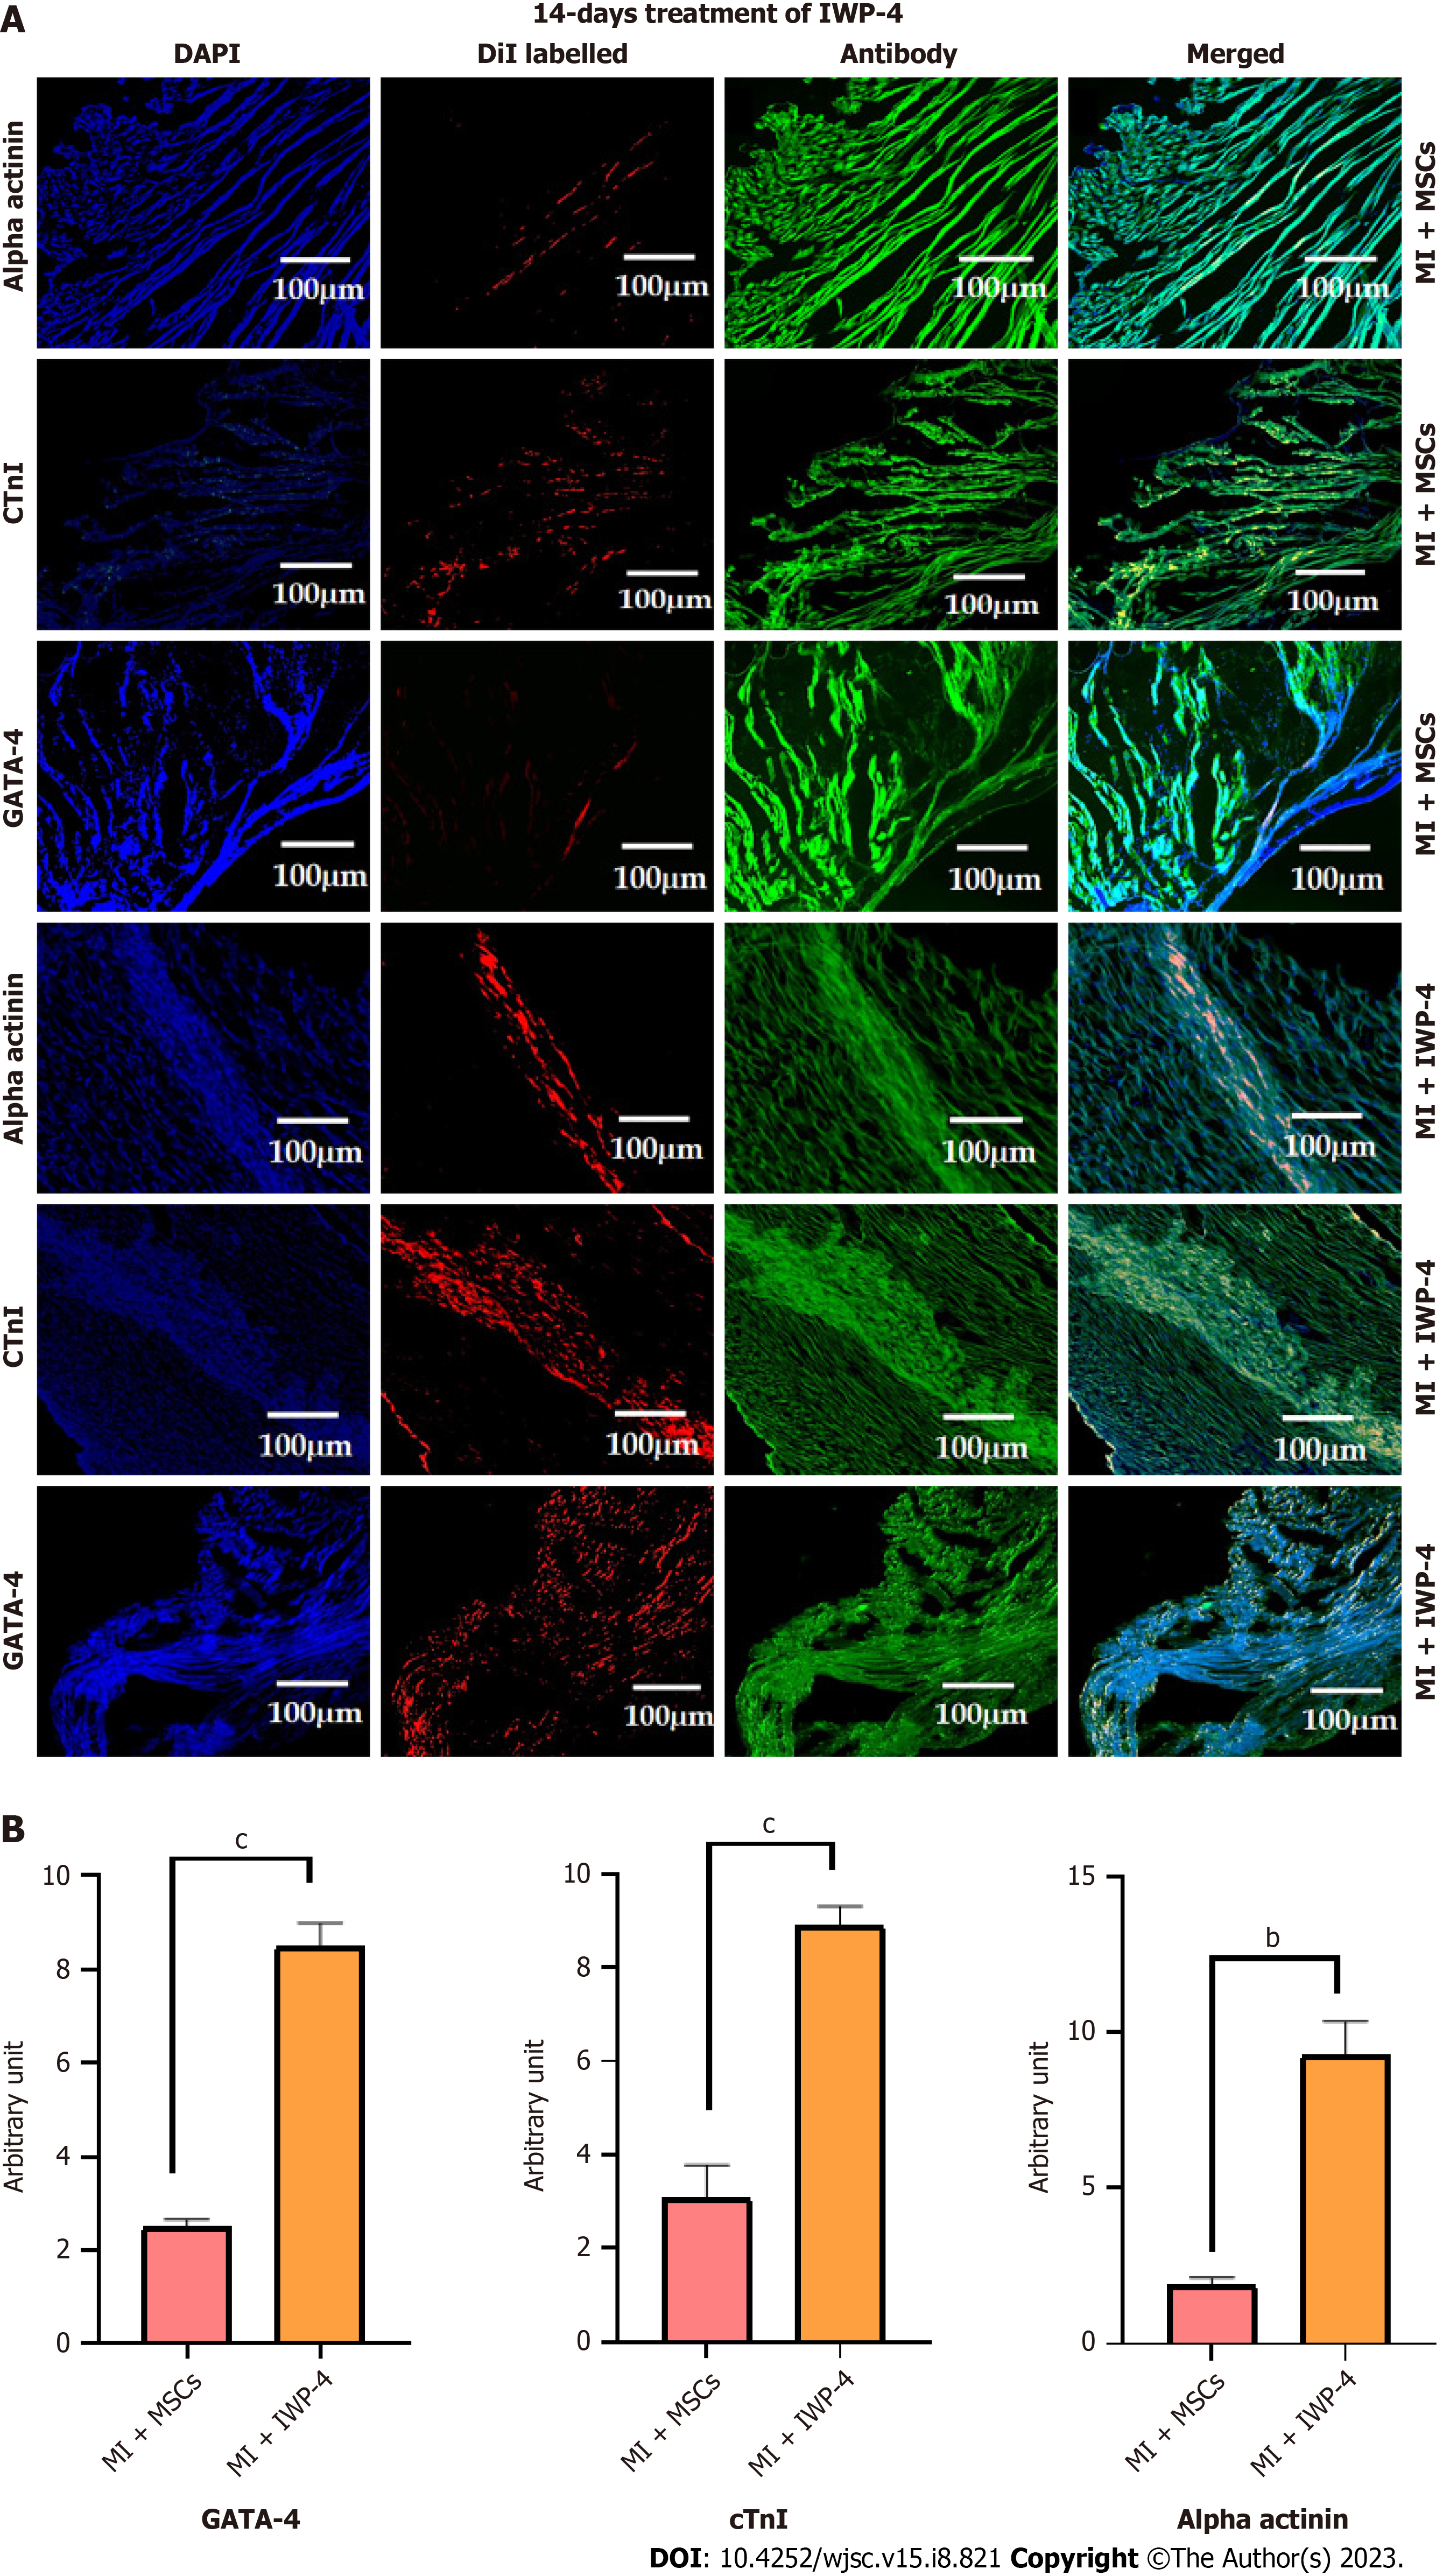
Figure 9 Immunohistochemistry of heart tissue section.
A: Immunohistochemical images of heart sections showing the transplanted untreated mesenchymal stem cells (MSCs) and fourteen days inhibitor Wnt production-4 (IWP-4) treated MSCs labeled with red fluorescent DiI dye. Cardiac specific proteins α-actinin, cTnI, and GATA-4 were immunostained for the expression of cardiac proteins. Alexa fluor 488 secondary antibody was used for detection; B: Quantification of the fluorescence intensities of the DiI labeled cells presented in bar graphs. As compared to normal MSCs, fluorescence intensity was significantly increased in case of alpha actinin, GATA-4, and cTnI in the fourteen days IWP-4 treated MSCs group in the infarcted myocardium. For statistical analysis, One-way ANOVA was used followed by the Bonferroni post-hoc test. Data are presented as mean ± SEM with significance level P < 0.05 where (bP < 0.01, cP < 0.001). IWP-4: Inhibitor Wnt production-4; MSC: Mesenchymal stem cell; MI: Myocardial infarction.
- Citation: Muneer R, Qazi REM, Fatima A, Ahmad W, Salim A, Dini L, Khan I. Wnt signaling pathway inhibitor promotes mesenchymal stem cells differentiation into cardiac progenitor cells in vitro and improves cardiomyopathy in vivo. World J Stem Cells 2023; 15(8): 821-841
- URL: https://www.wjgnet.com/1948-0210/full/v15/i8/821.htm
- DOI: https://dx.doi.org/10.4252/wjsc.v15.i8.821


