Copyright
©The Author(s) 2023.
World J Stem Cells. Jul 26, 2023; 15(7): 751-767
Published online Jul 26, 2023. doi: 10.4252/wjsc.v15.i7.751
Published online Jul 26, 2023. doi: 10.4252/wjsc.v15.i7.751
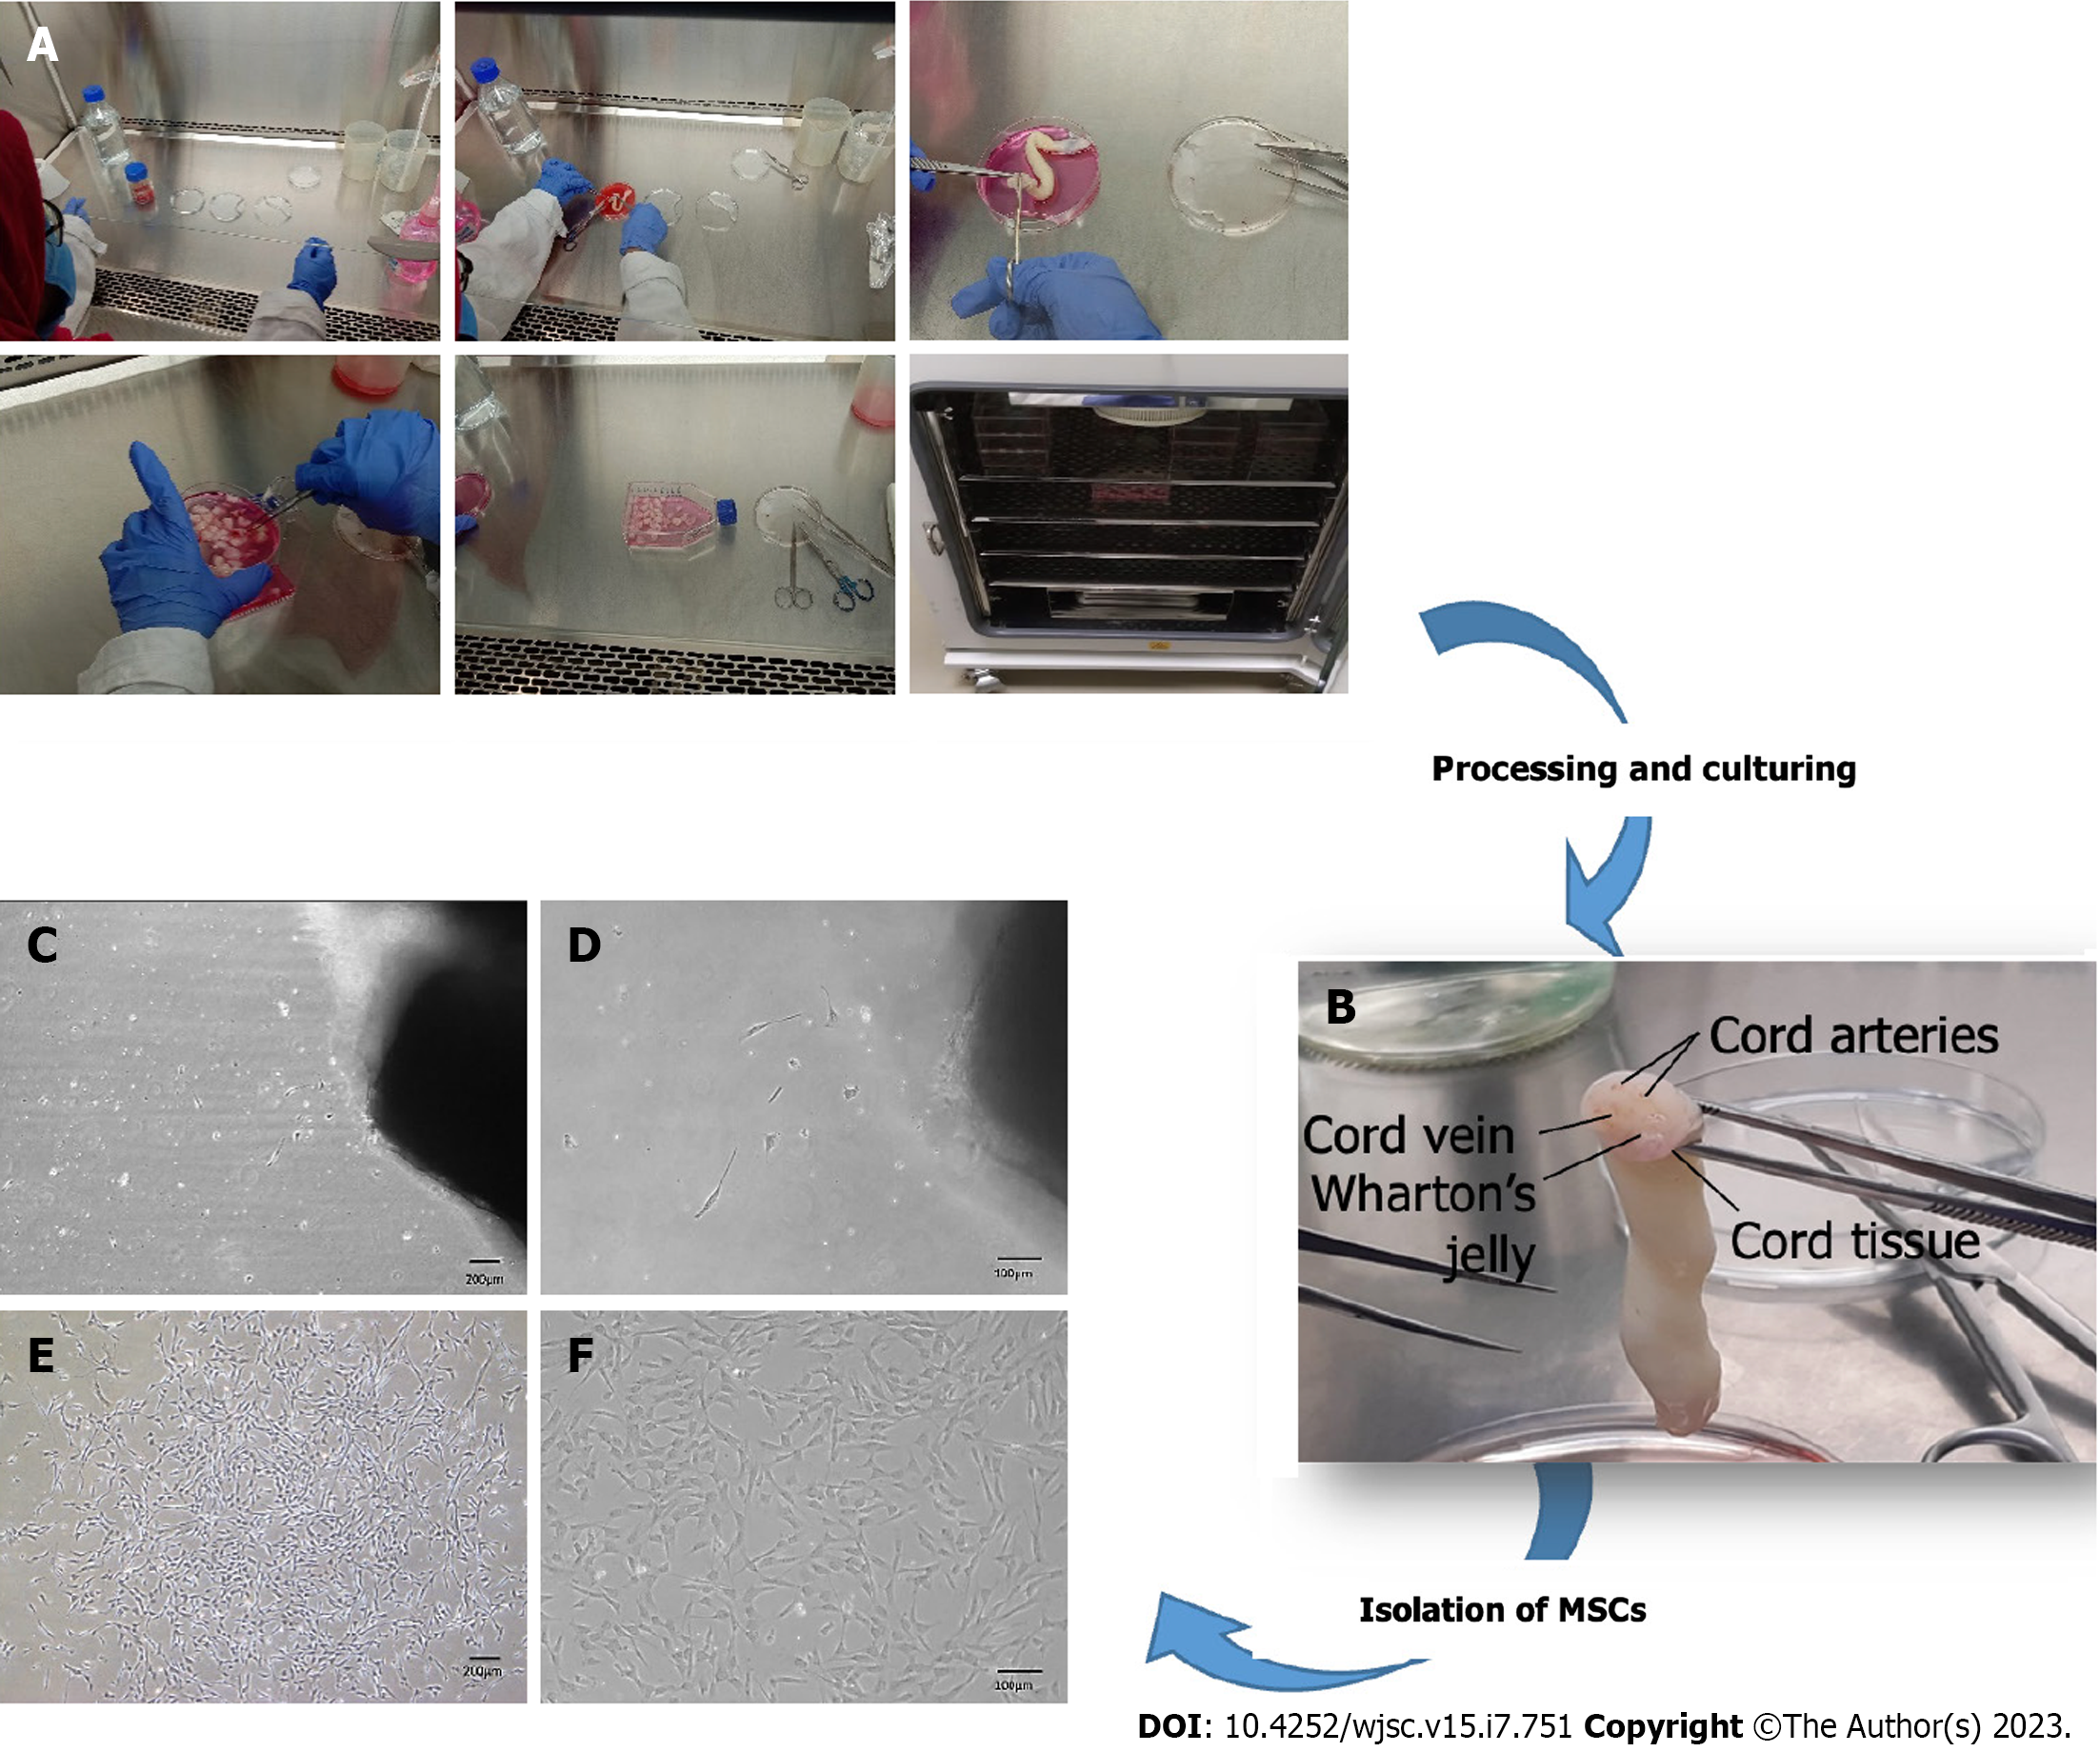
Figure 1 Processing and culturing of human umbilical cord tissue.
A: Demonstration of the pictographic representation of human umbilical cord processing; B: Show cord tissue comprises one vein and two arteries surrounded by Wharton's jelly; C-F: Shows fibroblast-like morphology of mesenchymal stem cells at 4 × and 10 × magnifications at P0 (C and D), while P0 at a later stage shows elongated fibroblast-like morphology, which is interconnected with their extensions and is arranged in colonies (E and F). MSCs: Mesenchymal stem cells.
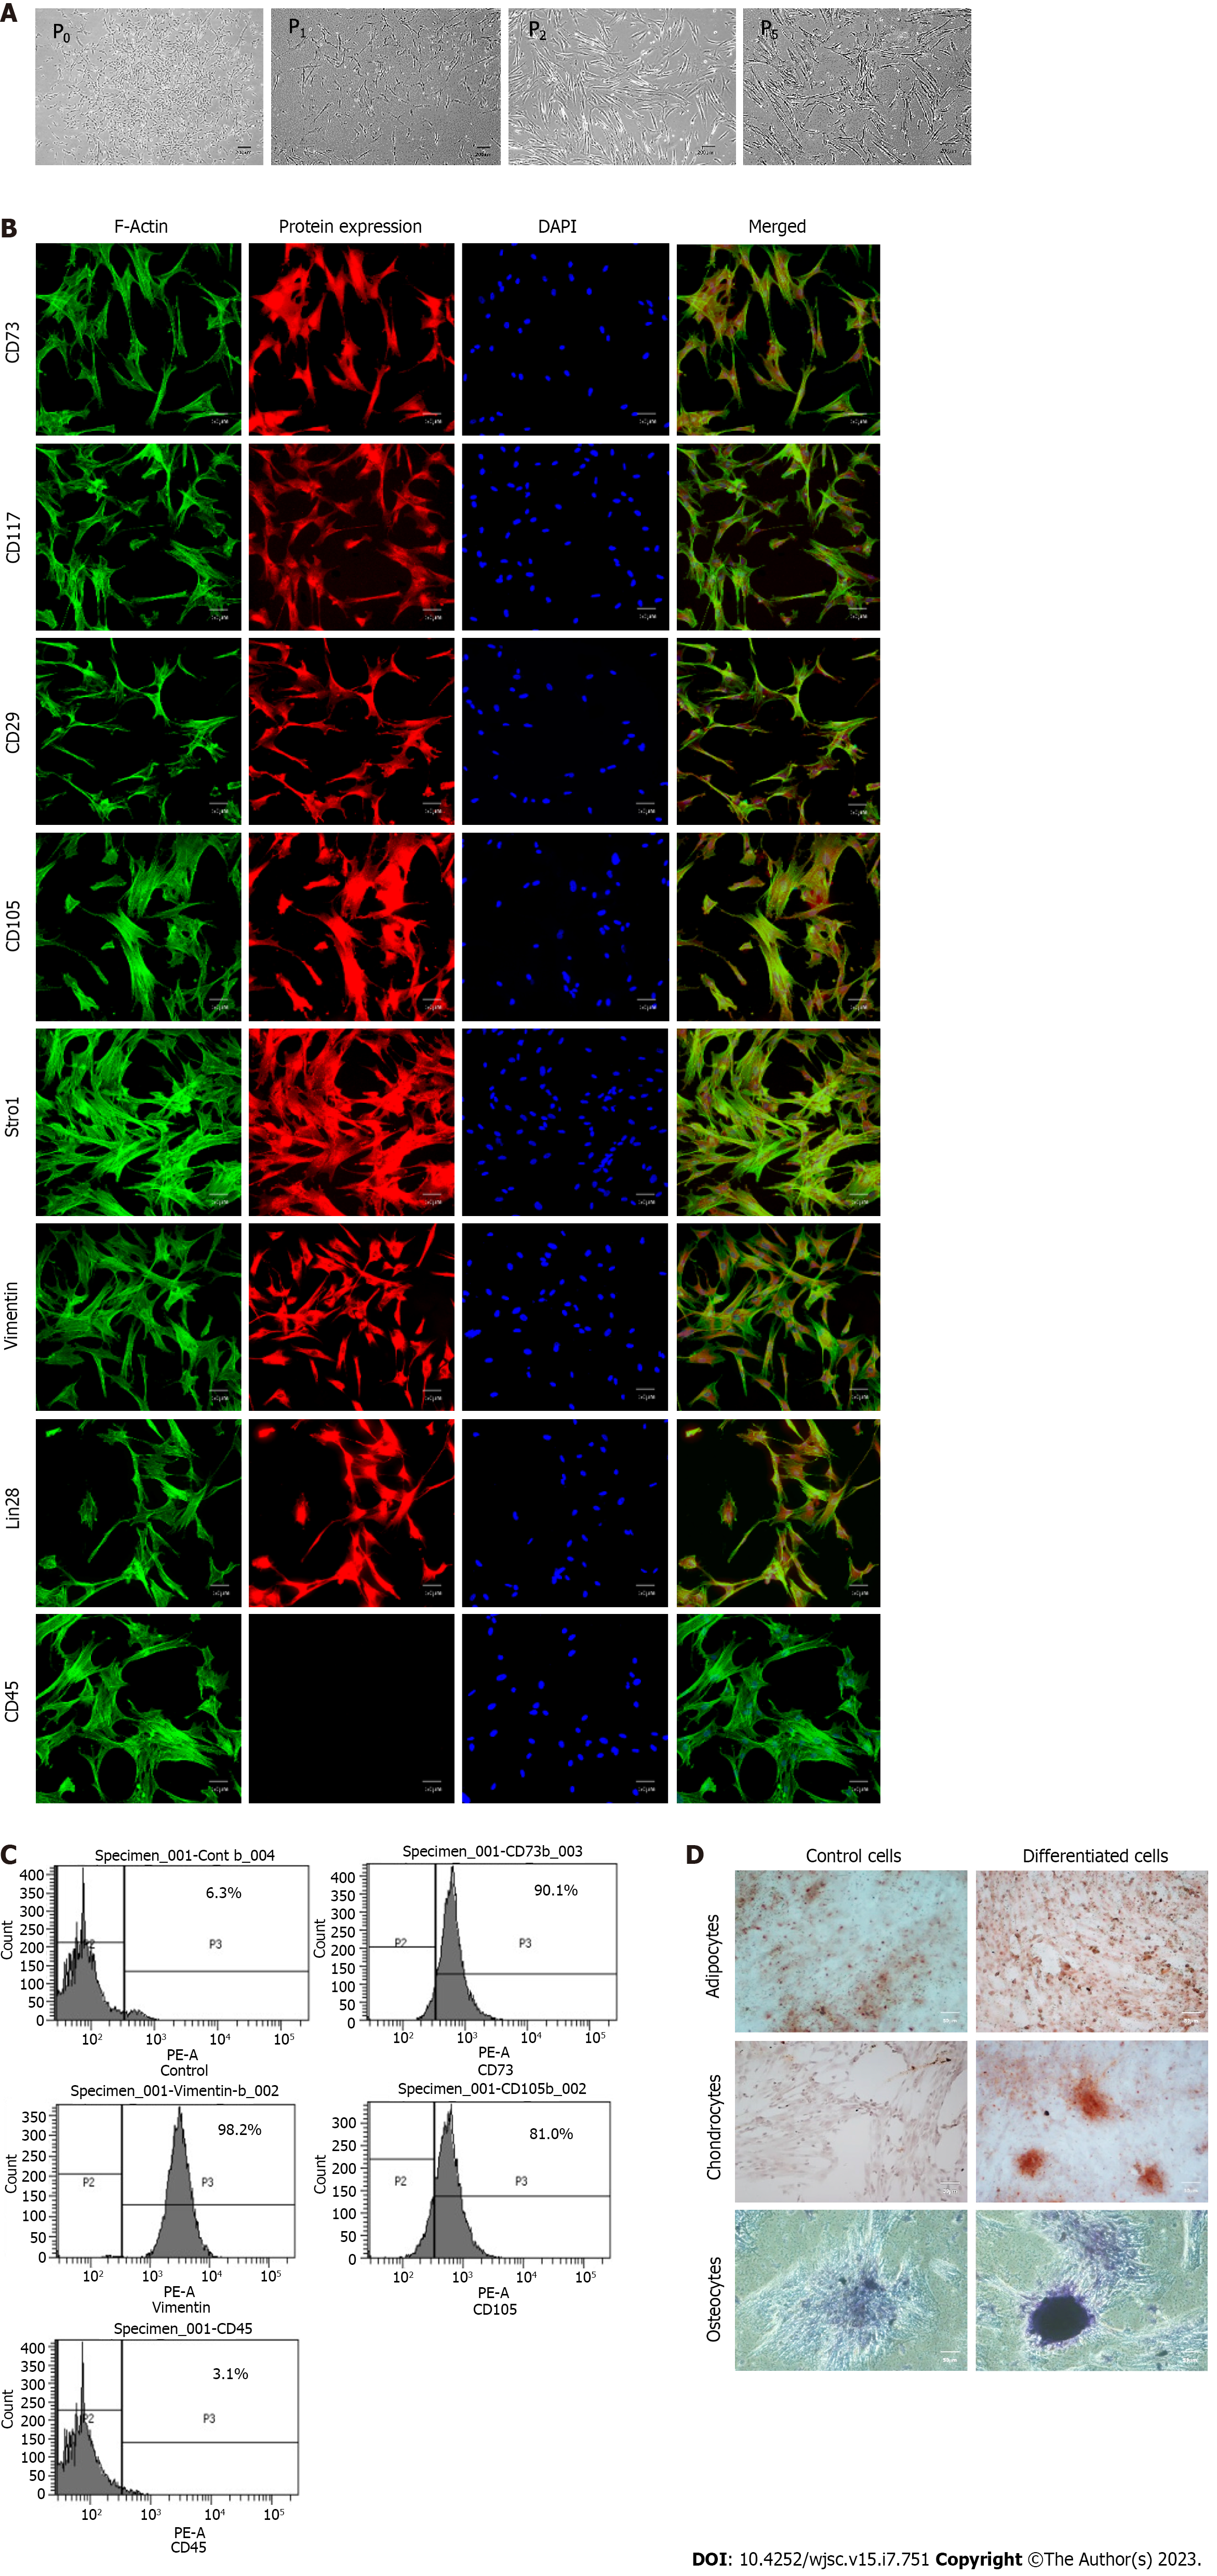
Figure 2 Characterization of human umbilical cord-derived mesenchymal stem cells.
A: Isolated human umbilical cord-derived mesenchymal stem cells appeared as elongated, fibroblast-like cells which were slightly trigonal at P0 and then gradually became elongated in latter passages (P1, P2, P5); B: These cells positively expressed CD73, CD117, CD29, CD105, Stro1, Vimentin, and Lin28 while exhibiting negative expression of CD45; C: Cell surface analysis by flowcytometry showed that more than 80% of the cell population was positive for CD73, vimentin, and CD105 while less than 4% were positive for hematopoietic marker i.e. CD45; D: The cells were successfully differentiated into adipocytes, osteocytes, and chondrocytes. Oil red O stain, alizarin red S stain, and Alcian blue stain confirmed the presence of lipids vacuoles, calcium deposits, and glycosaminoglycan in adipocytes, osteocytes, and chondrocytes, respectively.
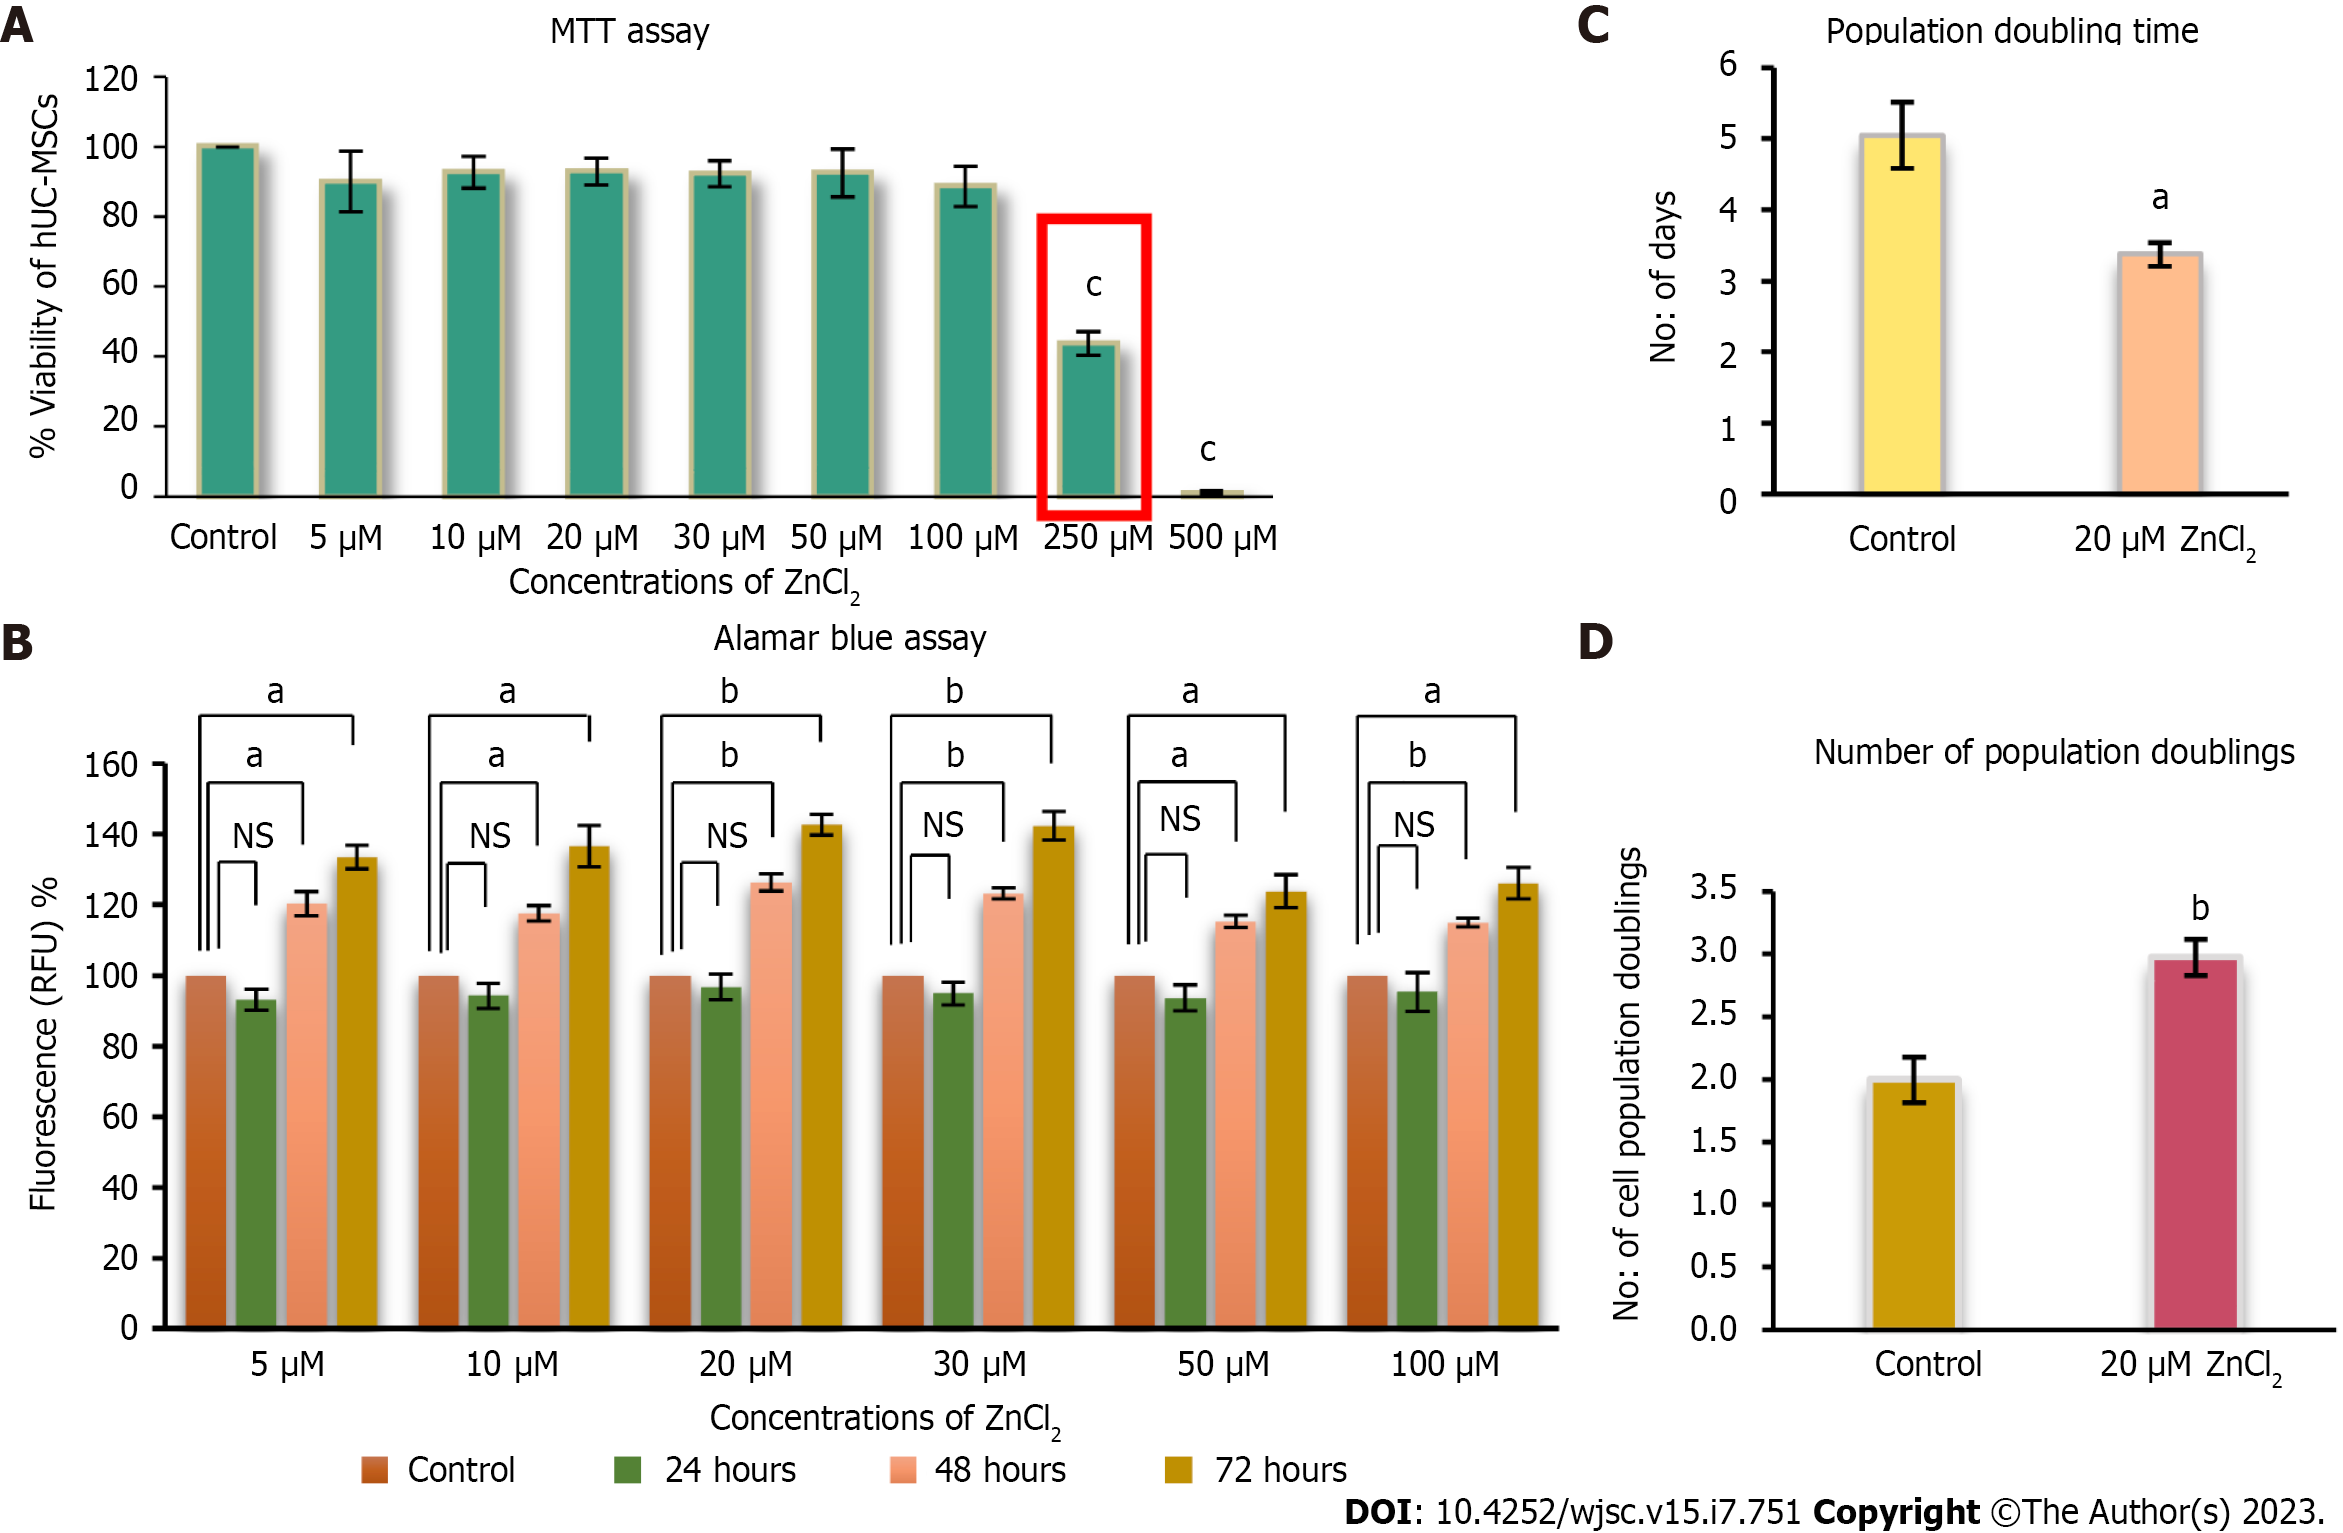
Figure 3 Cytotoxic analysis of ZnCl2 for human umbilical cord-derived mesenchymal stem cells.
A: Concentrations of ZnCl2 5 µM, 10 µM, 20 µM, 30 µM, 50 µM, 100 µM, 250 µM, and 500 µM, were analyzed for their cytotoxicity by MTT assay. Concentrations from 5 µM to 100 µM did not show any significant decrease in viability (Percent) of human umbilical cord (hUC)-derived mesenchymal stem cells (MSCs) compared to control. 250 µM reflected IC50 value of ZnCl2, and both 250 µM and 500 µM concentrations were found to be significantly (cP ≤ 0.001) cytotoxic. Results were analyzed by performing one-way ANOVA and Post-Hoc Bonferroni test; B: Alamar blue assay analysis of hUC-MSCs after 24 h after ZnCl2 did not exhibit any significant difference between control and test groups. But after 48 and 72 h, the proliferation of MSCs was significantly increased (aP ≤ 0.05, bP ≤ 0.01) in all test groups. For further experiments, 20 µM of ZnCl2 was selected as the test group concentration. C: Test group 20 µM ZnCl2 exhibited significantly higher (bP ≤ 0.01) NPD i.e., 2.9 ± 0.14, as compared to the control group, which showed 1.9 ± 0.18. Significantly reduced (aP ≤ 0.05) D: PDT was observed in the test group i.e., approximately 3 d ± 0.16 in contrast to the control group having population doubling time of 5 ± 0.46 d. Results were analyzed by independent sample t-Test. Data is presented as mean ± SD (n = 3) where the significance level is
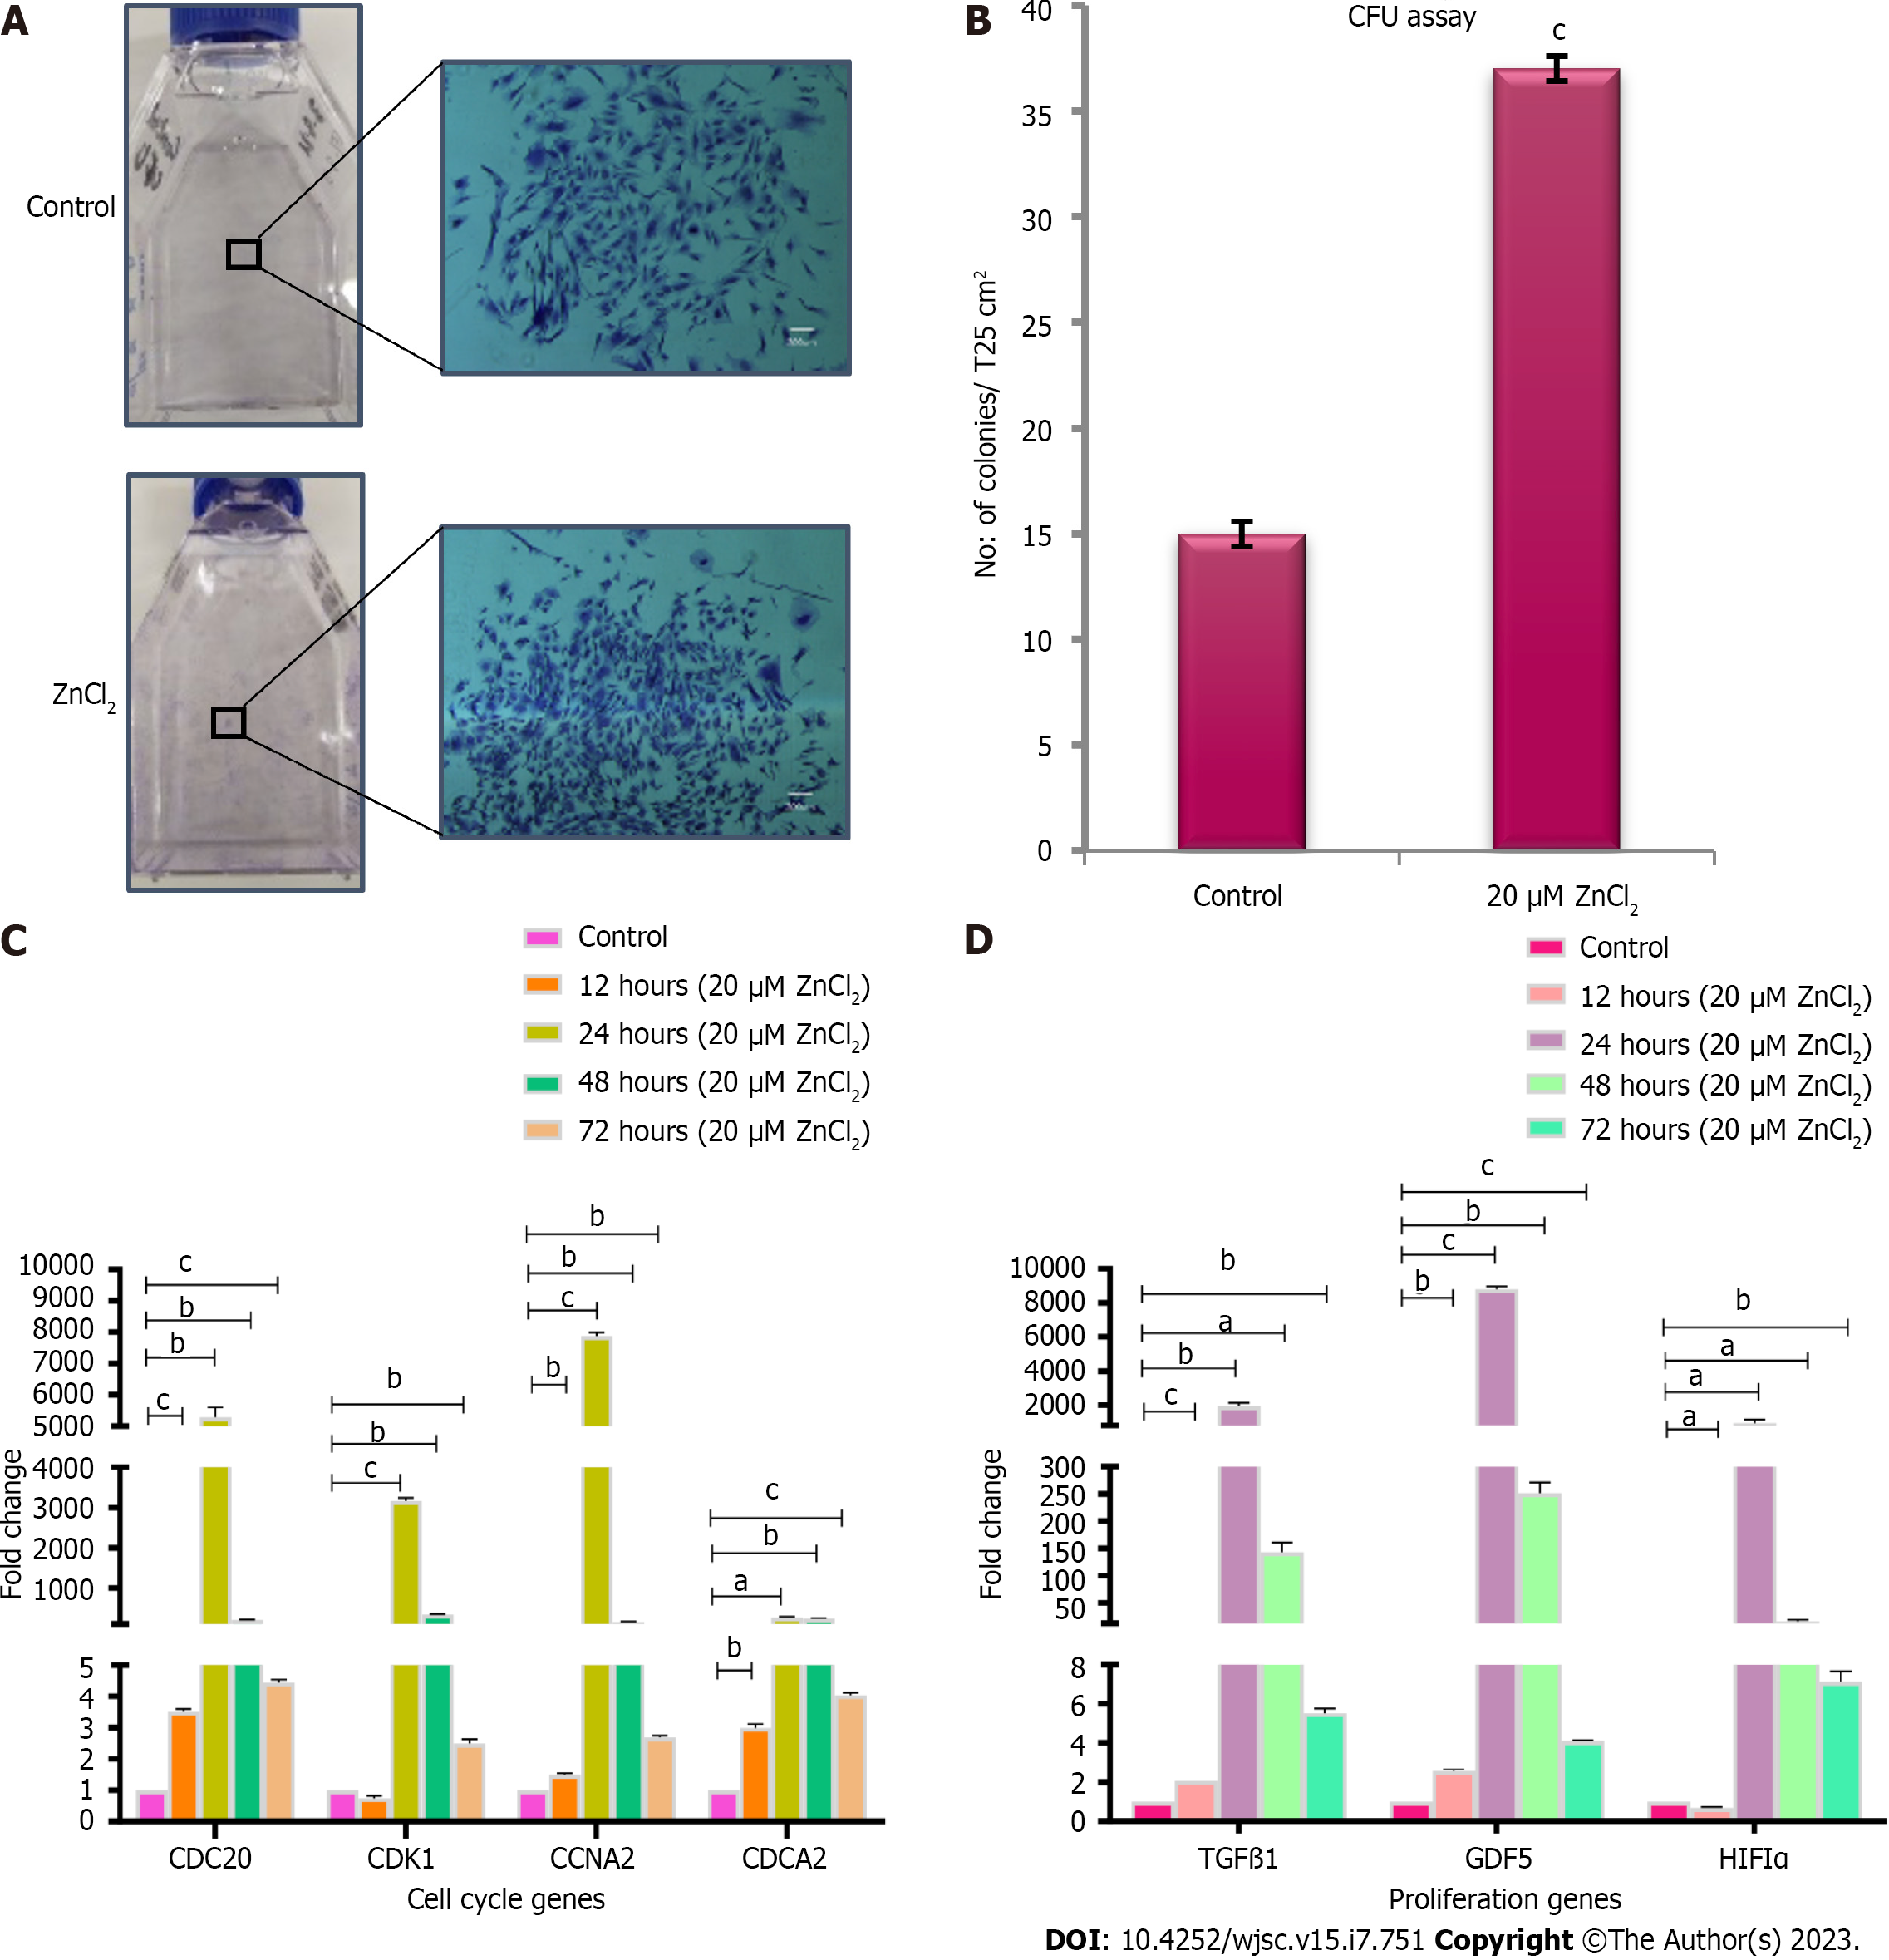
Figure 4 Colony forming unit assay and transcriptional analysis of cell cycle and proliferation genes.
A: Colonies after crystal violet staining in control and test groups. Denser colonies were observed in ZnCl2 treated group. Images were captured at 4 × magnification; B: A significantly higher number (cP ≤ 0.001) of colonies was observed in ZnCl2 treated group with a mean number of 37 ± 0.57 colonies per T25 flask as compared to control i.e., 15 ± 0.57 colonies per T25 flask. Results were analyzed by SPSS, performing an independent sample t-Test. C: Gene expression of cell cycle genes CDC20, CCNA2, CDCA2 was significantly increased in the test group after 12, 24, 48, and 72 h of treatment with 20 µM ZnCl2. No significant difference was found in CDK1 gene expression after 12, but it was significantly enhanced after 24, 48, and 72 h. This fold change (2-ΔΔCt) increase in genes expression was highest in the 24-h group. D: Gene expression of proliferation genes transforming growth factor β1 and GDF5 were significantly increased in all temporal groups i.e. 12, 24, 48, and 72 h, of 20 µM ZnCl2. HIF1α significantly decreased after 12 h but then significantly increased after 24, 48, and 72 h. Results were analyzed by SPSS, performing an independent sample t-Test. Data was represented as mean ± SD (n = 3) where significance level aP ≤ 0.05 (aP ≤ 0.05, bP ≤ 0.01, cP ≤ 0.001).
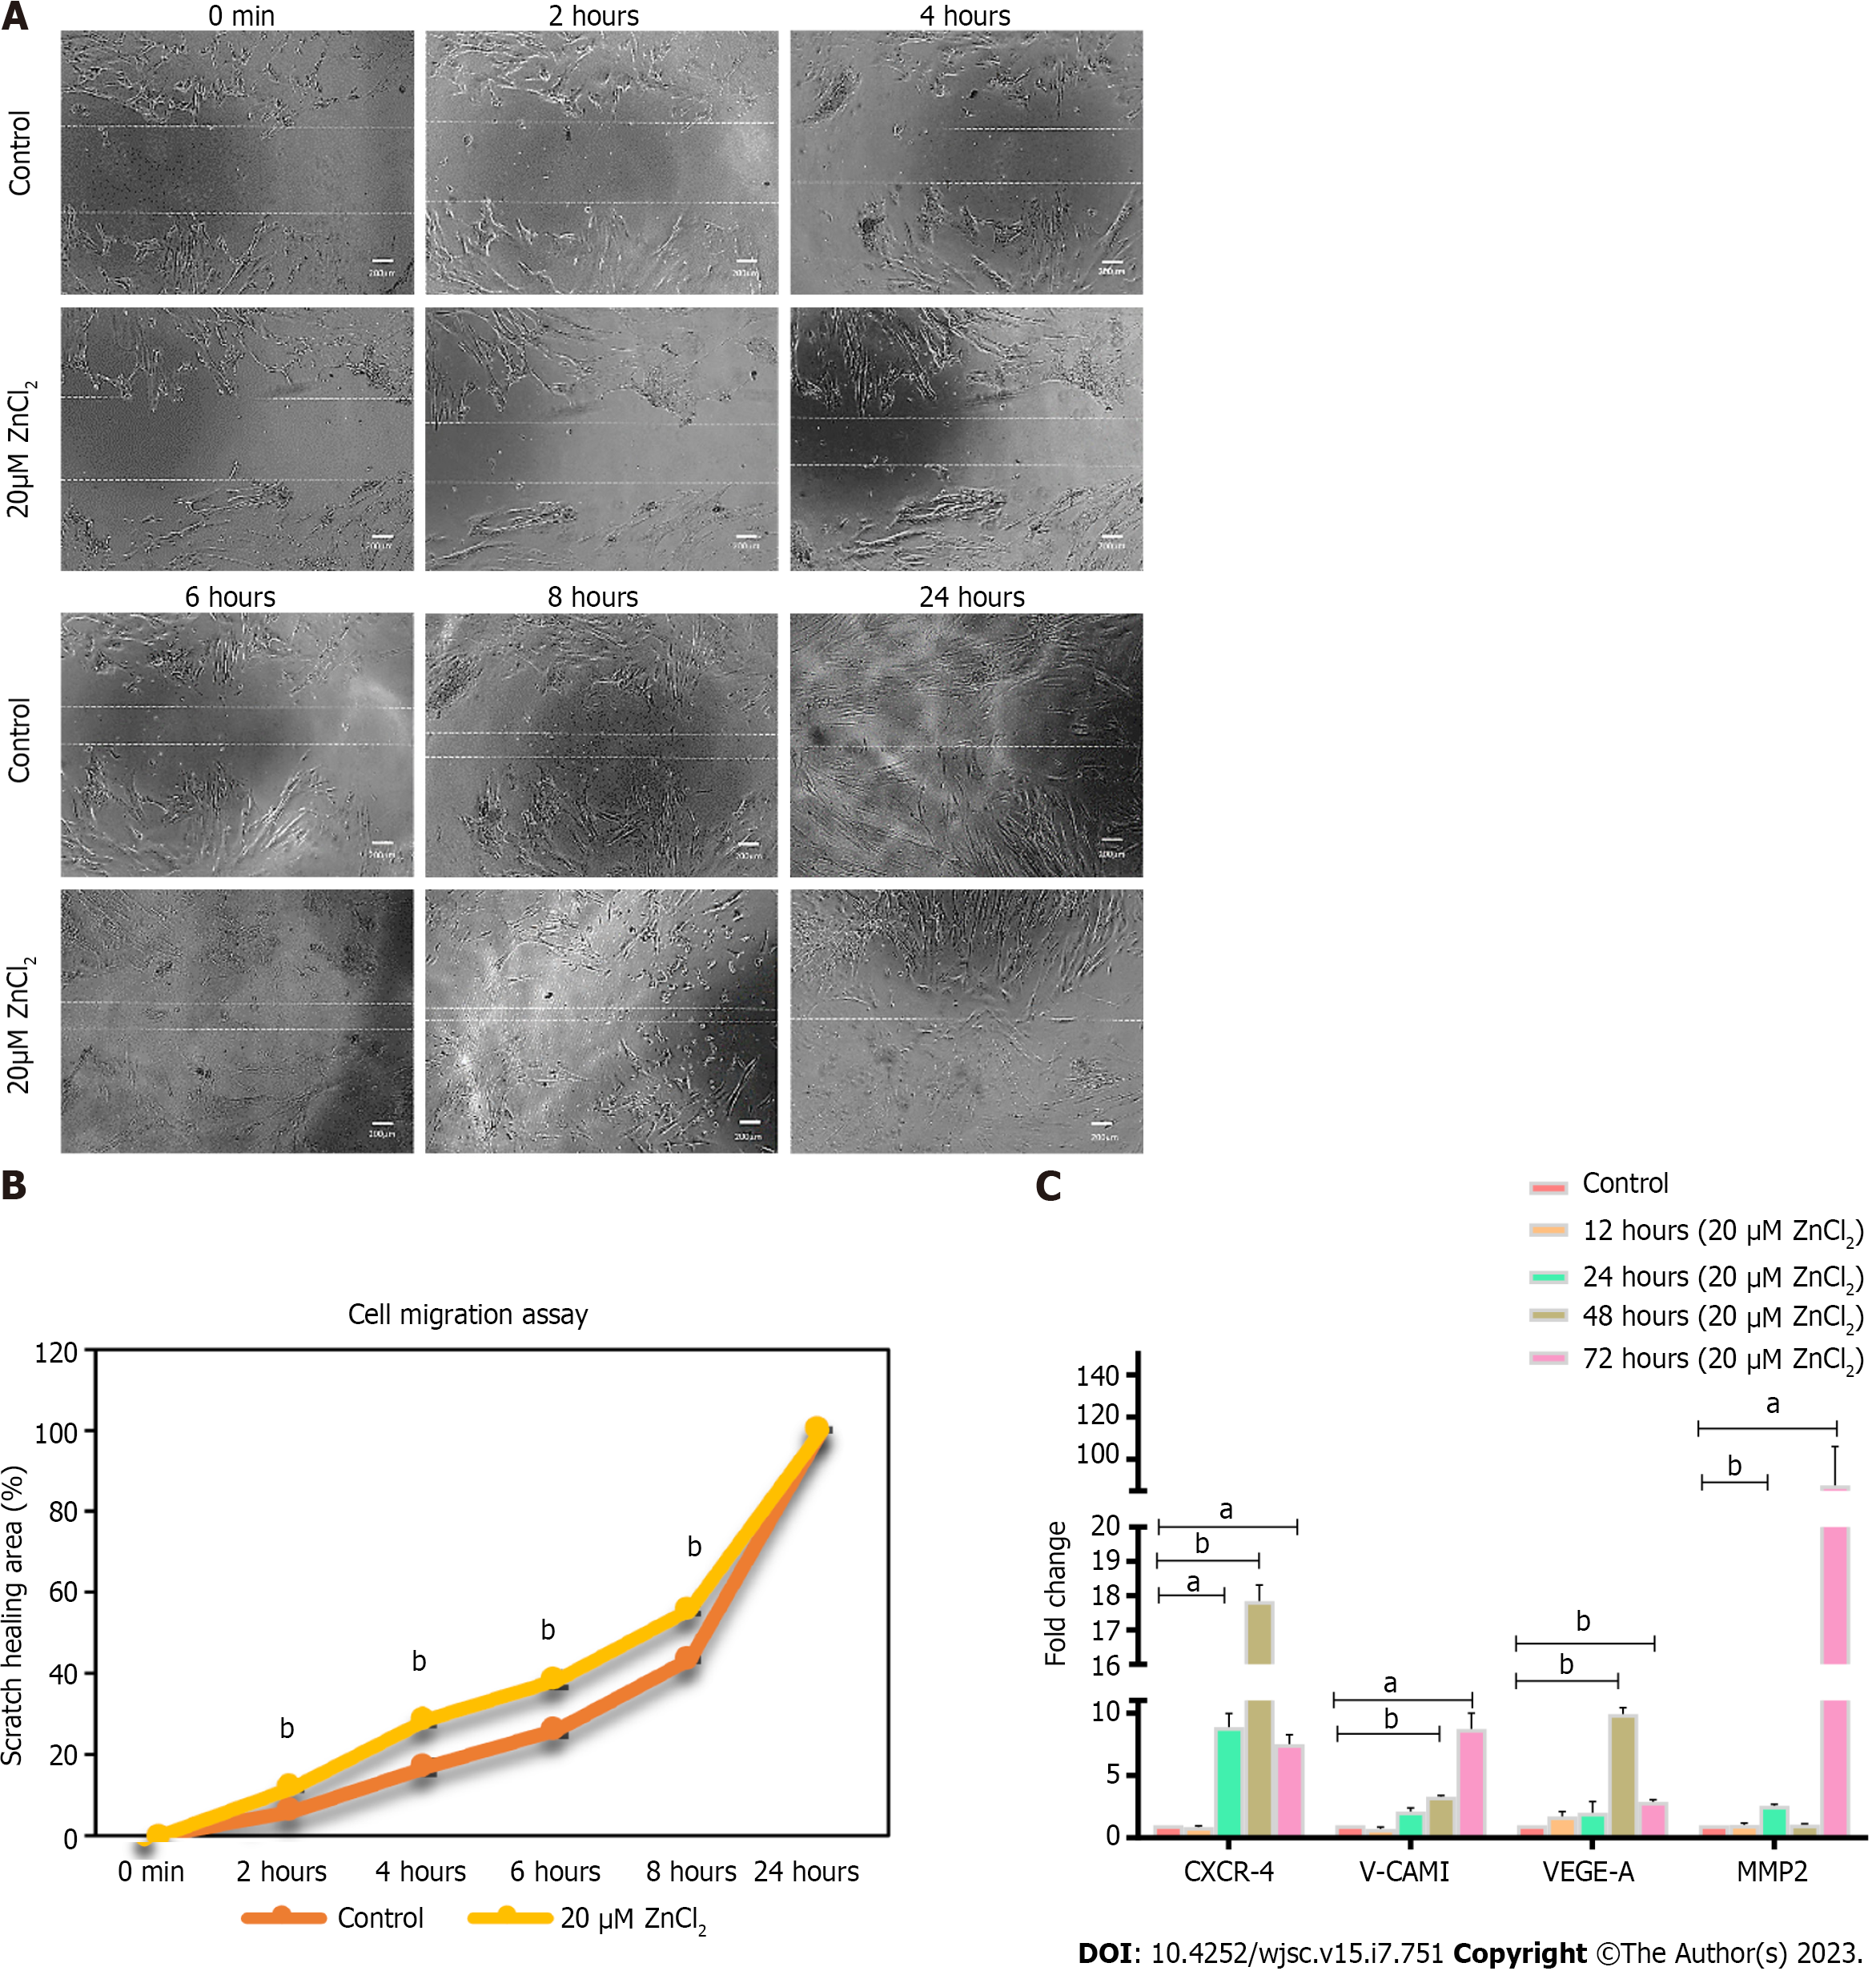
Figure 5 Effect of ZnCl2 on the migration potential of human umbilical cord-derived mesenchymal stem cells.
A: Microscopic examination of human umbilical cord (hUC)-derived mesenchymal stem cells (MSCs) immediately after the scratch was given, i.e., 0 h, and after 2 h, 4 h, 6 h, 8 h, and 24 h. MSCs of the test group (20 µM ZnCl2) exhibited faster migration as compared to control at all time points up to 8 h, and the scratch was completely healed after 24 h in both groups; B: Percentage of the area of scratch healed at time points, i.e., 0 min, 2 h, 4 h, 6 h, 8 h, and 24 h, analyzed by independent sample t-test. MSCs exhibited a significantly (bP ≤ 0.01) increased migration (Percent) in the test group (20 µM ZnCl2). C: Gene expression analysis of migration factors CXCR-4, V-CAM 1, VEGF-A, and MMP2, after 12, 24, 48, and 72 h of 20 µM ZnCl2 treatment. CRCR-4 exhibited significantly increased expression after 24 h, 48 h, and 72 h of treatment. V-CAM1, and VEGF-A showed significantly higher expression after 48 and 72 h of treatment. MMP2 showed enhanced expression after 24 and 72 h. Results were analyzed by independent sample t-Test. Data was analyzed as mean ± SD (n = 3) where significance level aP ≤ 0.05 (aP ≤ 0.05, bP ≤ 0.01, cP ≤ 0.001).
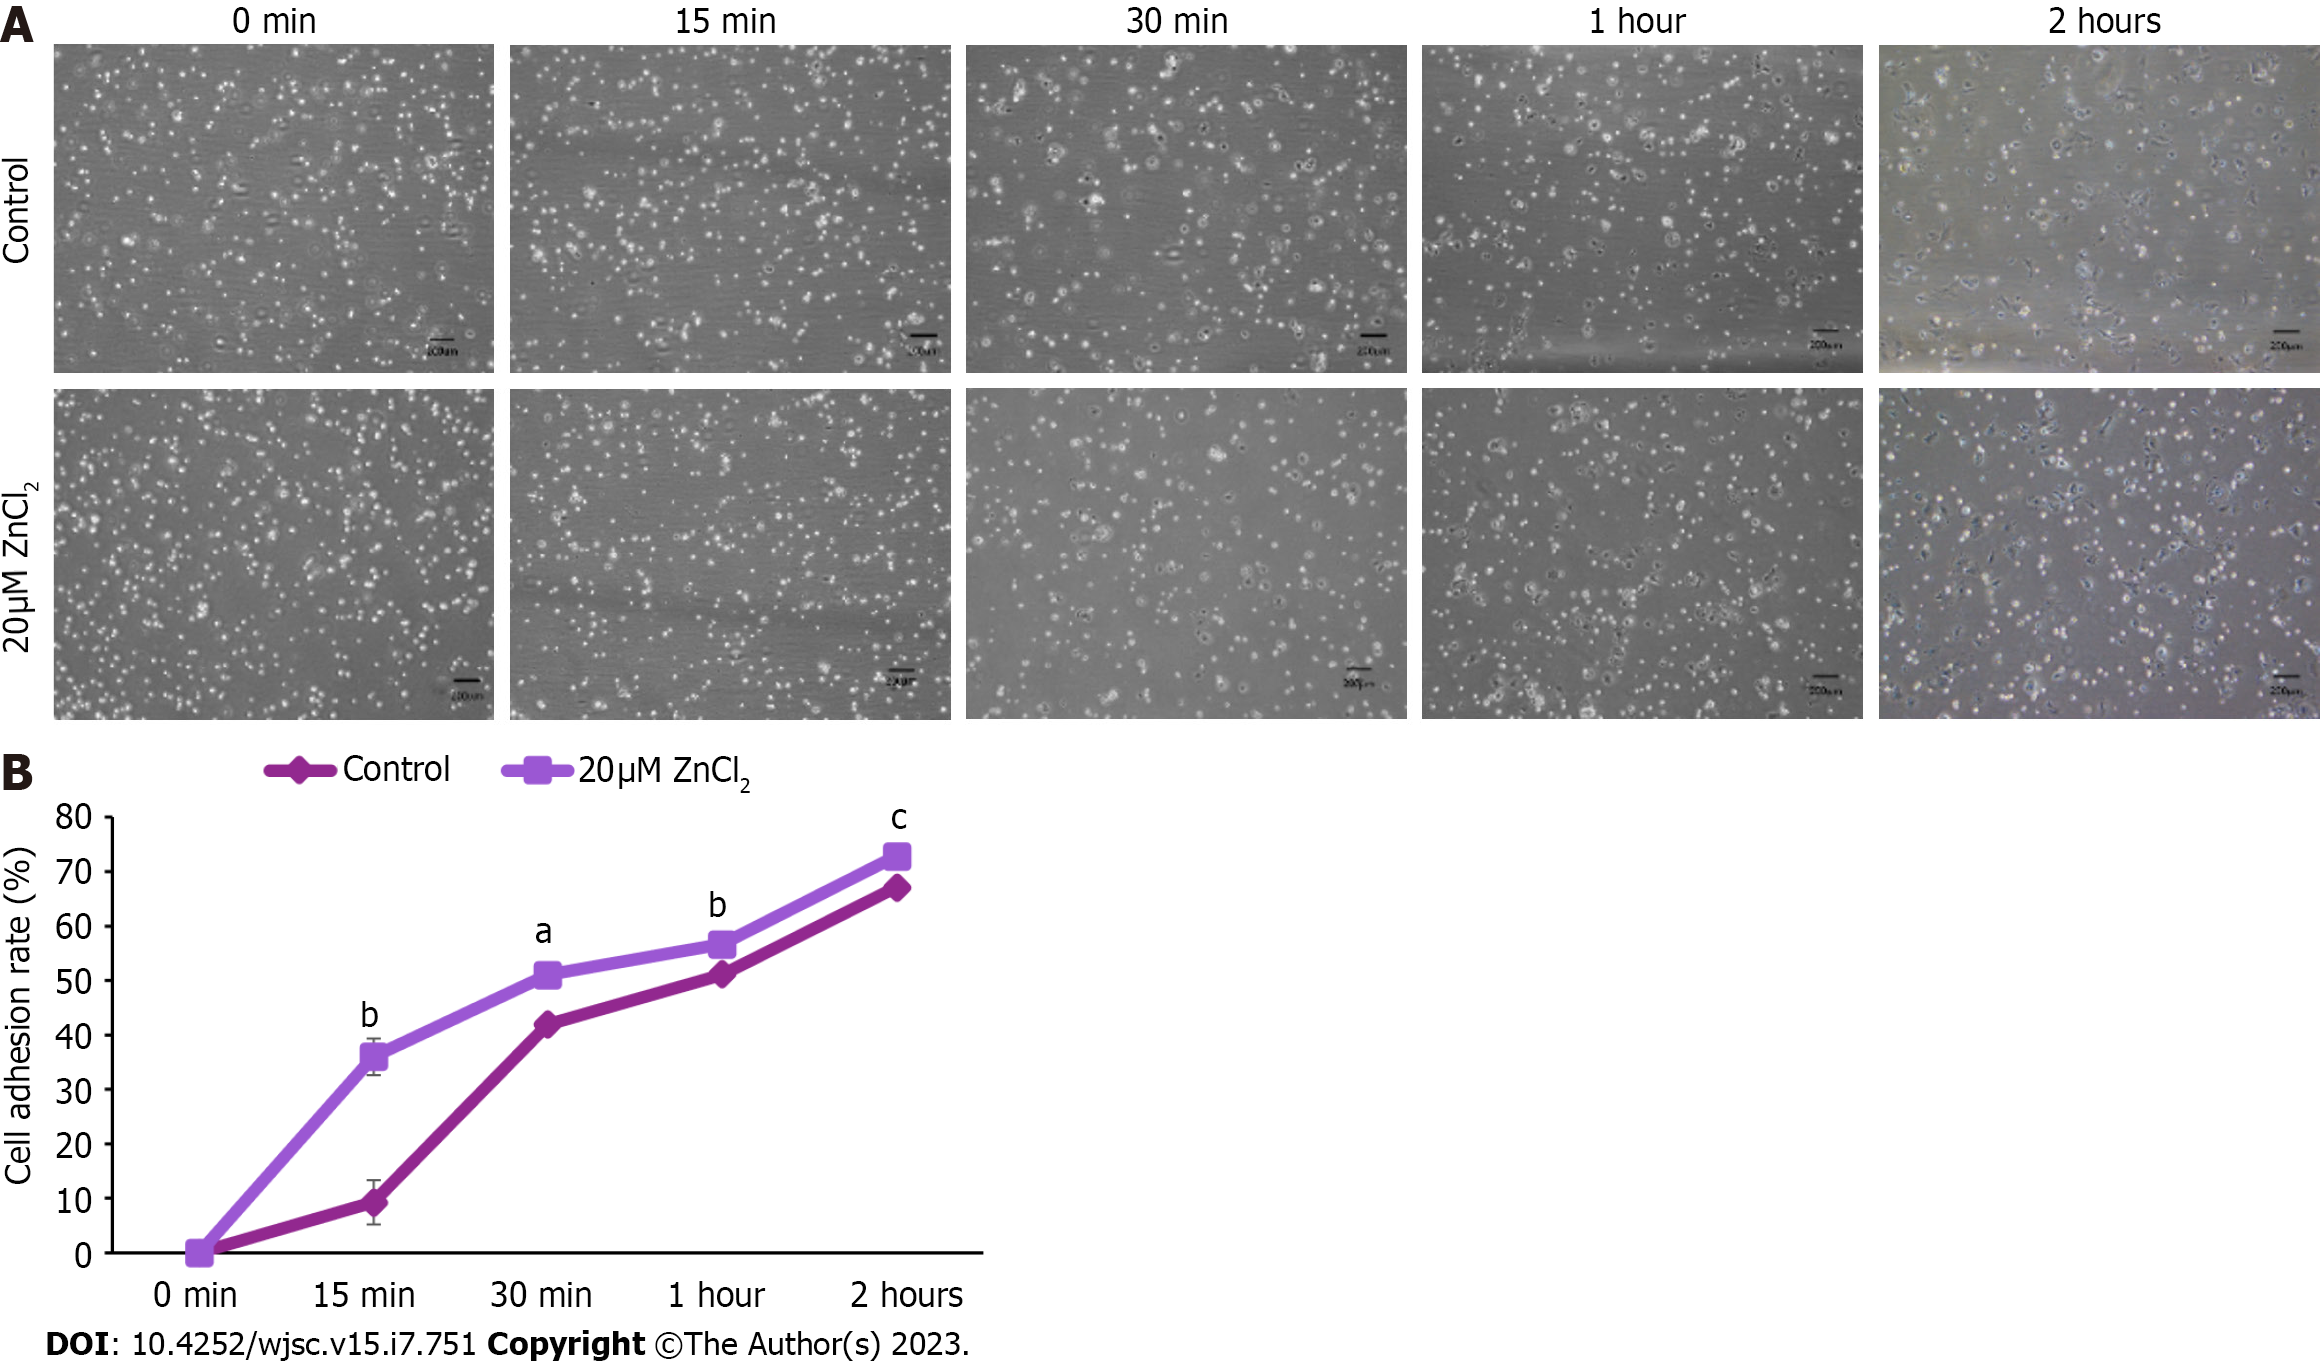
Figure 6 Effect ZnCl2 on adhesion ability of human umbilical cord-derived mesenchymal stem cells.
A: Images of human umbilical cord (hUC)-derived mesenchymal stem cells (MSCs) of the control group and 20 µM ZnCl2 treated groups at 0 min, 15 min, 30 min, 1 h, and 2 h of cell seeding. Bright, rounded, and freely floating cells represent unadhered cells while dark cells represent adhered cells; B: Significant increase was observed in the adhesion ability of hUC-MSCs of the treated group after 15 min (bP ≤ 0.01), 30 min (aP ≤ 0.05),1 h (bP ≤ 0.01), and 2 h (cP ≤ 0.001). An independent sample t-test was performed to analyze results, and data were represented as mean ± SD (n = 3).
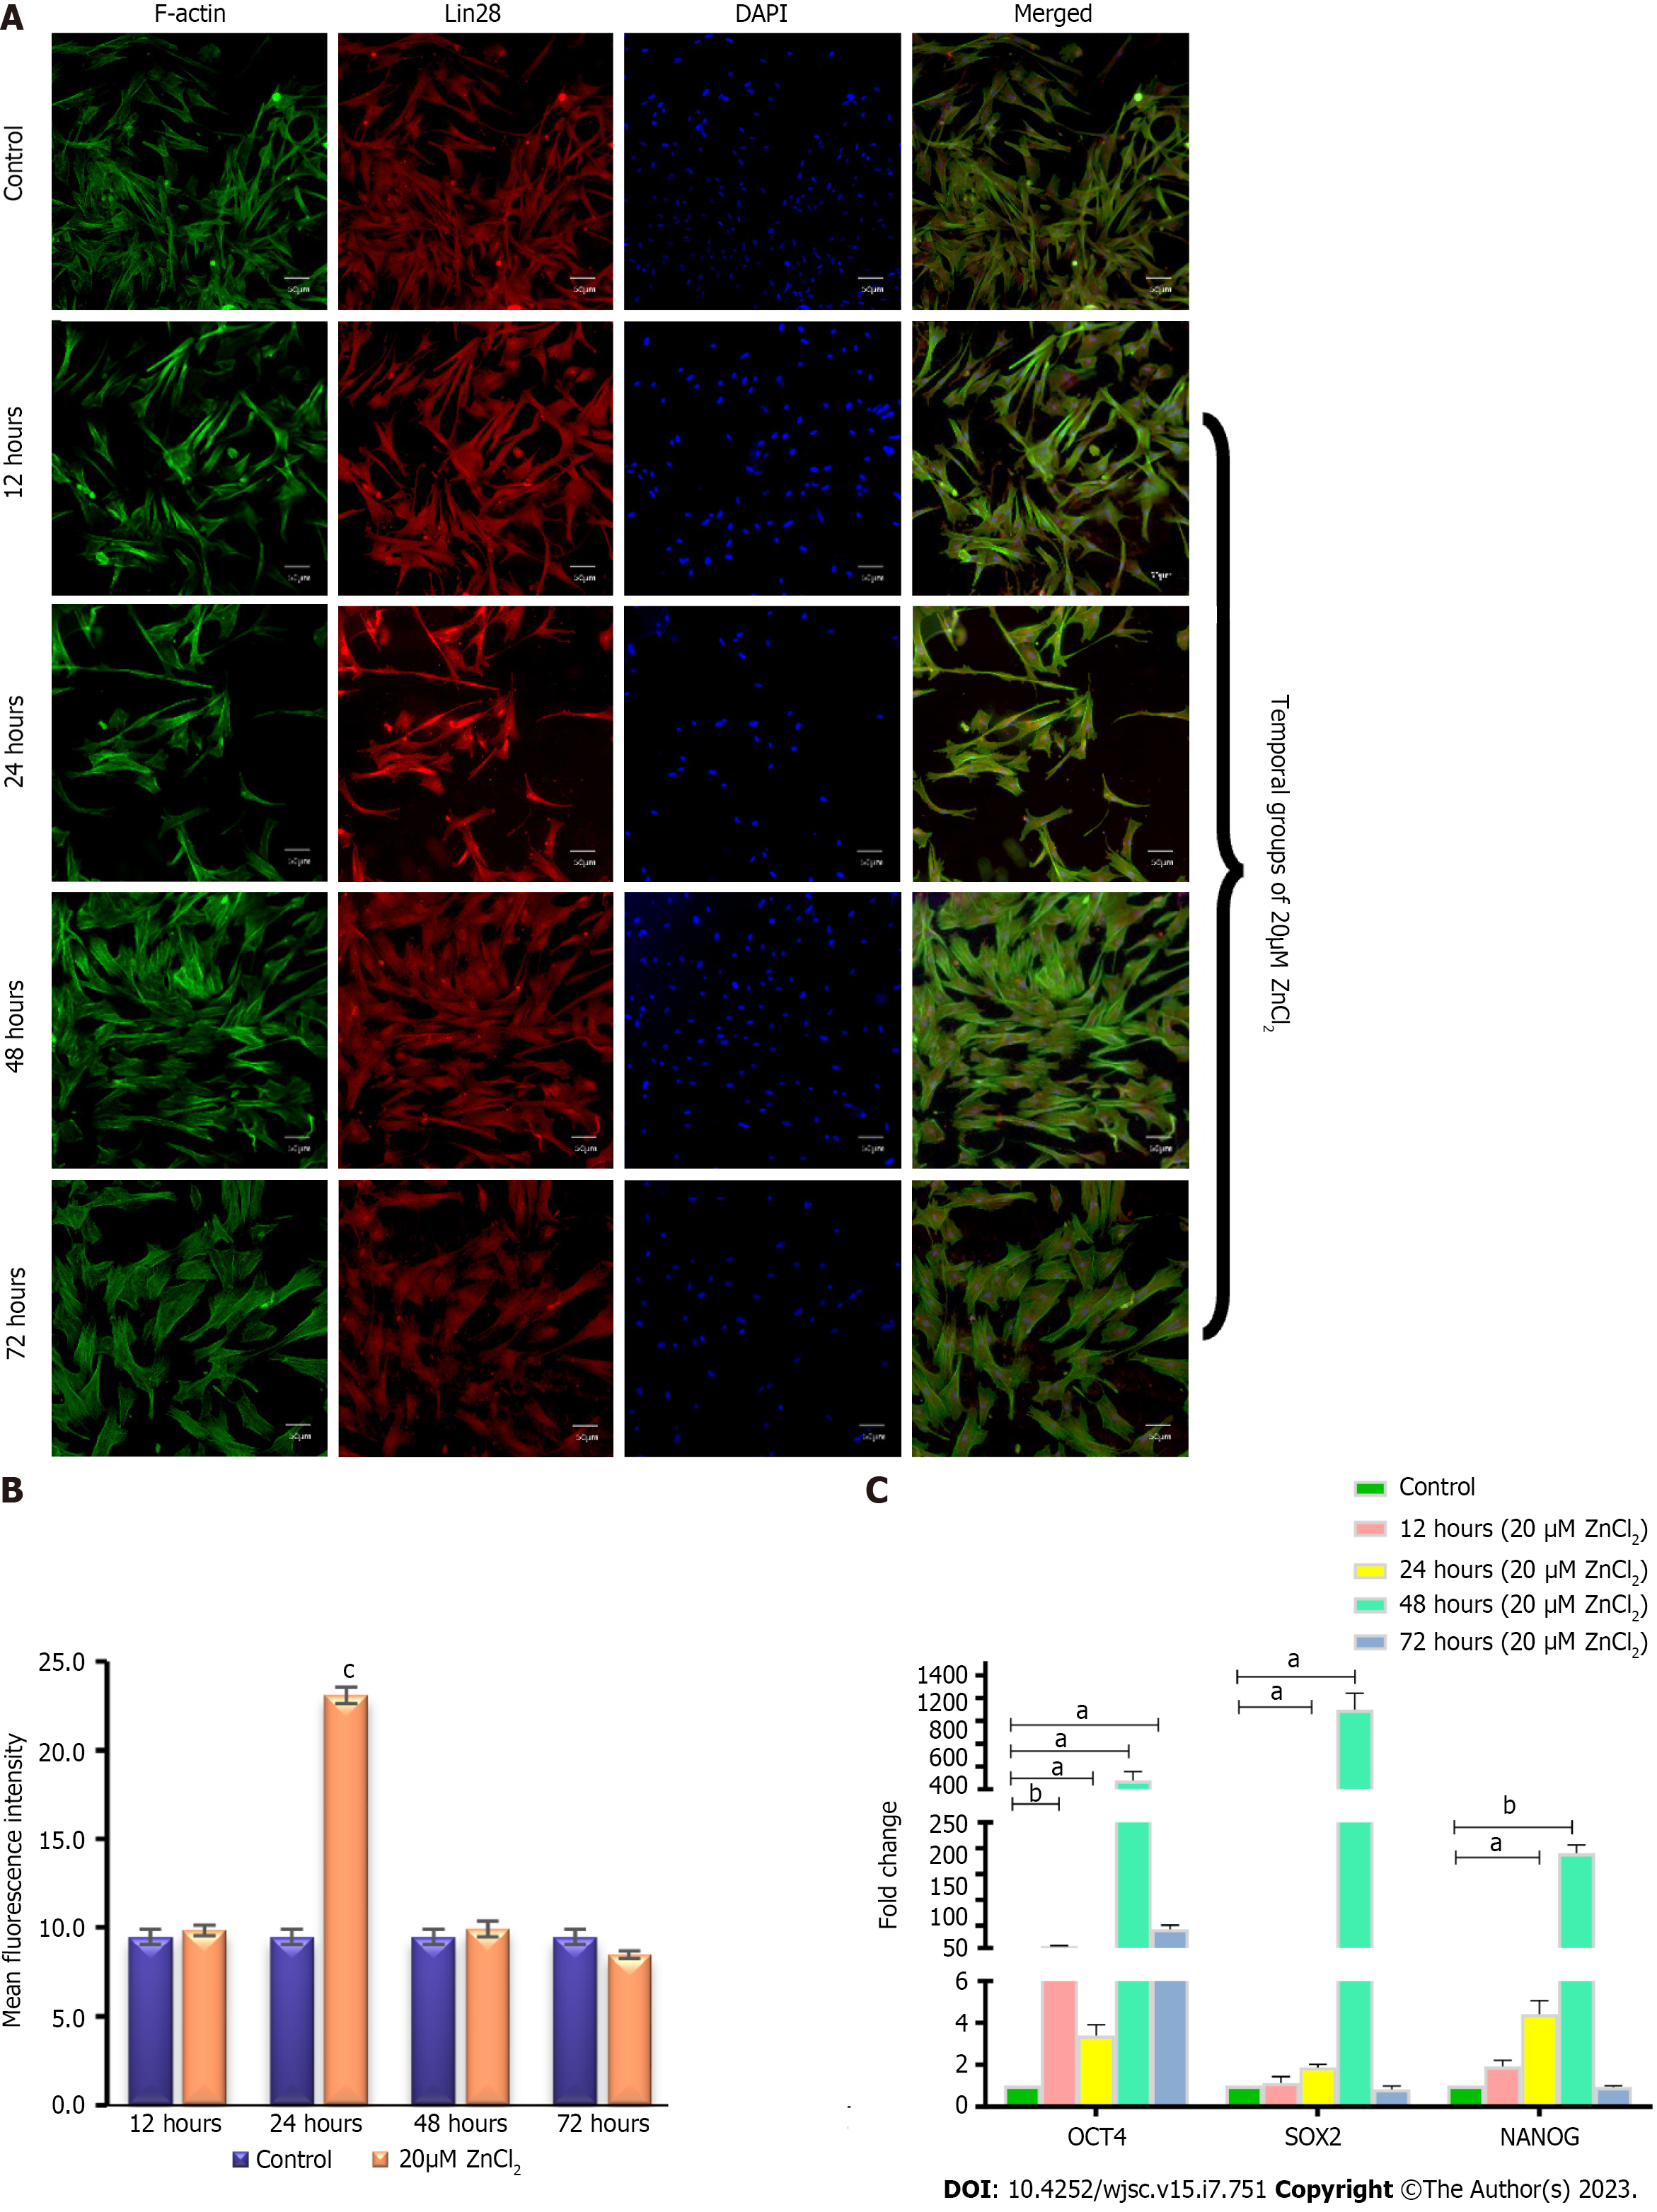
Figure 7 Protein expression of Lin28 and transcriptional analysis of pluripotency genes.
A: Positive expression of mesenchymal stem cells (MSCs) specific marker Lin28 was observed after 12 h, 24 h,48 h, and 72 h of 20 µM ZnCl2 treatment, as visualized by immunocytochemical staining; B: Quantified fluorescent intensities showed that 20 µM ZnCl2 treated MSCs expressed Lin28 protein (cP ≤ 0.001); C: Quantitative real-time polymerase chain reaction analysis of pluripotency genes OCT4, SOX2, and NANOG, exhibited significantly increased (aP ≤ 0.05) expression of OCT4 at 12, 24, 48, and 72 h, while SOX2, and NANOG showed significantly increased expression at 24 and 48 h (aP ≤ 0.05, bp ≤ 0.01). Results were analyzed by SPSS, performing an independent sample t-test. Data were analyzed as mean ± SD (n = 3) where significance level aP ≤ 0.05.
- Citation: Sahibdad I, Khalid S, Chaudhry GR, Salim A, Begum S, Khan I. Zinc enhances the cell adhesion, migration, and self-renewal potential of human umbilical cord derived mesenchymal stem cells. World J Stem Cells 2023; 15(7): 751-767
- URL: https://www.wjgnet.com/1948-0210/full/v15/i7/751.htm
- DOI: https://dx.doi.org/10.4252/wjsc.v15.i7.751


