Copyright
©The Author(s) 2023.
World J Stem Cells. Jul 26, 2023; 15(7): 734-750
Published online Jul 26, 2023. doi: 10.4252/wjsc.v15.i7.734
Published online Jul 26, 2023. doi: 10.4252/wjsc.v15.i7.734
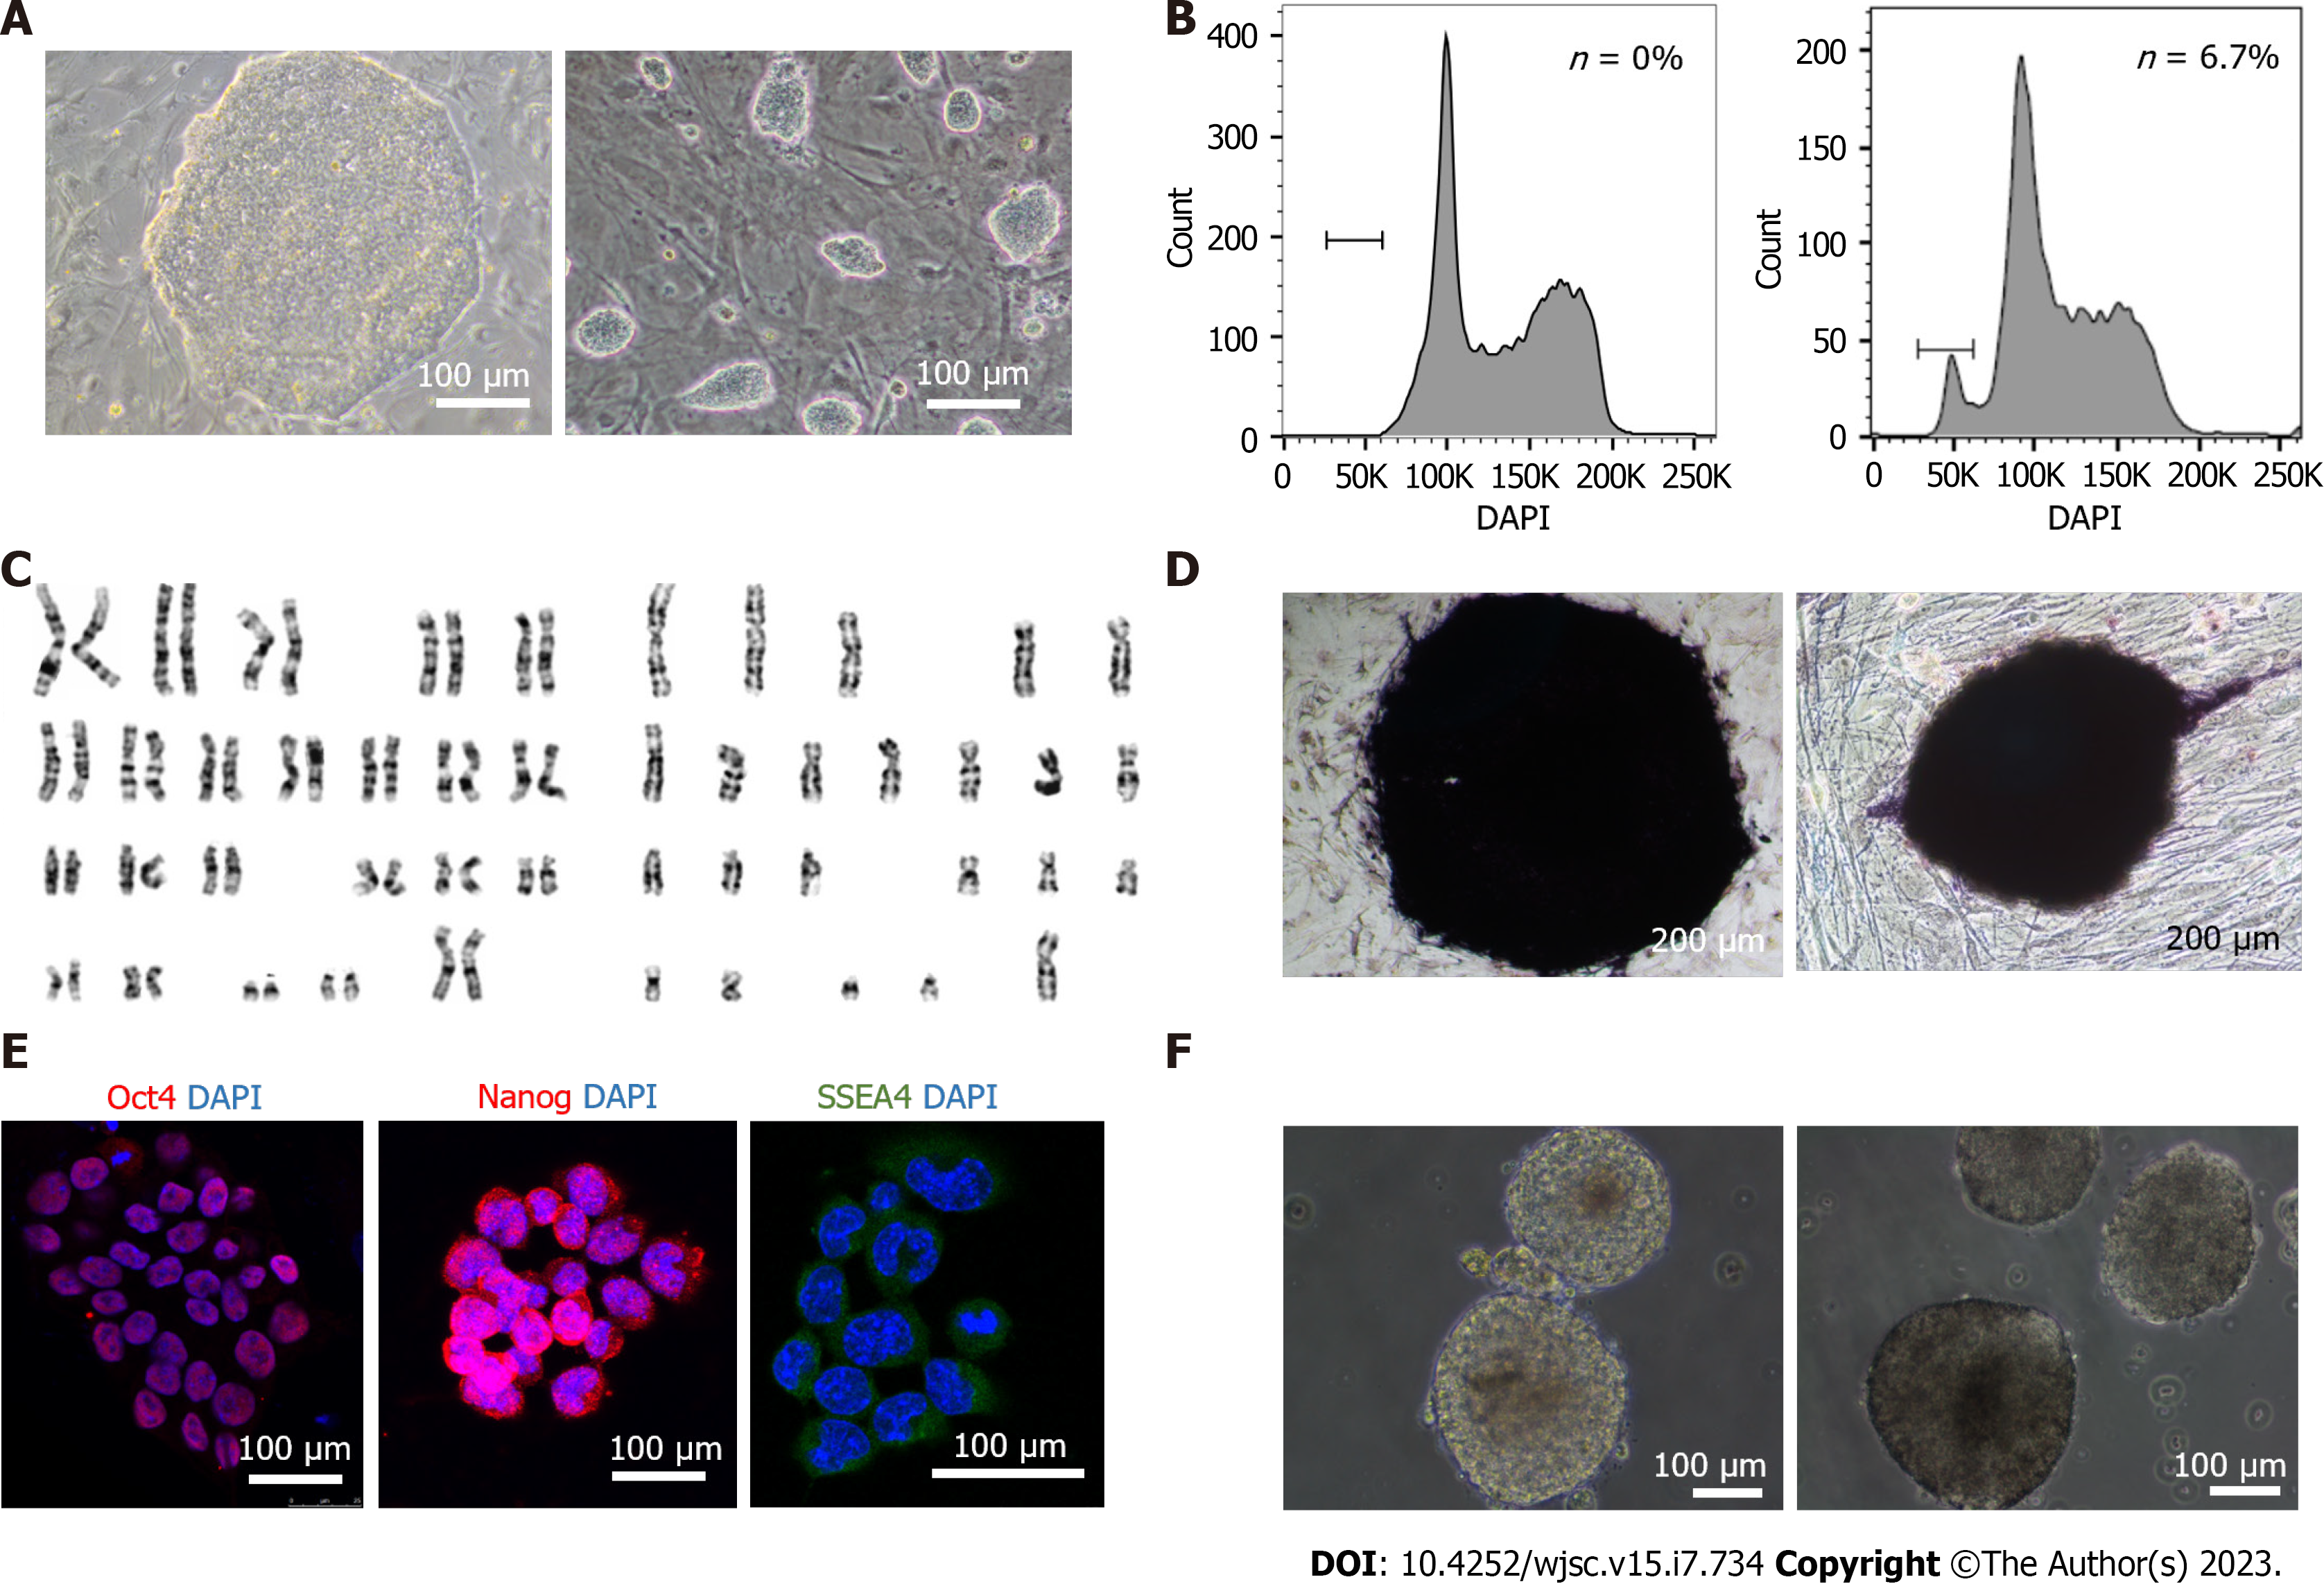
Figure 1 Characterization of the pluripotency and haploidy of extended pluripotent human haploid embryonic stem cells.
A: The human diploid embryonic stem cell (ESC) line H9 (left) was used as a control for extended human haploid ESCs (haESC) (right). Scale bar, 100 μm; B: Fluorescence activated cell sorting analysis of the DNA content of the human haESC line hPGES1 after approximately 6 wk of culture, without sorting. Left, diploid ESC line as a control; Right, haploid cell line EhPGES1. The “n” peak represents haploid cells; C: G-band analysis of the EhPGES1 cell line with a haploid set of 23 chromosomes (right) and diploid human ESCs as a control (46 chromosomes, left); D: Alkaline phosphatase staining of the human haESC line EhPGES1 (right) and diploid human ESCs as a control (left). Scale bar, 200 μm; E: Immunofluorescence analysis of the primate ESC markers Oct4 (red), Nanog (green) and SSEA4 (green) in the human haESC line EhPGES1. DAPI (blue) was used to stain the nuclei. Scale bar, 100 μm; F: Morphology of embryoid bodies from haploid-enriched cells (right) and diploid human ESCs as a control (left). Scale bar, 100 μm.
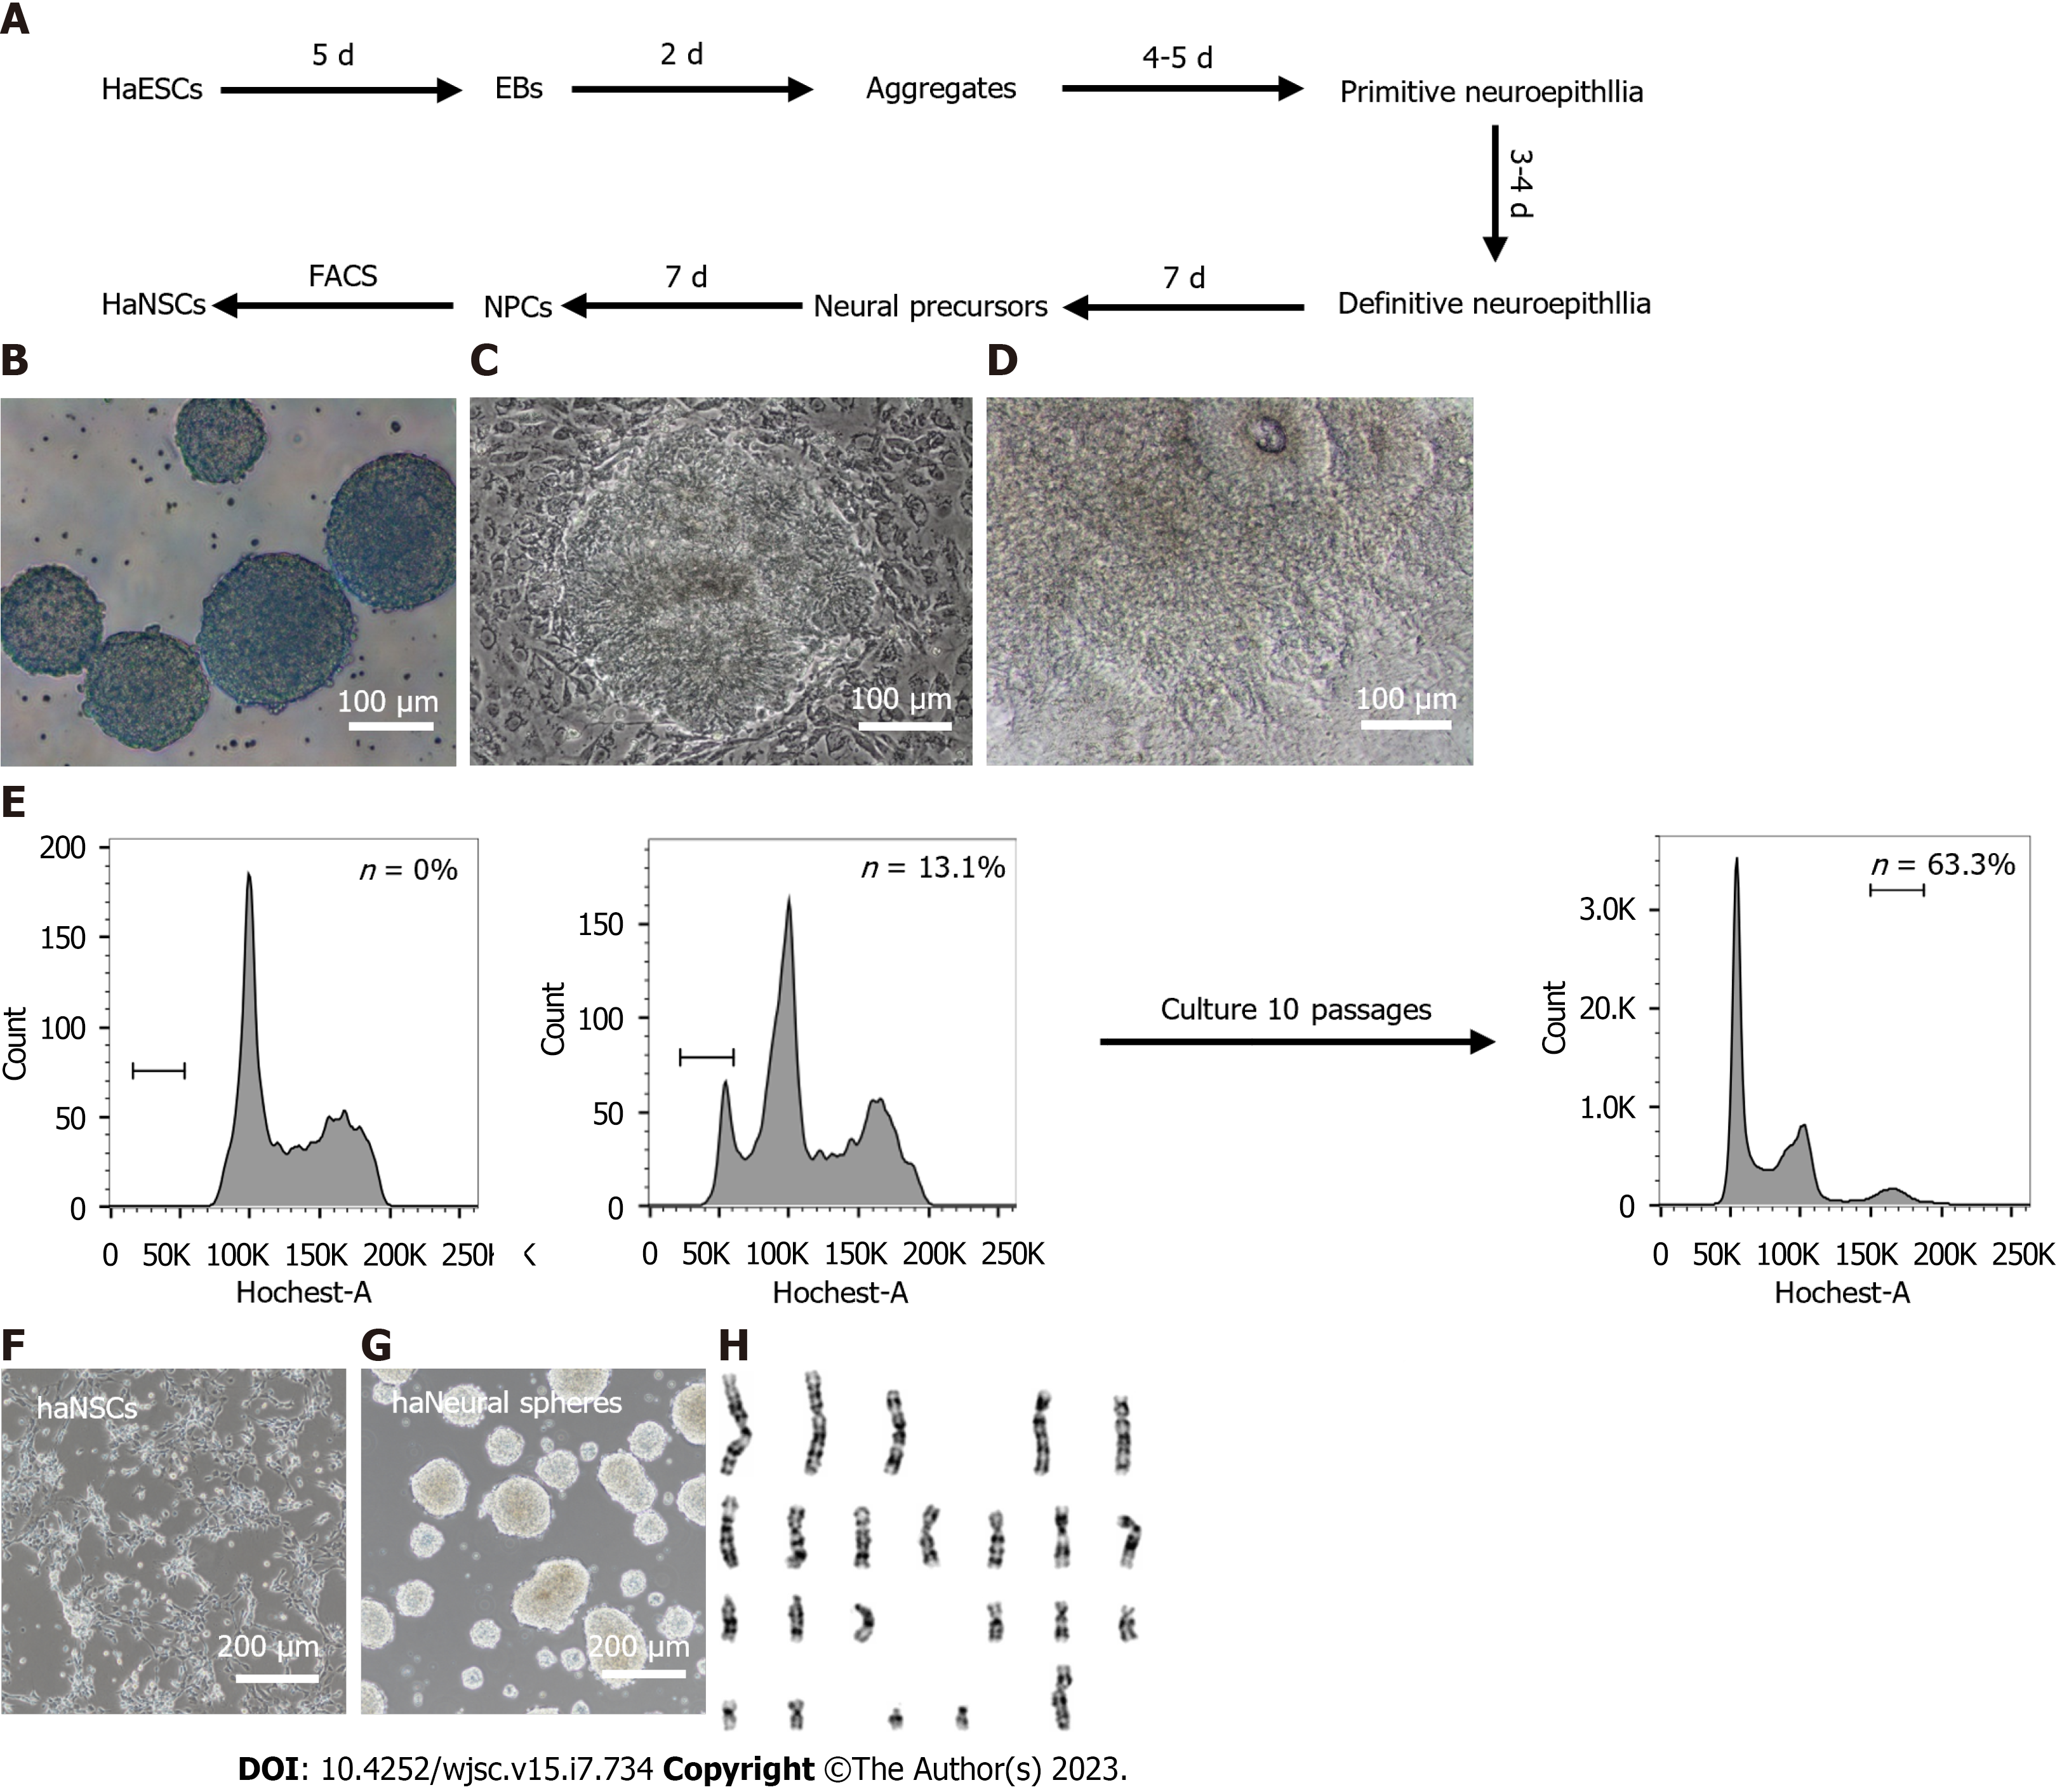
Figure 2 Derivation of human haploid neural stem cells via differentiation invitro.
A: Schematic overview of the strategy to efficiently derive haploid neural stem cell (haNSC) lines through embryoid body-mediated differentiation and fluorescence activated cell sorting; B: Morphology of 7-d aggregates. Scale bar, 100 μm; C: Morphology of primitive neuroepithelia. Dashed lines indicate the morphology of primitive neuroepithelia. Scale bar, 100 μm; D: Morphology of definitive neuroepithelia. Dashed lines indicate the morphology of definitive neuroepithelia. Scale bar, 100 μm; E: Fluorescence activated cell sorting of passage 4 human haNSCs and derived haNSCs maintained a haploid DNA content over 10 passages. Left, a diploid cell line as a control; middle, passage 4 haNSCs; right, derived haNSCs after 10; F: Morphology of sorted haNSCs. Scale bar, 200 μm; G: Morphology of haploid neural spheres from sorted haNSCs. Scale bar, 200 μm; H: G-band analysis of haNSCs with a haploid set of 23 chromosomes. haNSCs: Haploid neural stem cell; haESCs: Haploid embryonic stem cells; FACS: Fluorescence activated cell sorting; EB: Embryoid body; NPC: Neural progenitor cells.
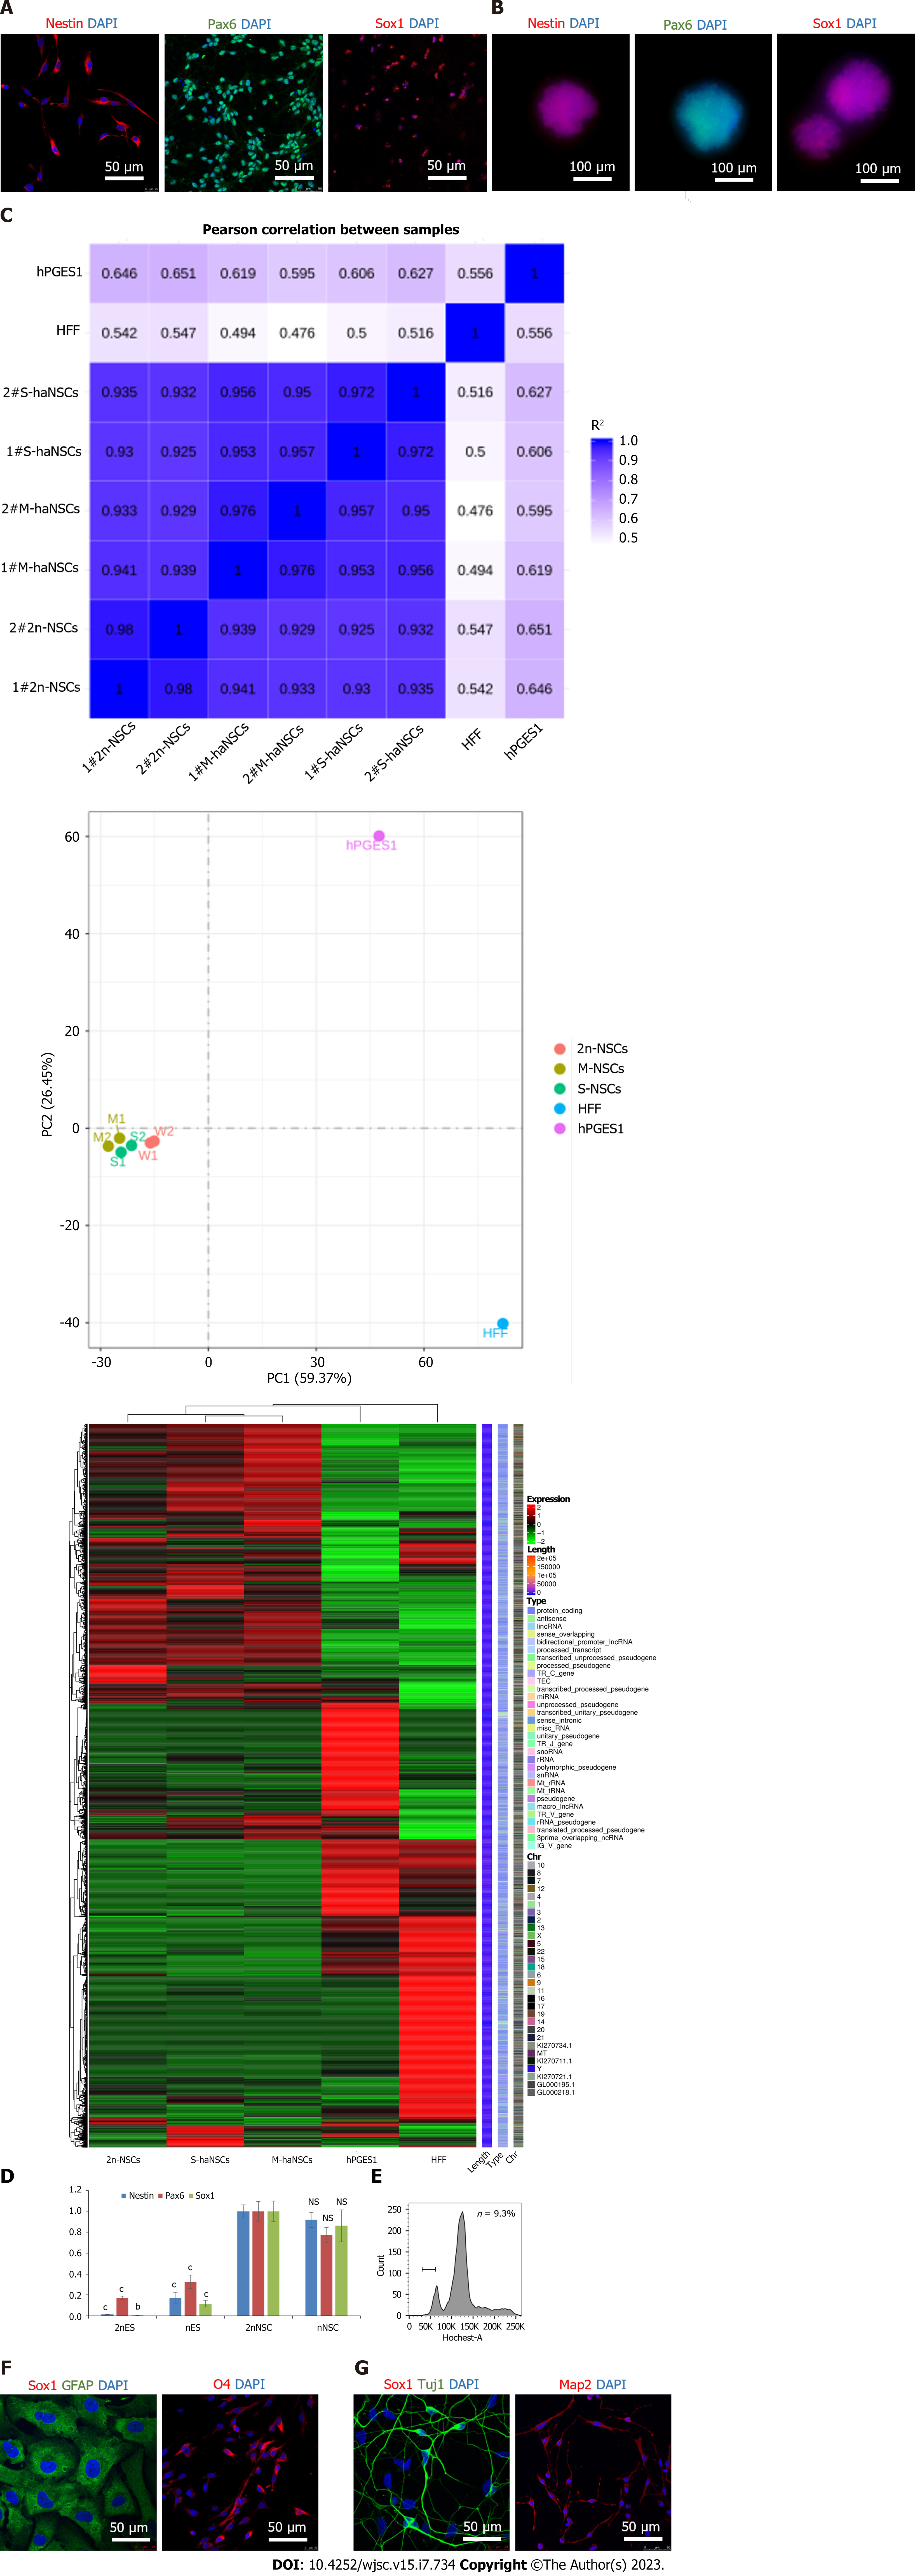
Figure 3 Identification and differentiation of haploid neural stem cells.
A: Immunofluorescence analysis of the neural stem cell (NSC)-specific markers Nestin (red), PAX6 (green), and SOX1 (red) in derived haploid NSCs (haNSCs). DAPI (blue) was used to stain the nuclei. Scale bar, 50 μm; B: Immunofluorescence analysis showed that haploid neural spheres expressed NSC-specific proteins Nestin (red), PAX6 (green) and SOX1 (red). Scale bar, 100 μm; C: Transcript levels of diploid NSCs, monolayer cultured haNSCs, haploid neural spheres, human haploid embryonic stem cells (hPGES1) and human fibroblasts; D: Real time PCR analysis of NSC marker genes (SOX1, PAX6, and Nestin); E: Fluorescence activated cell sorting of derived astrocytes, oligodendrocytes, and neurons by DNA content; F: Immunofluorescence analysis of astrocytes (GFAP, green) and oligodendroglia (O4, red). DAPI (blue) was used to stain the nuclei. Scale bar, 50 μm; G: Immunofluorescence analysis of Tuj1 (green) and Map2 (red) in neurons derived from haNSCs. DAPI (blue) was used to stain the nuclei. Scale bar, 50 μm. bP < 0.01; cP < 0.001.
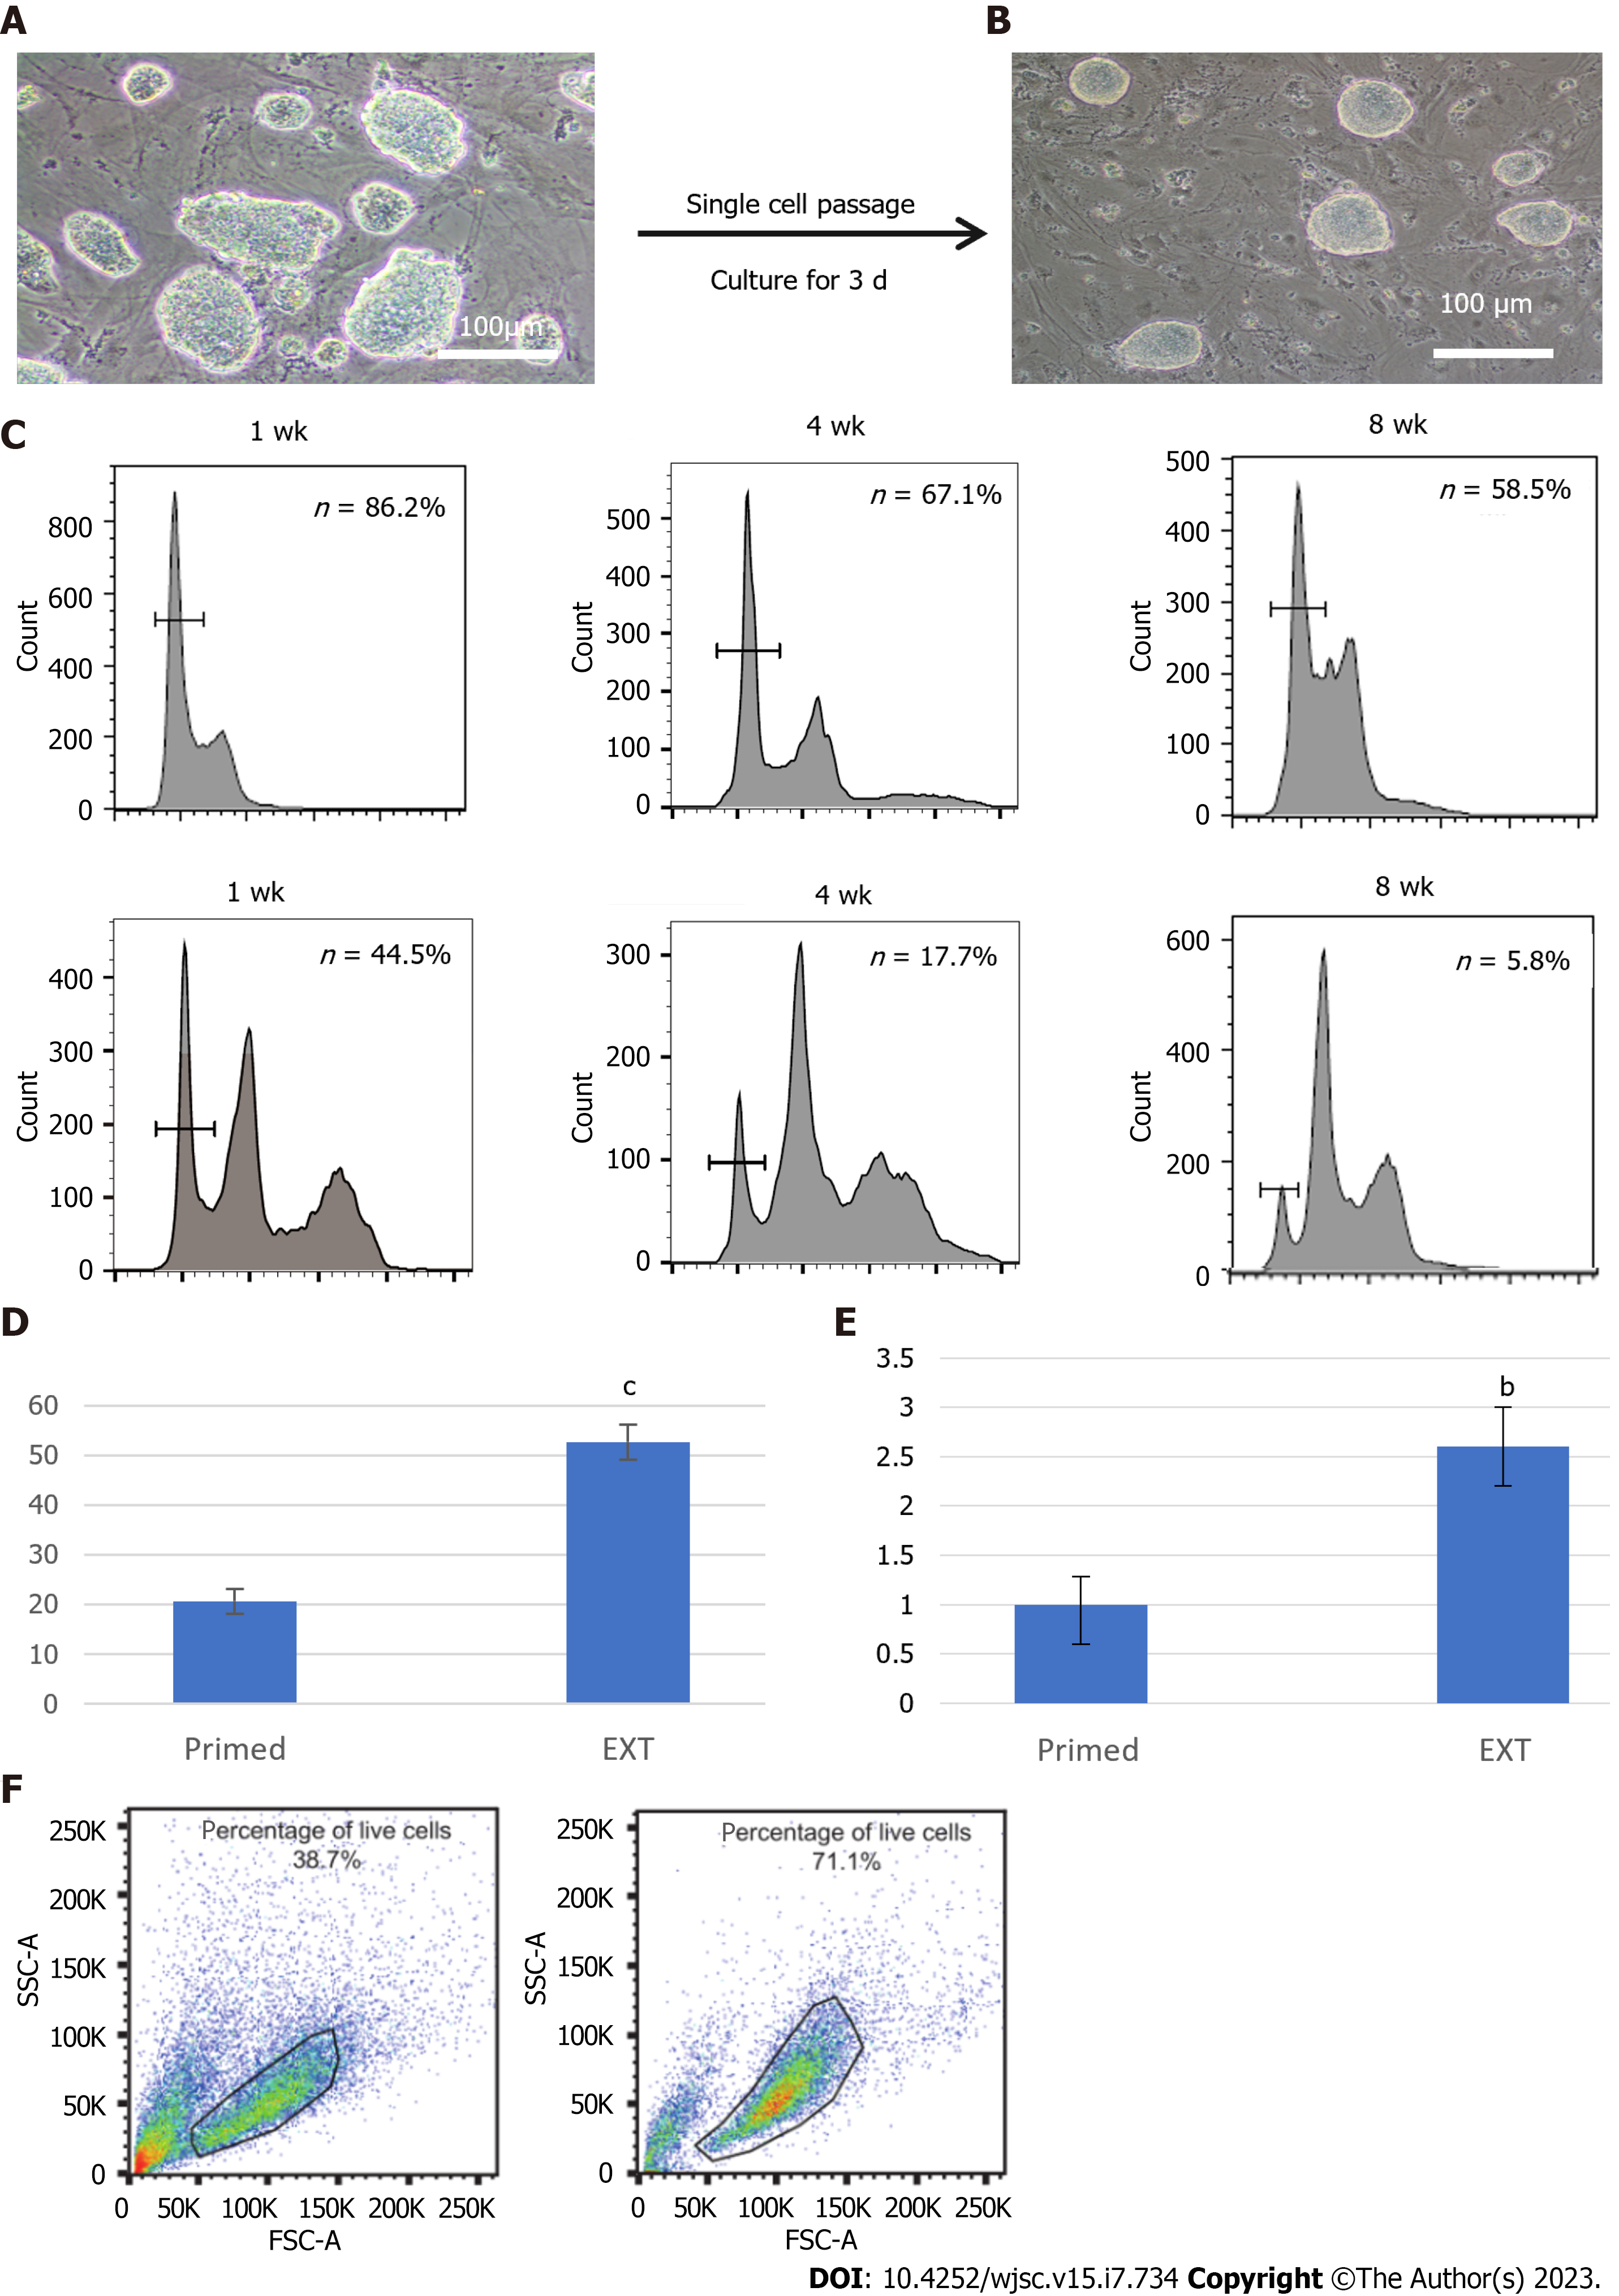
Figure 4 Comparison of pluripotency and survival of haploid embryonic stem cells in different culture media.
A: EhPGES1 formed dome-shaped colonies after culture in optimized extended medium for approximately three passages. Scale bar, 100 μm; B: Morphology of day 3 optimized hPGES1 after single cells were passaged by 0.05% trypsin-EDTA in the absence of Y27632. Scale bar, 100 μm; C: Fluorescence activated cell sorting analysis of haploid embryonic stem cells after culture for 1 wk, 4 wk, and 8 wk in different media. Haploidy maintenance capacity between the traditional (bottom) and optimized (top) culture media; D: Statistical analysis of embryoid bodies (differentiation in 5 d) under traditional culture conditions and optimized culture conditions. t-test, cP < 0.001; E: Statistical analysis of rosette areas in traditional culture conditions and optimized culture conditions. t-test, bP < 0.01; F: Fluorescence activated cell sorting analysis of the proportion of live cells among haploid neural stem cells in different culture media as evaluated by forward scatter plot and side scatter plot. Traditional culture system (left) and optimized culture system (right).
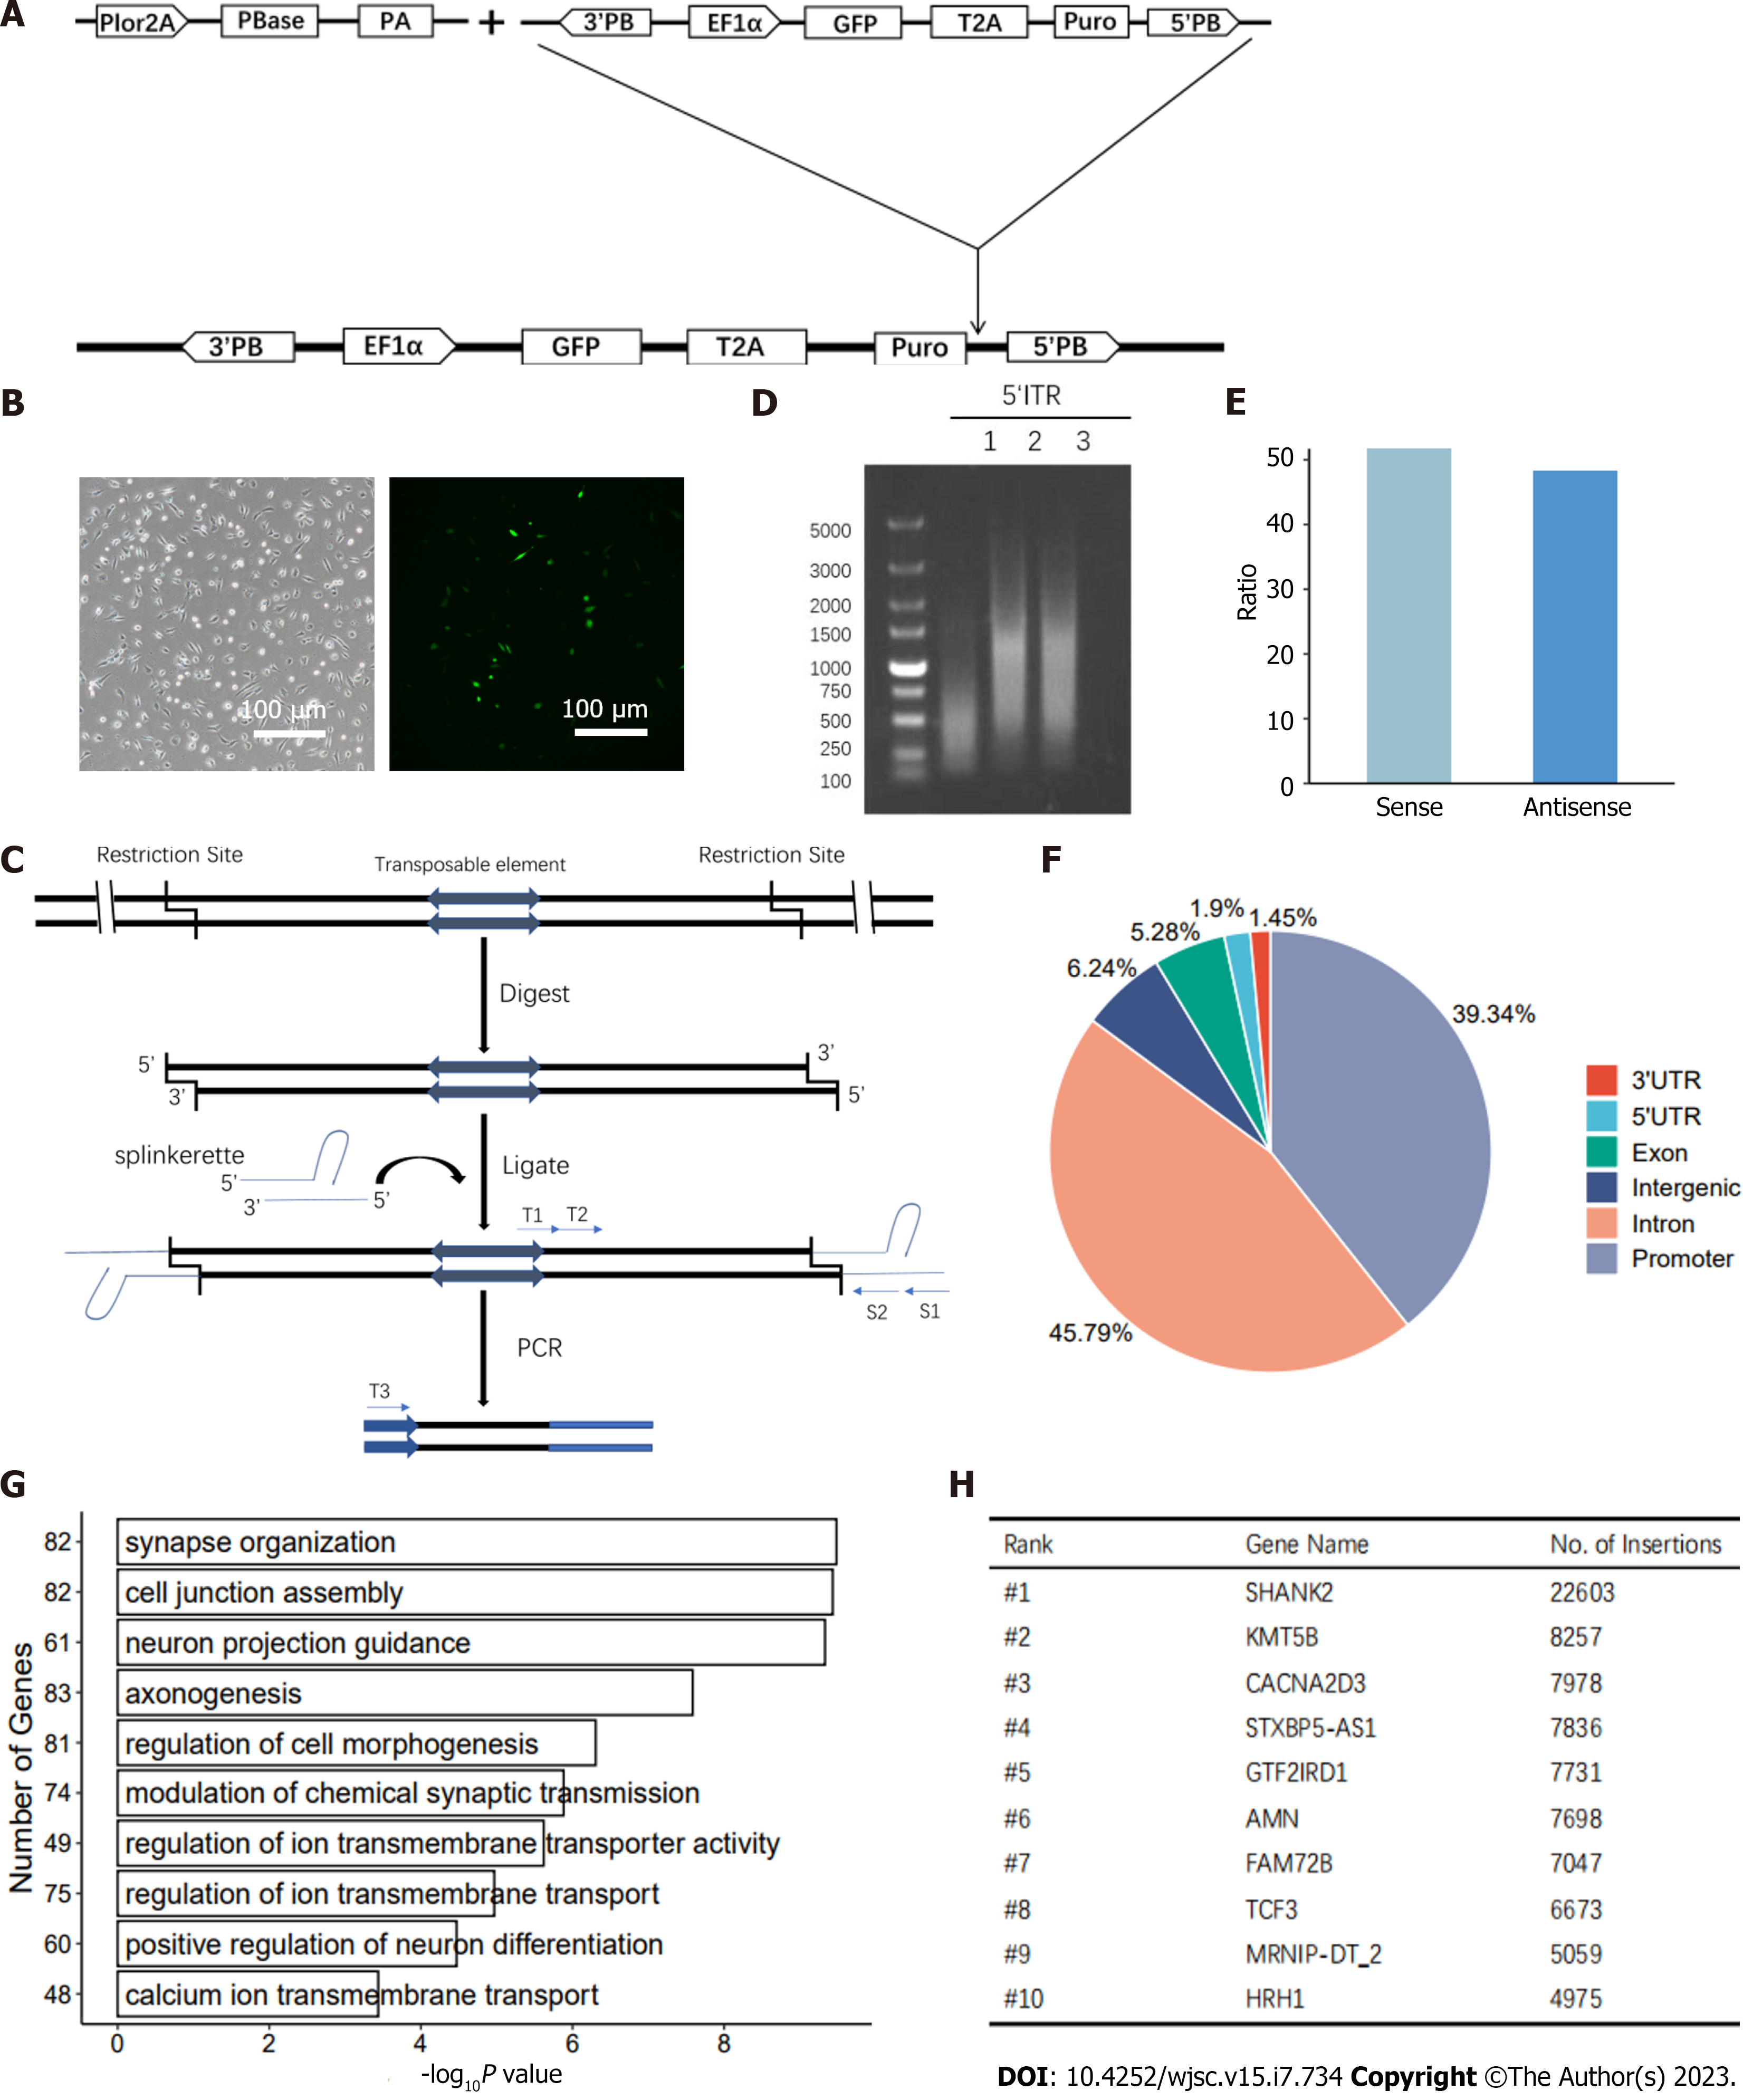
Figure 5 PiggyBac transgenesis in the derived haploid neural stem cells.
A: Schematic overview of PiggyBac (PB) insertion. PB transposons were inserted into the genomes of derived haploid neural stem cells (haNSCs) with the help of PBase; B: Bright field (left) and FITC (right) images of haNSCs after transfection. Scale bar, 100 μm; C: Schematic of the splinkerette PCR. 5’ and 3’ PB-void BstYI was used to digest genomic DNA from derived haNSCs, and T4 DNA ligase was used to form the LEFT and RIGHT cycle. After ligation, the insertion sites were verified by two rounds of nested PCR. The primers are shown as black arrows and listed in Supplementary Table 1; D: Agarose gel electrophoresis was used to analyze the 5’ inverted terminal repeat PCR products harvested from transgenic haNSCs; E: Illustration of the sense and antisense; F: Distribution of insertion sites in the genome; G: Gene Ontology enrichment analysis; H: Top 10 most frequently inserted genes in the PB transposon-based mutagenesis.
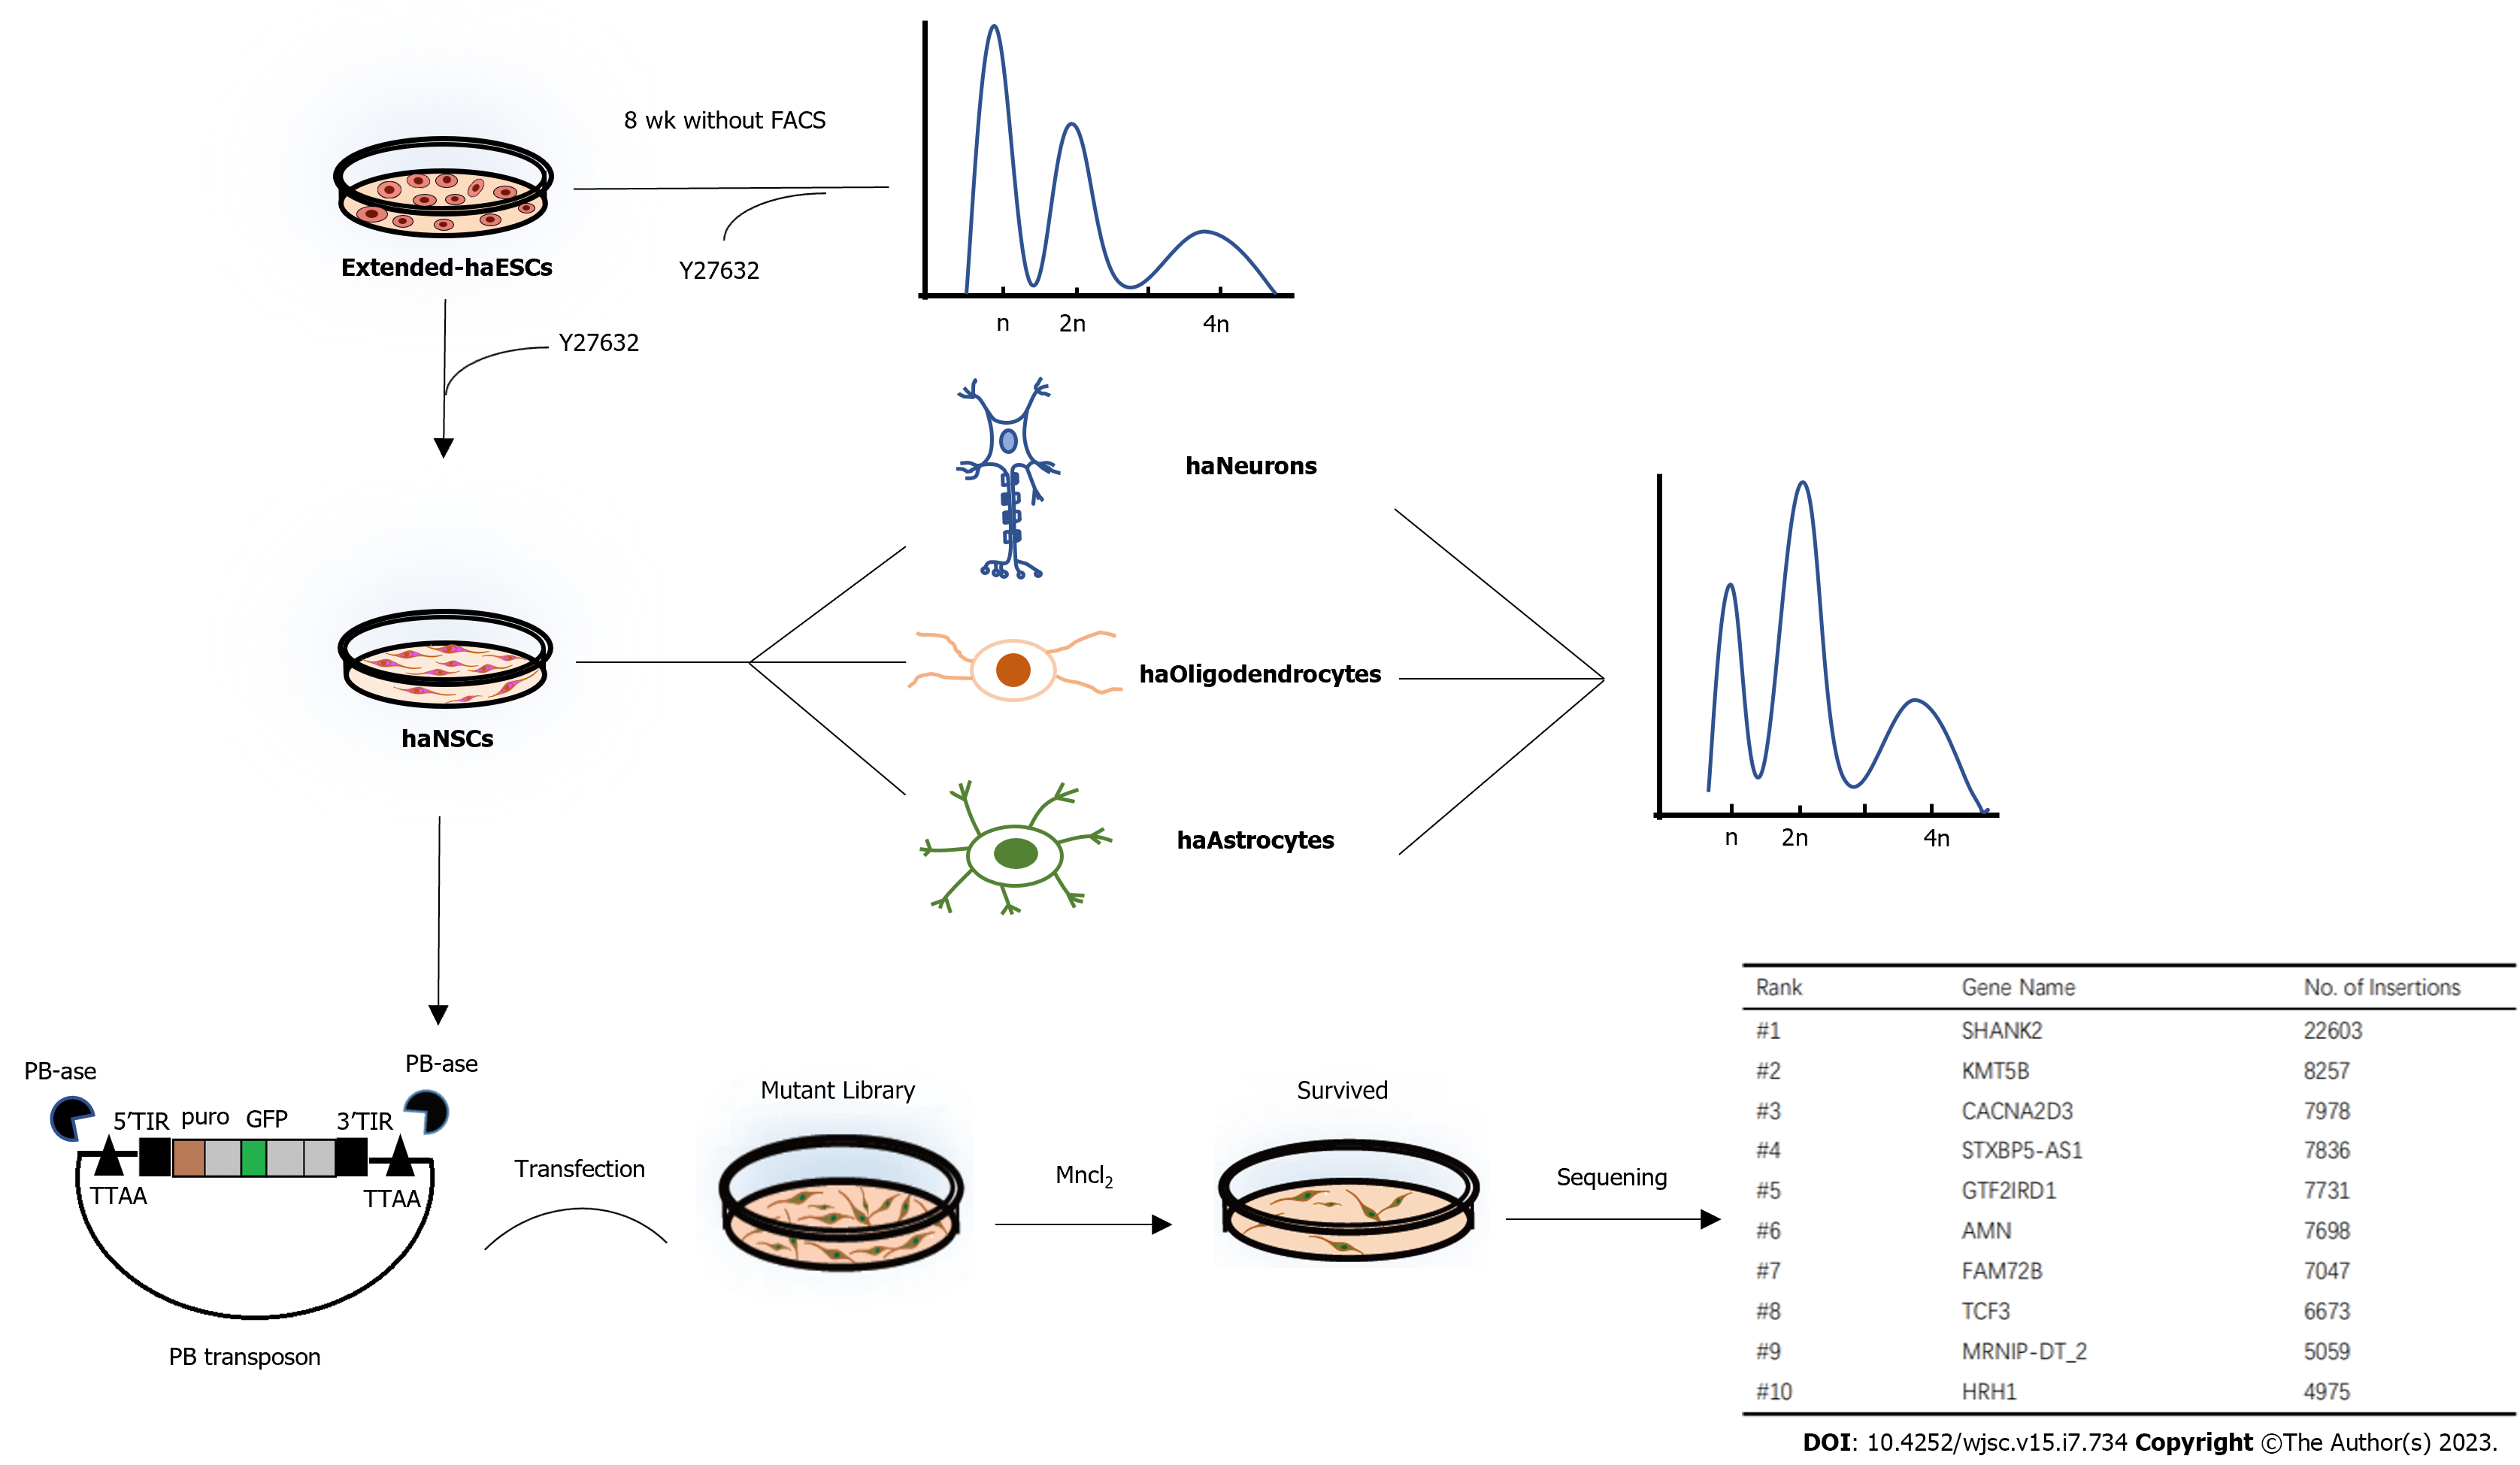
Figure 6 Summary graph for this research.
Results show that human haploid embryonic stem cells cultured in optimized medium can stably maintain haploidy state and easily generate functional haploid neural stem cells with the help of Y27632 (ROCKi), thus contributing to human lineage-specific genetic screening. At last, we get a gene list relate to Mn2+-induced toxicity with the help of this haploid cell line. FACS: Fluorescence activated cell sorting.
- Citation: Wang HS, Ma XR, Niu WB, Shi H, Liu YD, Ma NZ, Zhang N, Jiang ZW, Sun YP. Generation of a human haploid neural stem cell line for genome-wide genetic screening. World J Stem Cells 2023; 15(7): 734-750
- URL: https://www.wjgnet.com/1948-0210/full/v15/i7/734.htm
- DOI: https://dx.doi.org/10.4252/wjsc.v15.i7.734


