Copyright
©The Author(s) 2023.
World J Stem Cells. Nov 26, 2023; 15(11): 999-1016
Published online Nov 26, 2023. doi: 10.4252/wjsc.v15.i11.999
Published online Nov 26, 2023. doi: 10.4252/wjsc.v15.i11.999
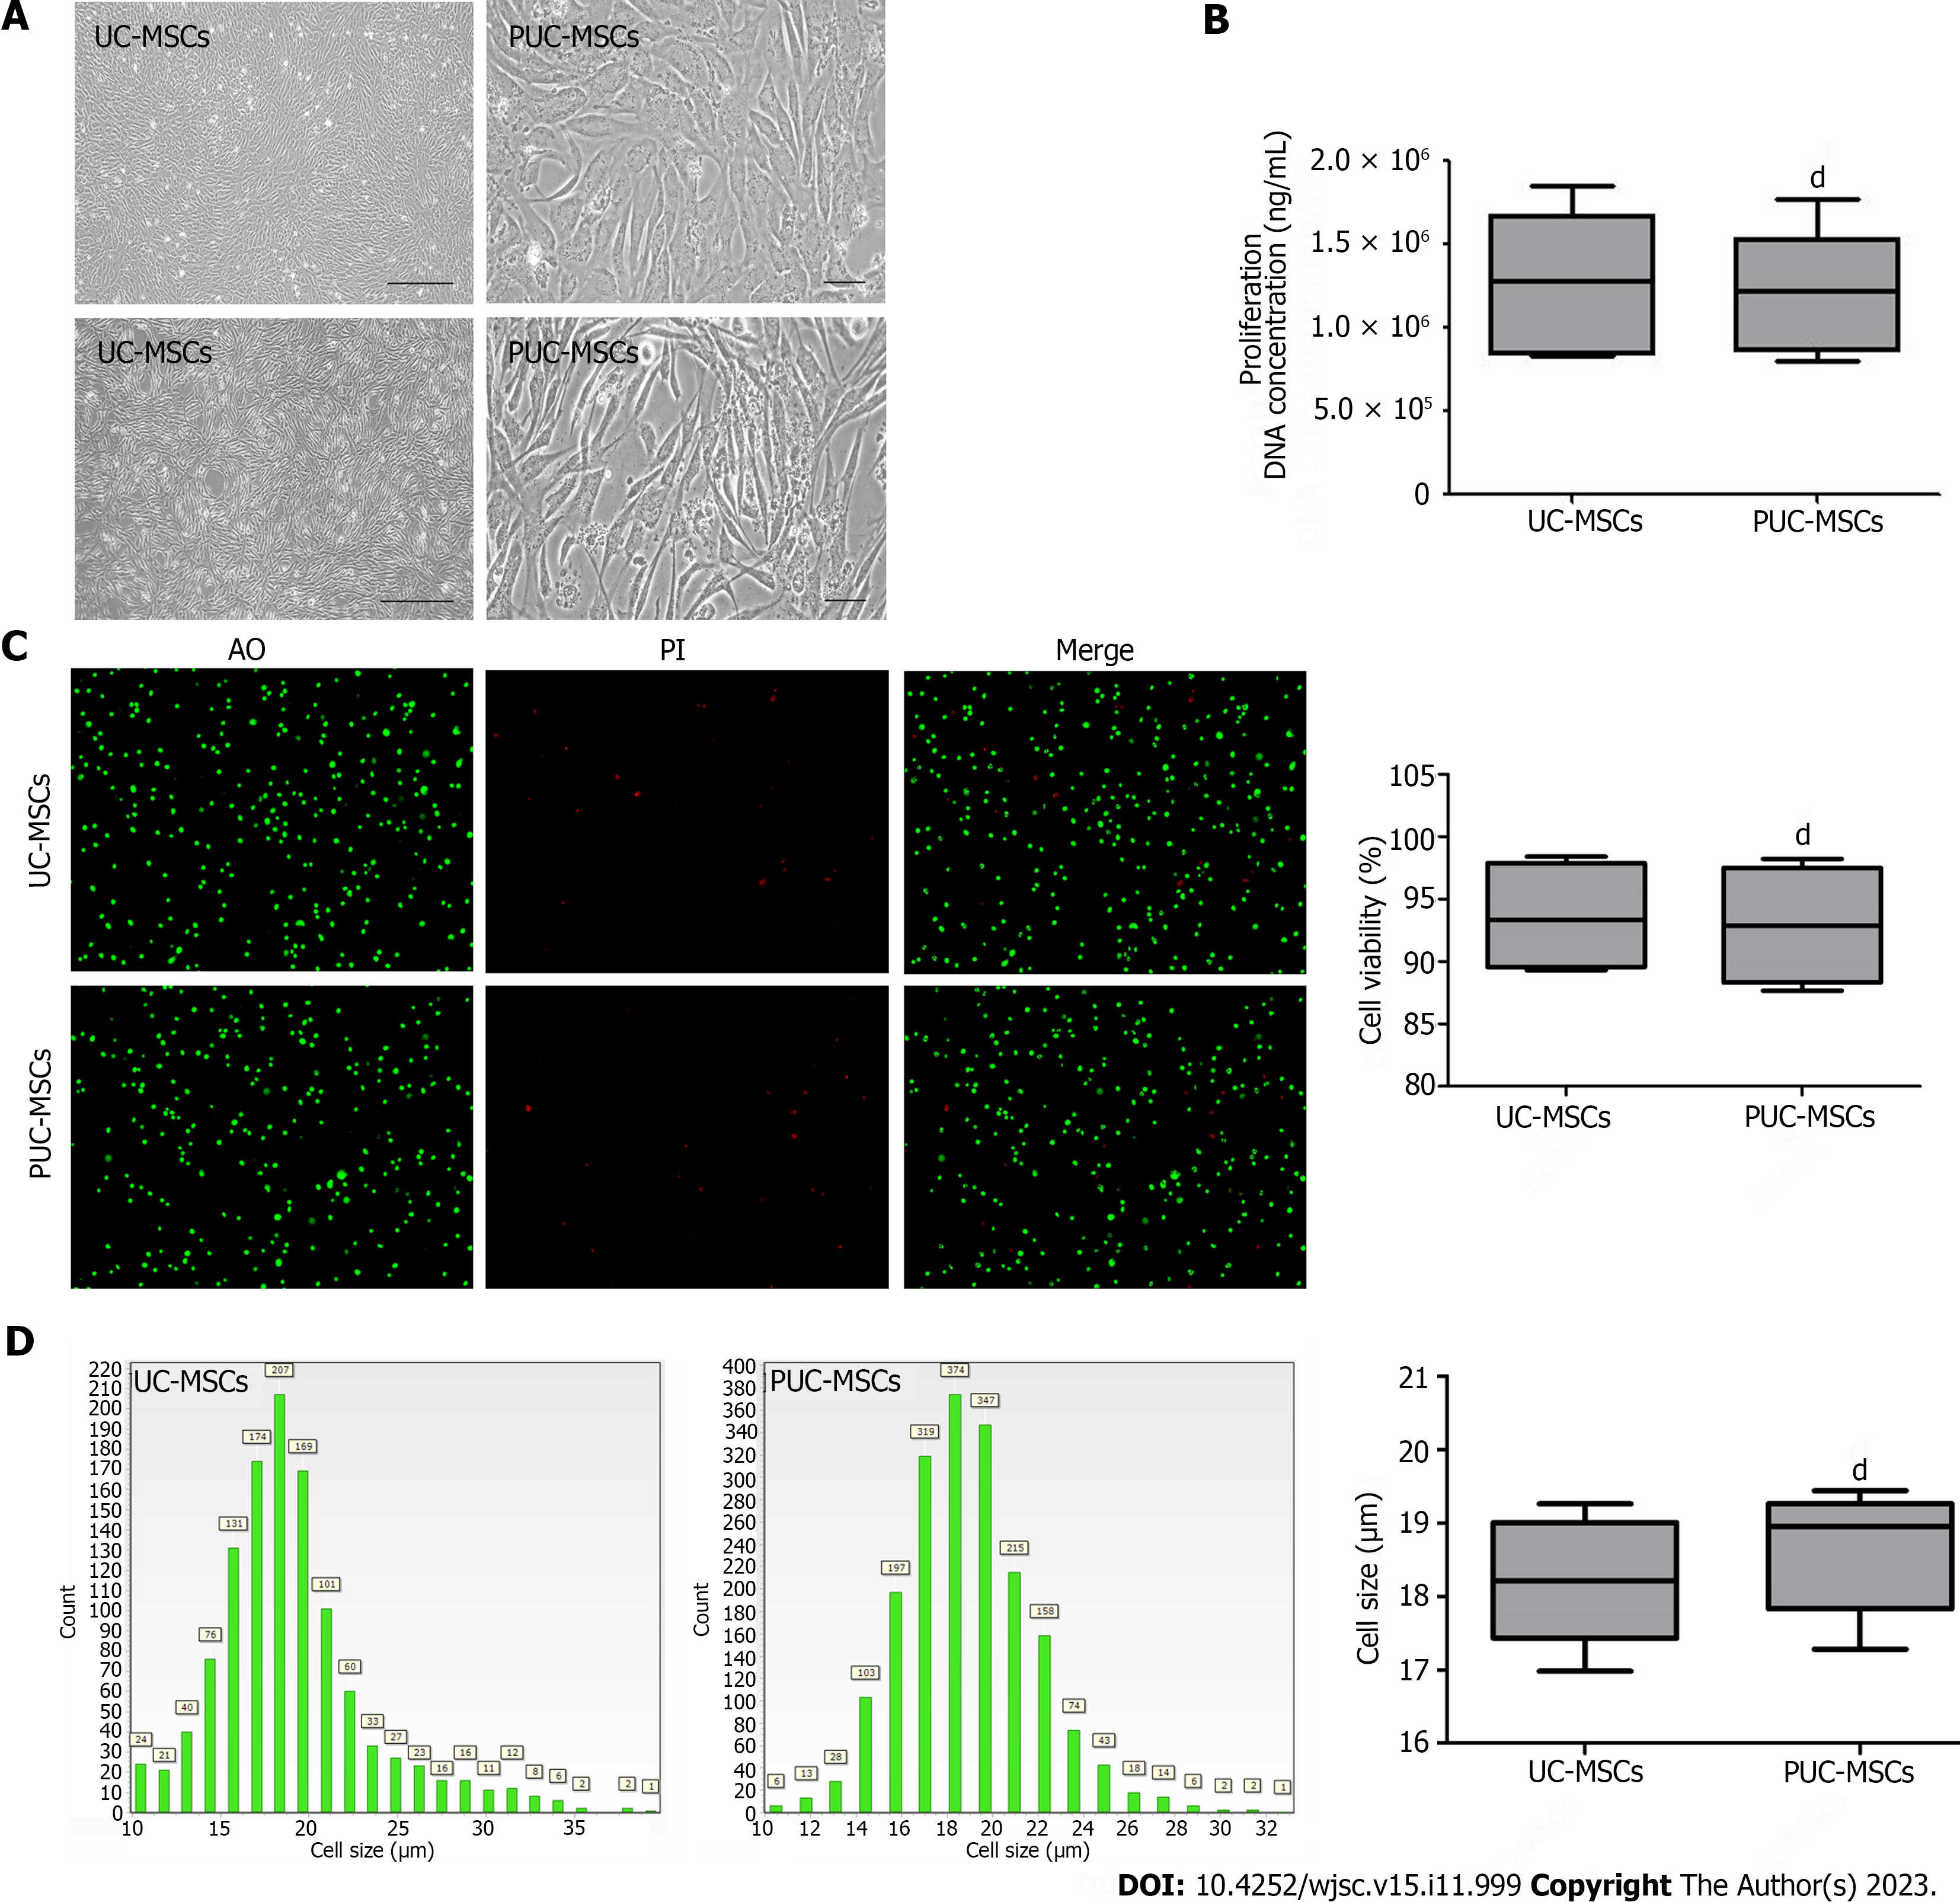
Figure 1 Morphology, viability, proliferation, and size of mesenchymal stem cells.
A: Representative micrographs showing umbilical cord mesenchymal stem cells (UC-MSCs) and primed umbilical cord mesenchymal stem cells (PUC-MSCs). Microscopy observation of cell morphology revealed that UC-MSCs were elongated after hypoxia and inflammatory factor pretreatment (Bar = 200 μm); B: The DNA concentration was measured by an ultramicro nucleic acid protein detector. The DNA concentration of PUC-MSCs was not significantly different from that of UC-MSCs, and pretreatment had no effect on their proliferation; C: Cell viability was determined by an acridine orange (AO) propidium iodide (PI) staining cell image analyzer, and no significant difference between UC-MSCs and PUC-MSCs was observed; D: Cell size was determined with a cell imaging analyzer, and the sizes of the UC-MSCs and PUC-MSCs were comparable. dP > 0.05.
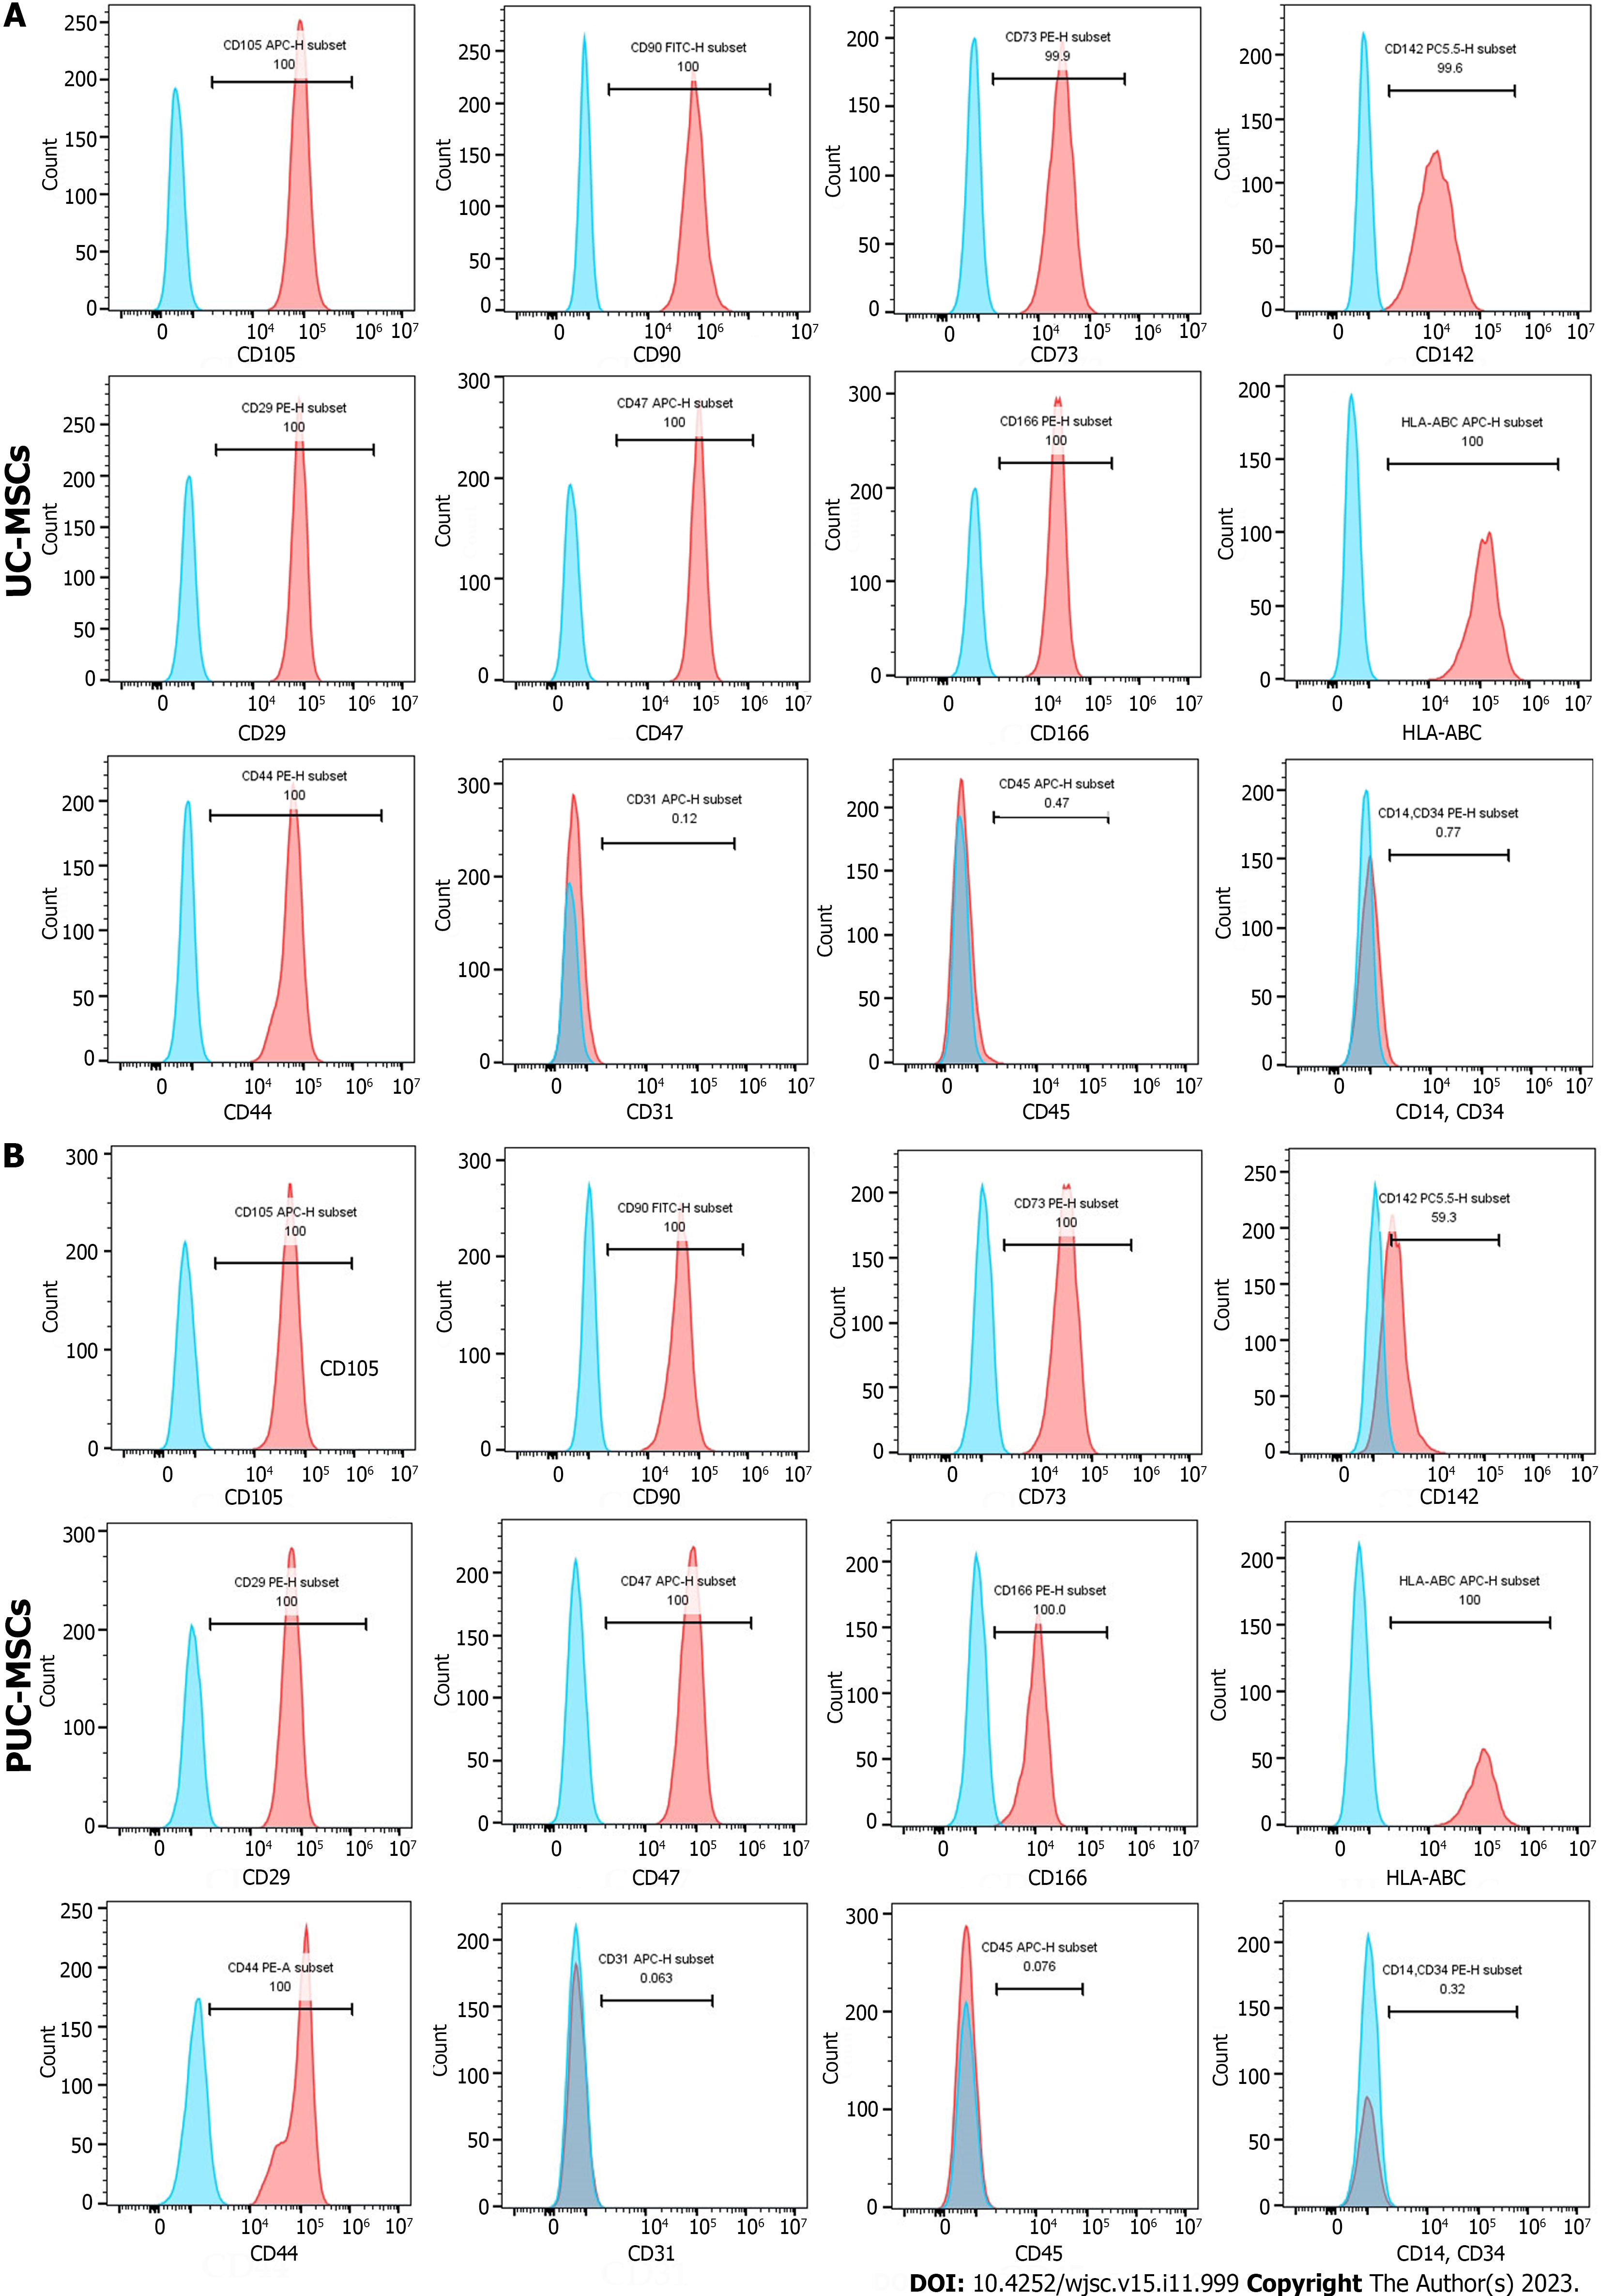
Figure 2 Phenotypes of mesenchymal stem cells were detected by flow cytometry.
A: Cell surface markers of umbilical cord mesenchymal stem cells (UC-MSCs); B: Cell surface markers of primed umbilical cord mesenchymal stem cells (PUC-MSCs). The signals from the unstained control cells are shown in blue in the histogram, and the signals from stained cells are shown in red in the histogram. HLA: Human leukocyte antigen.
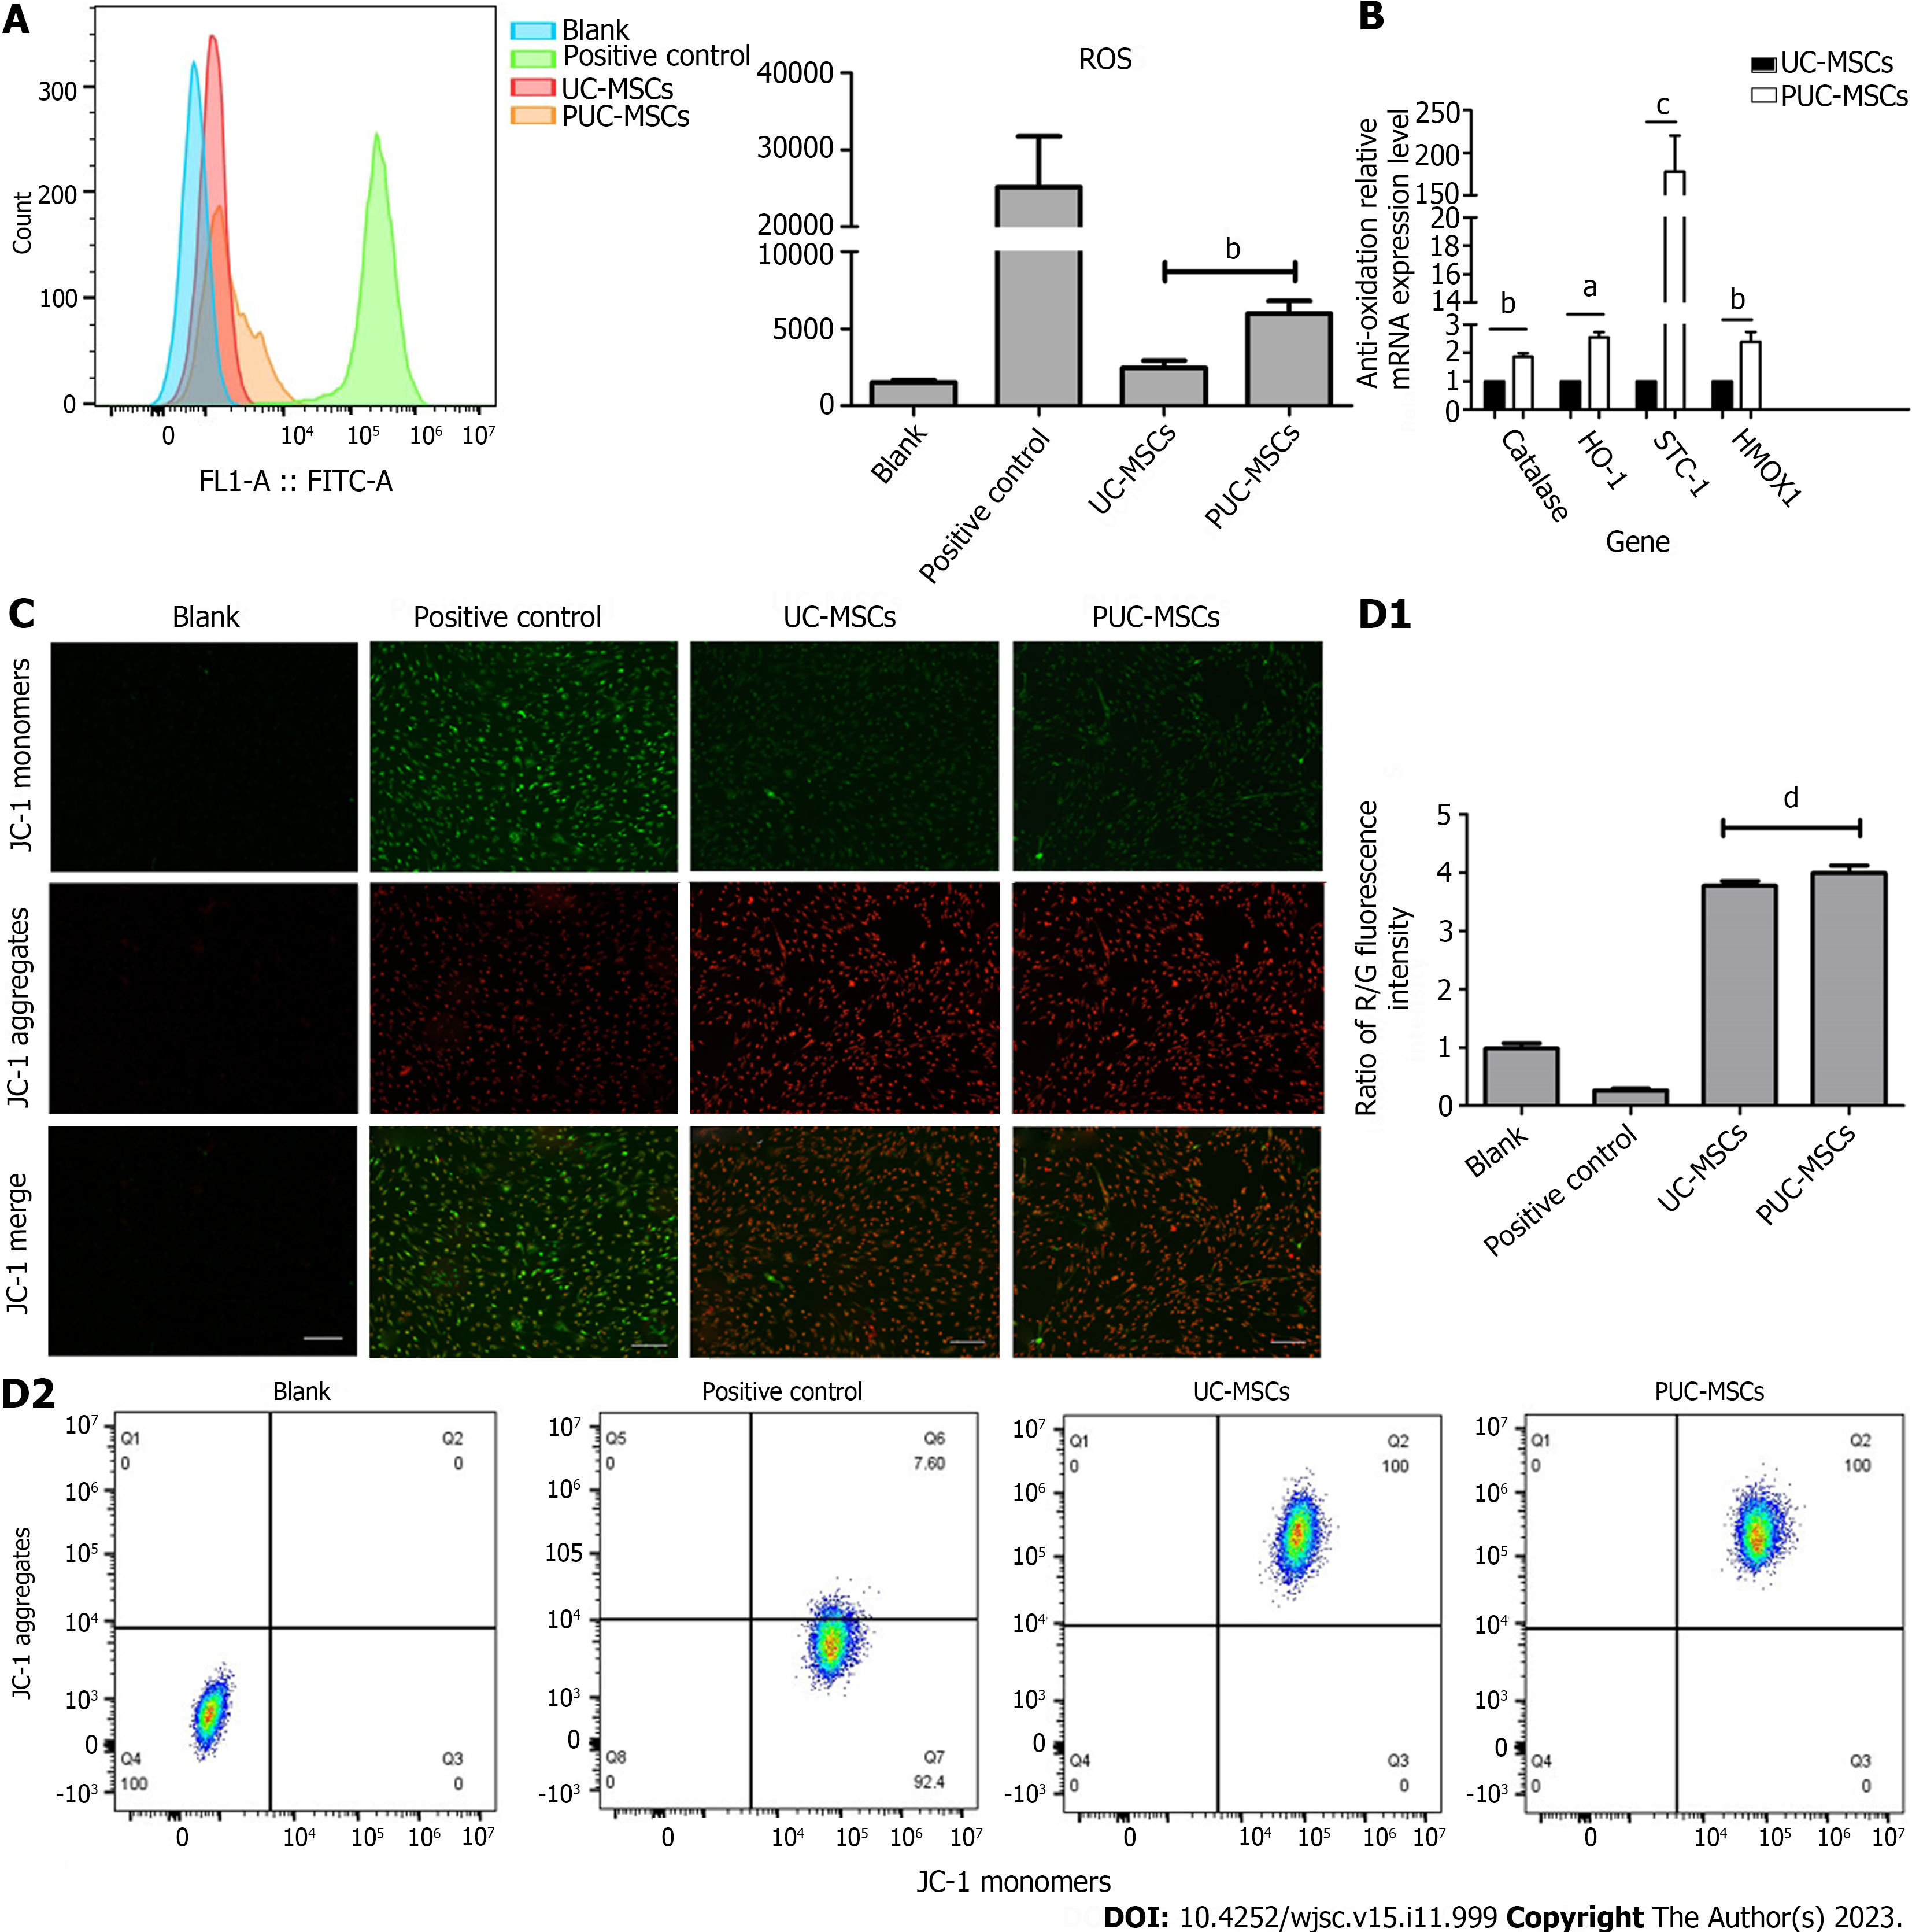
Figure 3 Mitochondrial function.
A: Reactive oxygen species (ROS) levels in umbilical cord mesenchymal stem cells (UC-MSCs) and primed UC-MSCs (PUC-MSCs) were analyzed by flow cytometry. The fluorescence intensity of 2,7-dichlorodihydrofluorescein (DCFH-DA) in PUC-MSCs increased by 3-fold compared to UC-MSCs; B: The expression of the antioxidant-related genes catalase, stanniocalcin-1 (STC1), and hemeoxygenase-1 (HOMX1) was increased; C: Representative image showing the mitochondrial membrane potential (MMP) of mesenchymal stem cells stained with JC-1. The red fluorescence of potential-dependent JC-1 aggregation in each group and the green fluorescence of the JC-1 monomer in the cytoplasm after depolarization of the mitochondrial membrane were observed. Fluorescence microscopy showed no significant difference in red and green fluorescence between UC-MSCs and PU-MSCs; Bar = 200 μm; D: Flow cytometry was used to detect the red and green fluorescence of the JC-1 probe in UC-MSCs and PUC-MSCs. There was no difference in the ratios of red and green fluorescence. aP < 0.05; bP < 0.01; cP < 0.001; dP > 0.05.
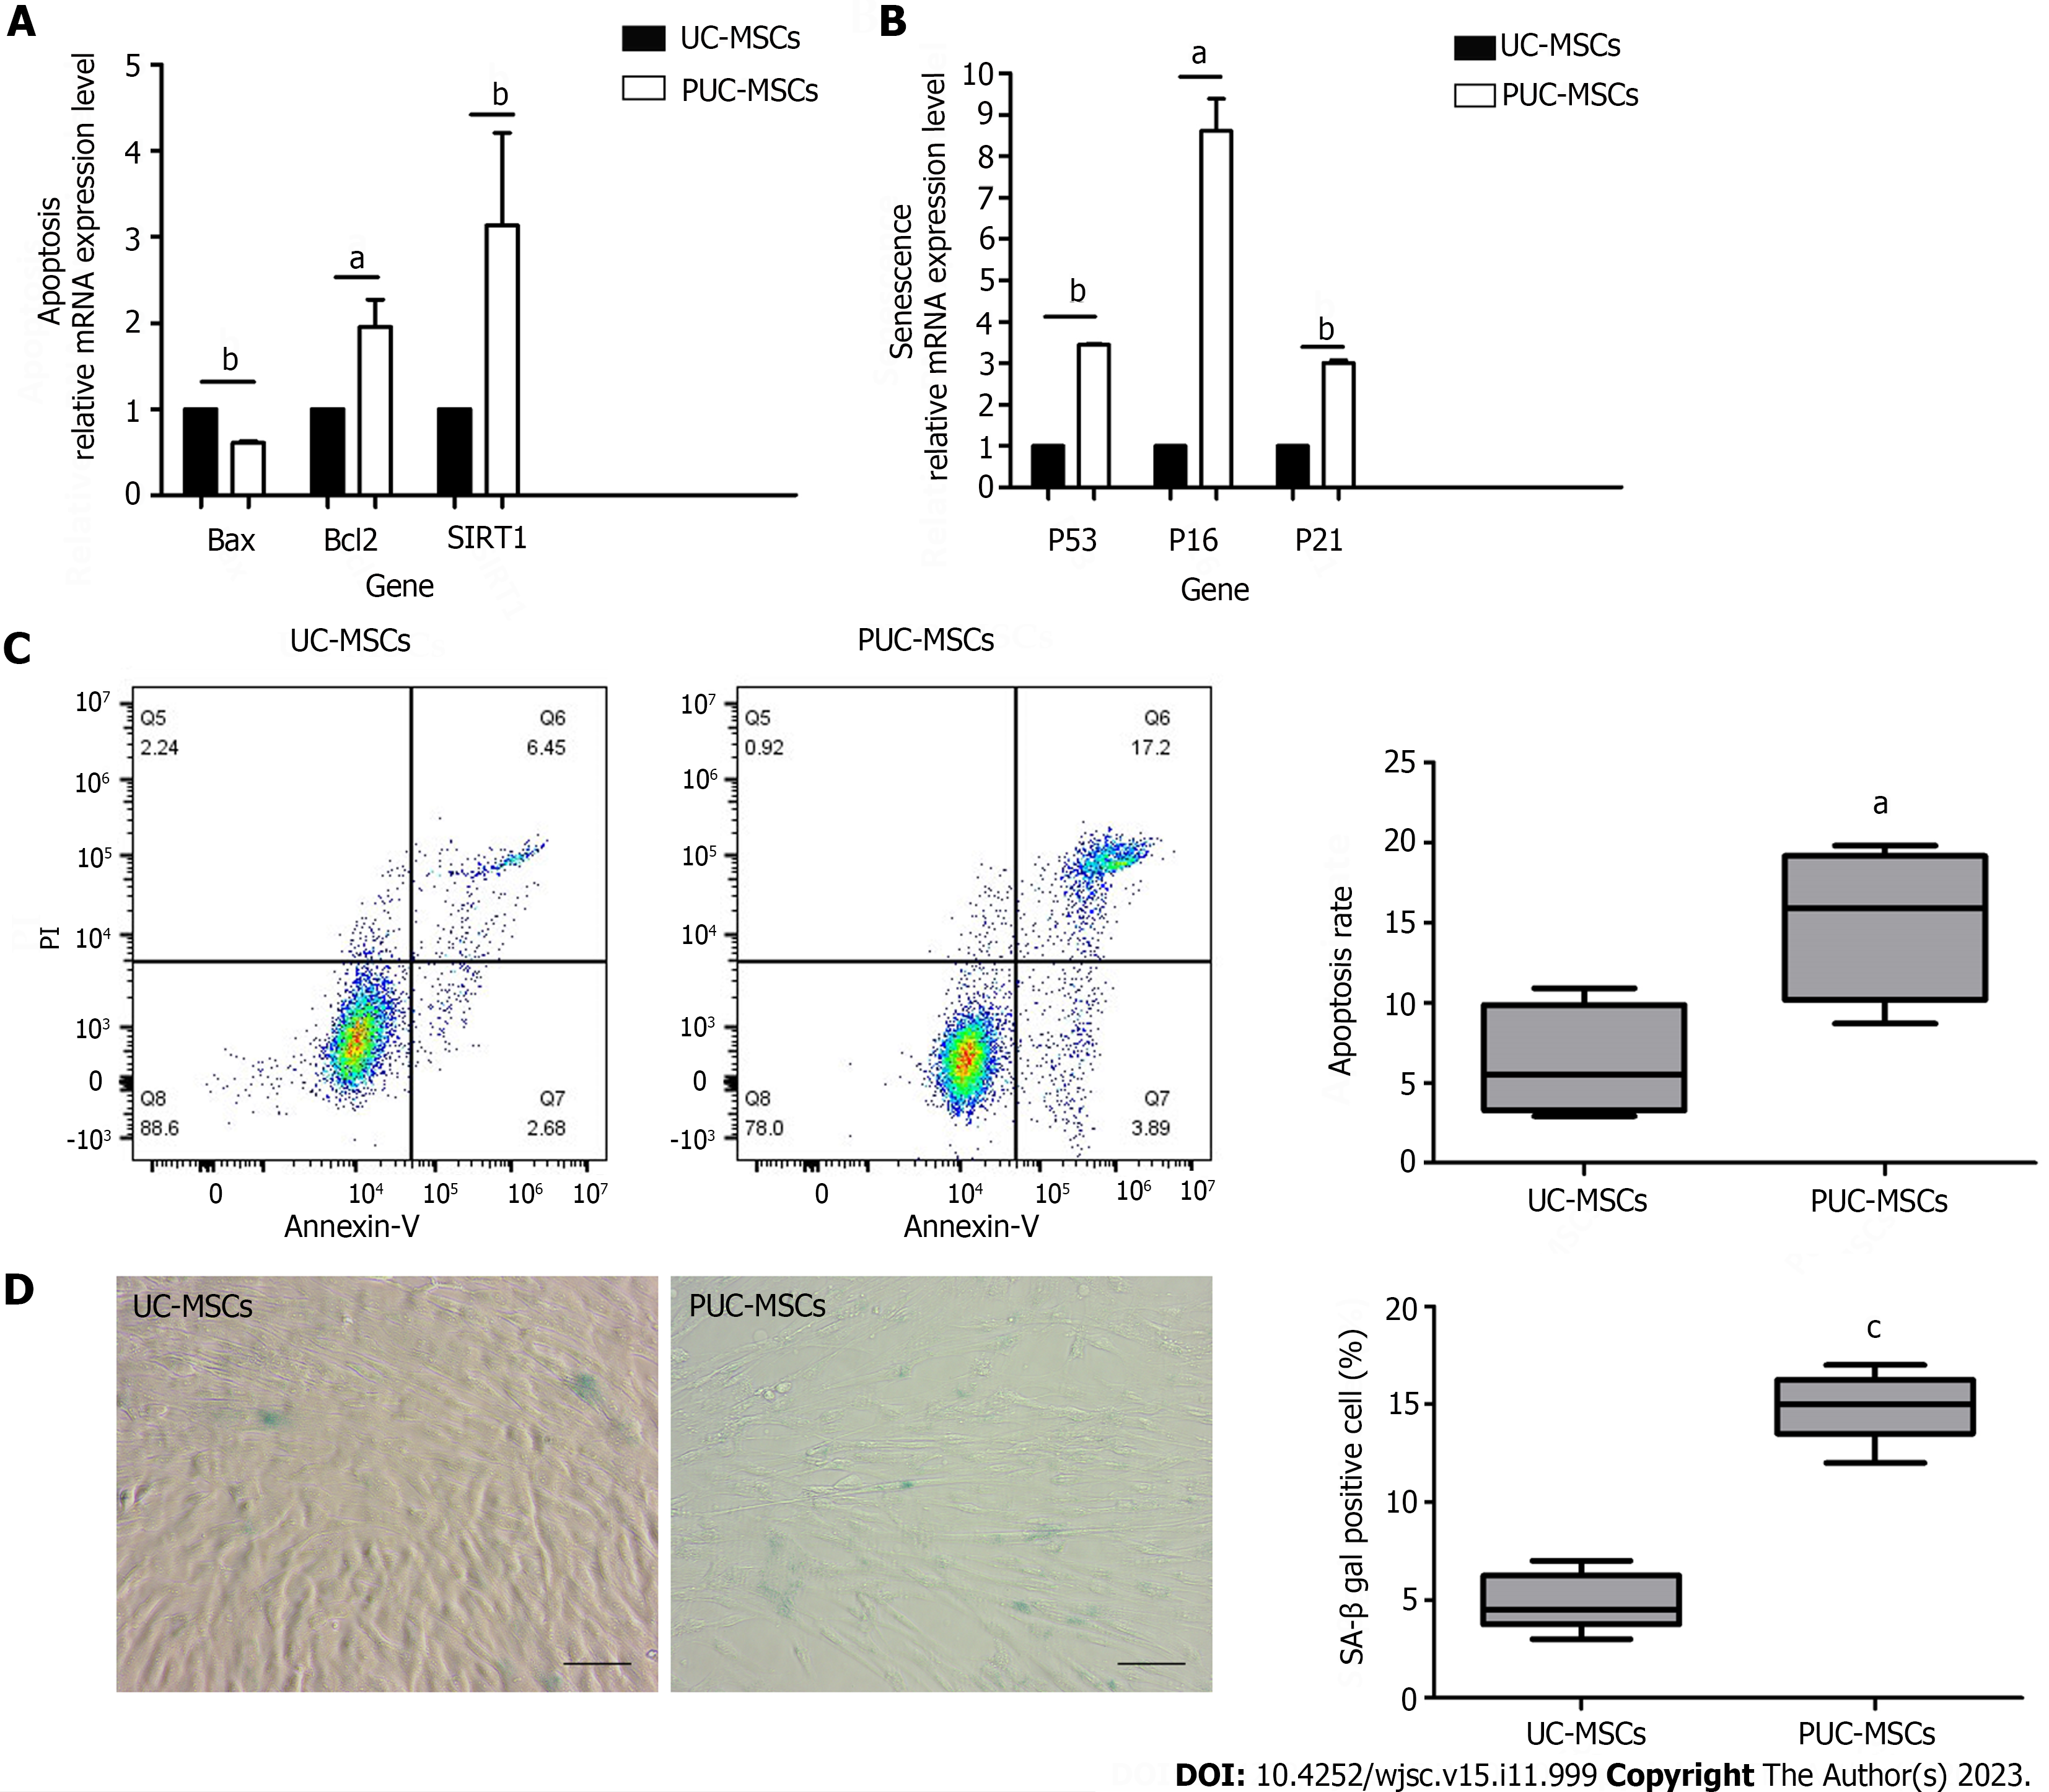
Figure 4 Effects of pretreatment on apoptosis and senescence in mesenchymal stem cells.
A: Apoptosis-related gene analysis showed that the expression of B-cell lymphoma 2 (BCL-2)-associated protein (Bax) was decreased and the expression of Bcl2 and silencing information regulator 2-related enzyme 1 (SIRT1) was increased after hypoxia and inflammatory factor pretreatment; B: Expression of P53, P16 and P21 was upregulated after hypoxia and inflammatory factor pretreatment; C: Umbilical cord mesenchymal stem cells (UC-MSCs) and primed UC-MSCs (PUC-MSCs) were stained with Annexin V-FITC apoptosis assay kit reagents and apoptotic cells were detected by flow cytometry. The results showed that the apoptosis index of PUC-MSCs increased; D: Representative images of β-galactosidase (SA-β-gal) staining and quantitative analysis of positive SA-β-gal staining. Compared with that of the UC-MSCs, the number of SA-β-gal-positive PUC-MSCs was significantly increased; Bar = 100 μm. aP < 0.05; bP < 0.01; cP < 0.001.
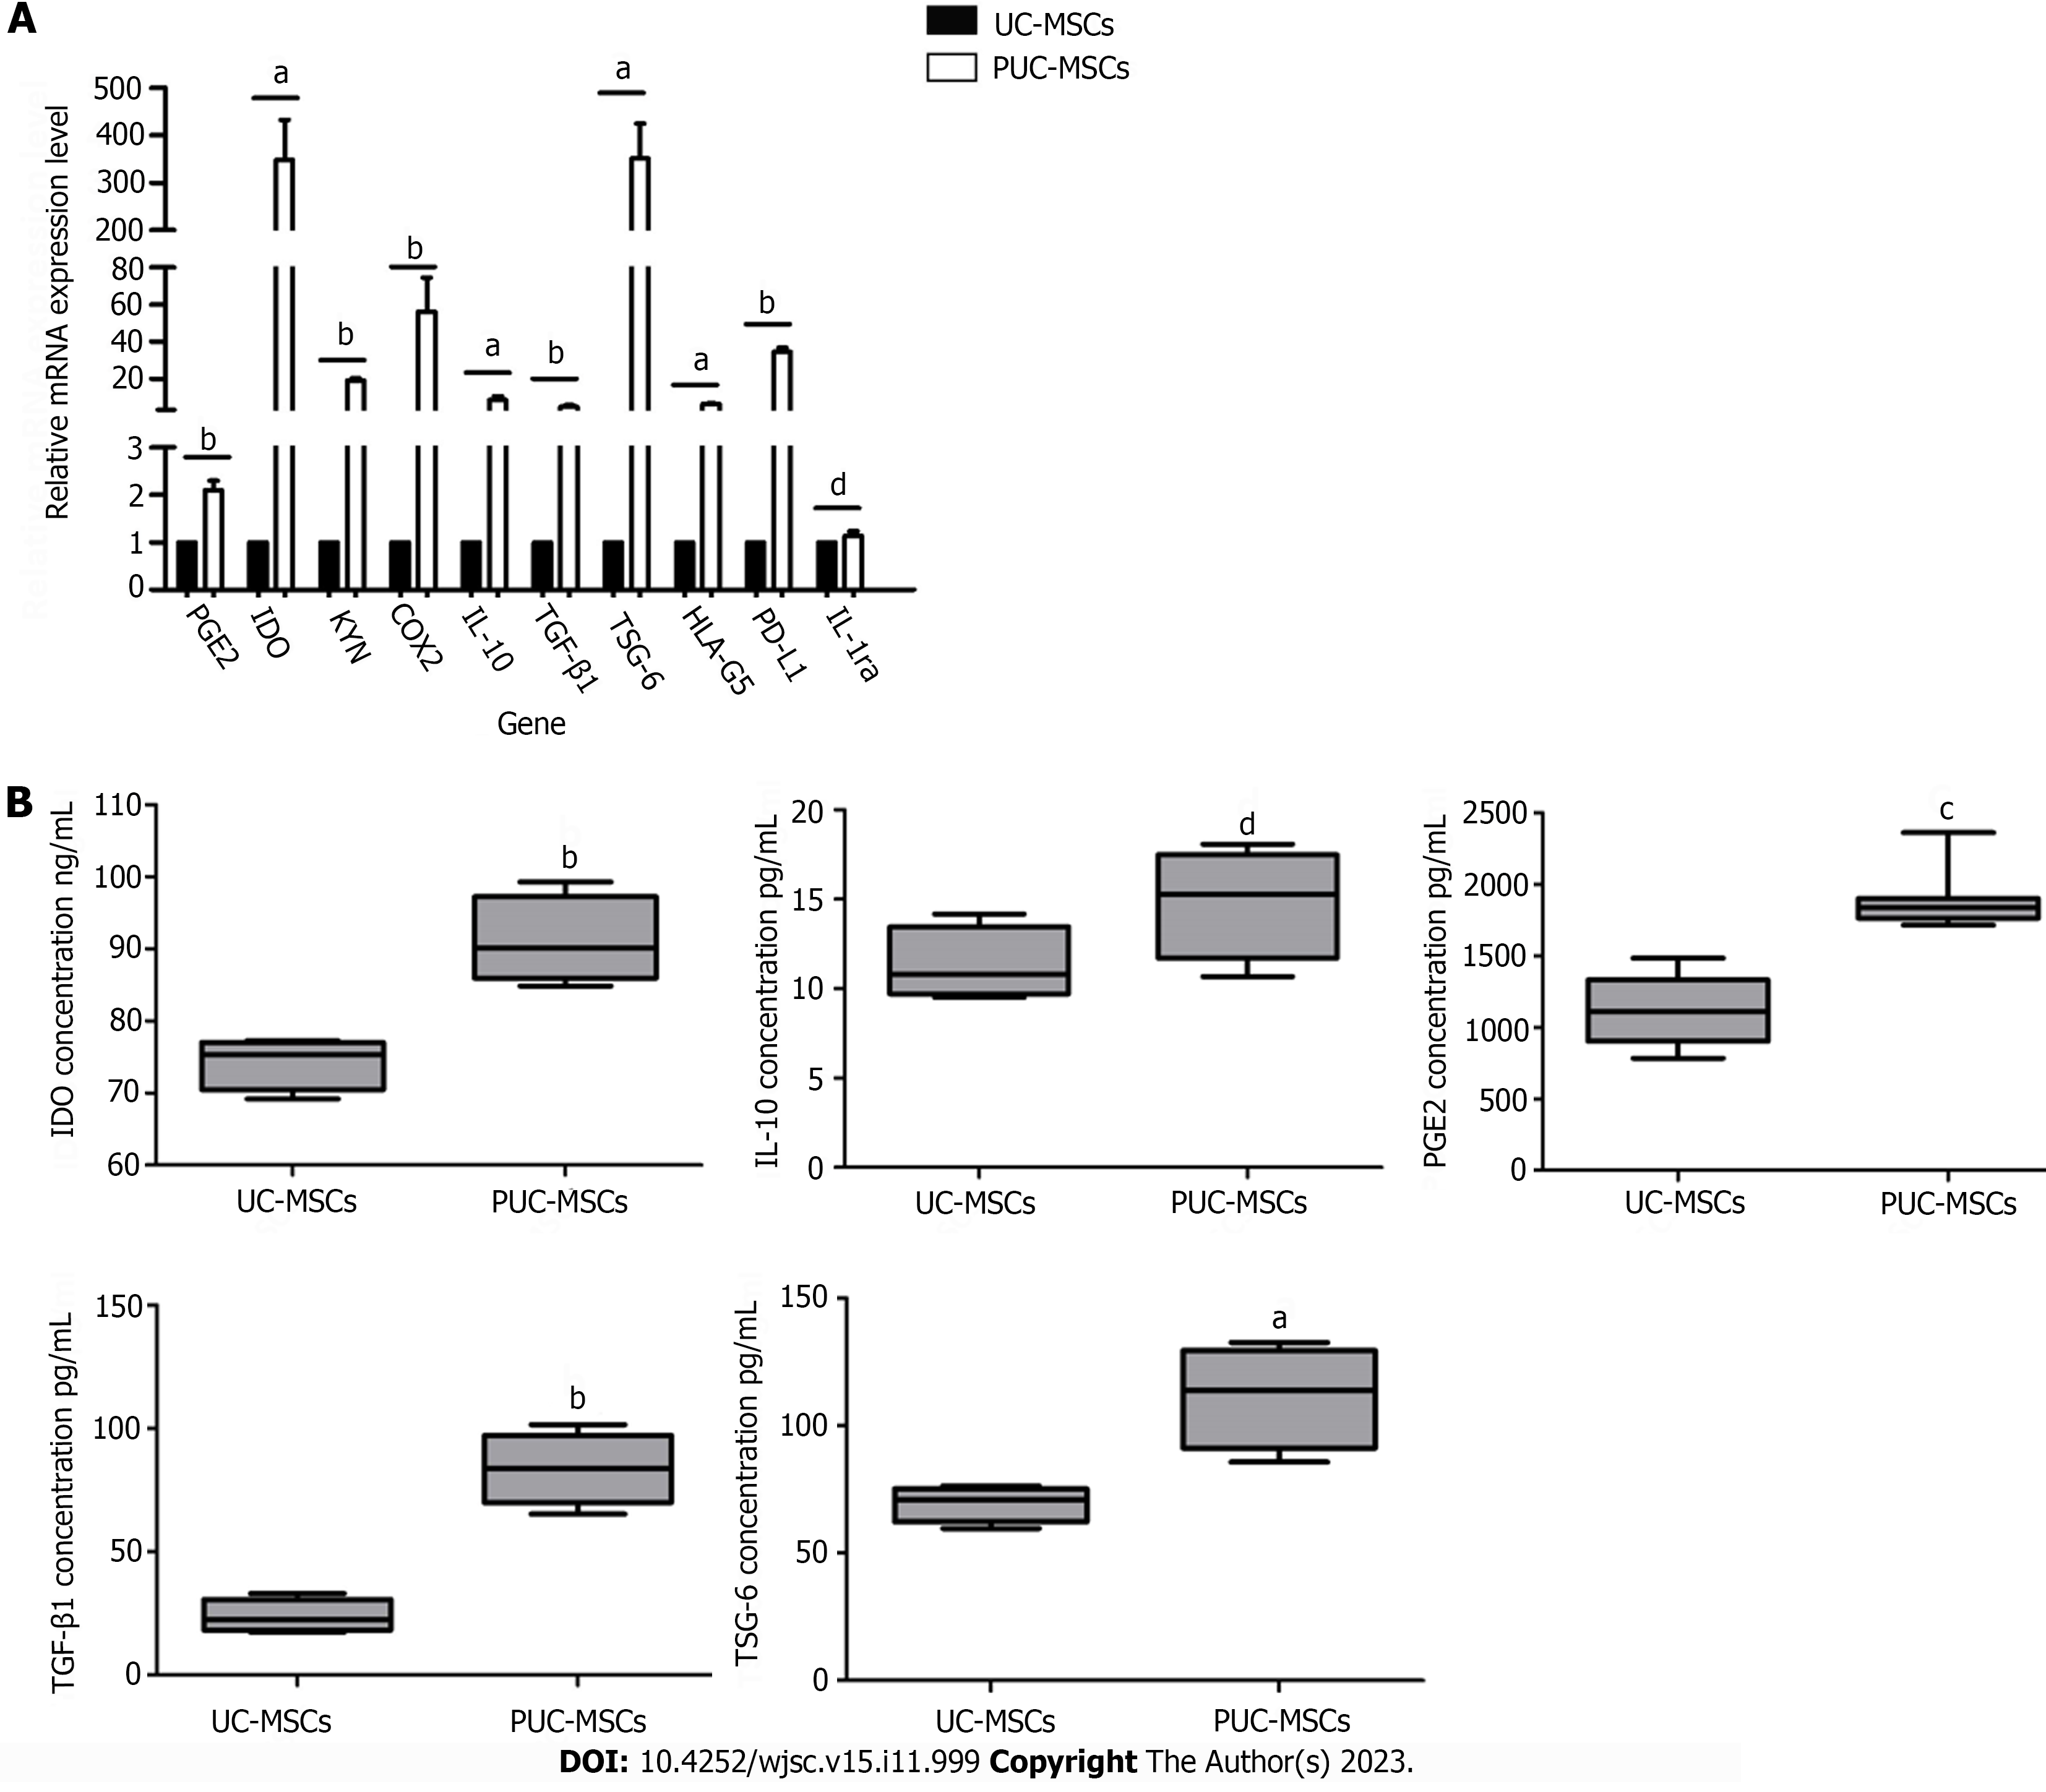
Figure 5 Relative expression of immunomodulatory genes and proteins in umbilical cord mesenchymal stem cells after pretreatment.
A: Gene expression levels of umbilical cord mesenchymal stem cells (UC-MSCs) and primed UC-MSCs (PUC-MSCs) were analyzed by quantitative real-time polymerase chain reaction. Expression levels of prostaglandin E2 (PGE2), kynurenine, idoleamine-2,3-dioxygenase (IDO), cyclooxygenaese-2 (COX2), interleukin-10 (IL-10), transforming growth factor-beta 1 (TGF-β1), human leukocyte antigen-G5 (HLA-G5), tumor necrosis factor-α-induced protein-6 (TSG-6) and ligands for programmed cell death 1 (PD-L1) were all increased after hypoxia and inflammatory factor preconditioning. IL-1 receptor antagonist (IL-1ra) was not significantly different between the two groups; B: Levels of immunoregulatory proteins in UC-MSCs and PUC-MSCs were detected by enzyme-linked immunosorbent assay. After hypoxia and inflammatory factor pretreatment, the protein levels of IDO, PGE2, TGF-β1 and TSG-6 were increased, while the expression of IL-10 was not significantly different, as determined via three independent experiments. aP < 0.05; bP < 0.01; cP < 0.001; dP > 0.05.
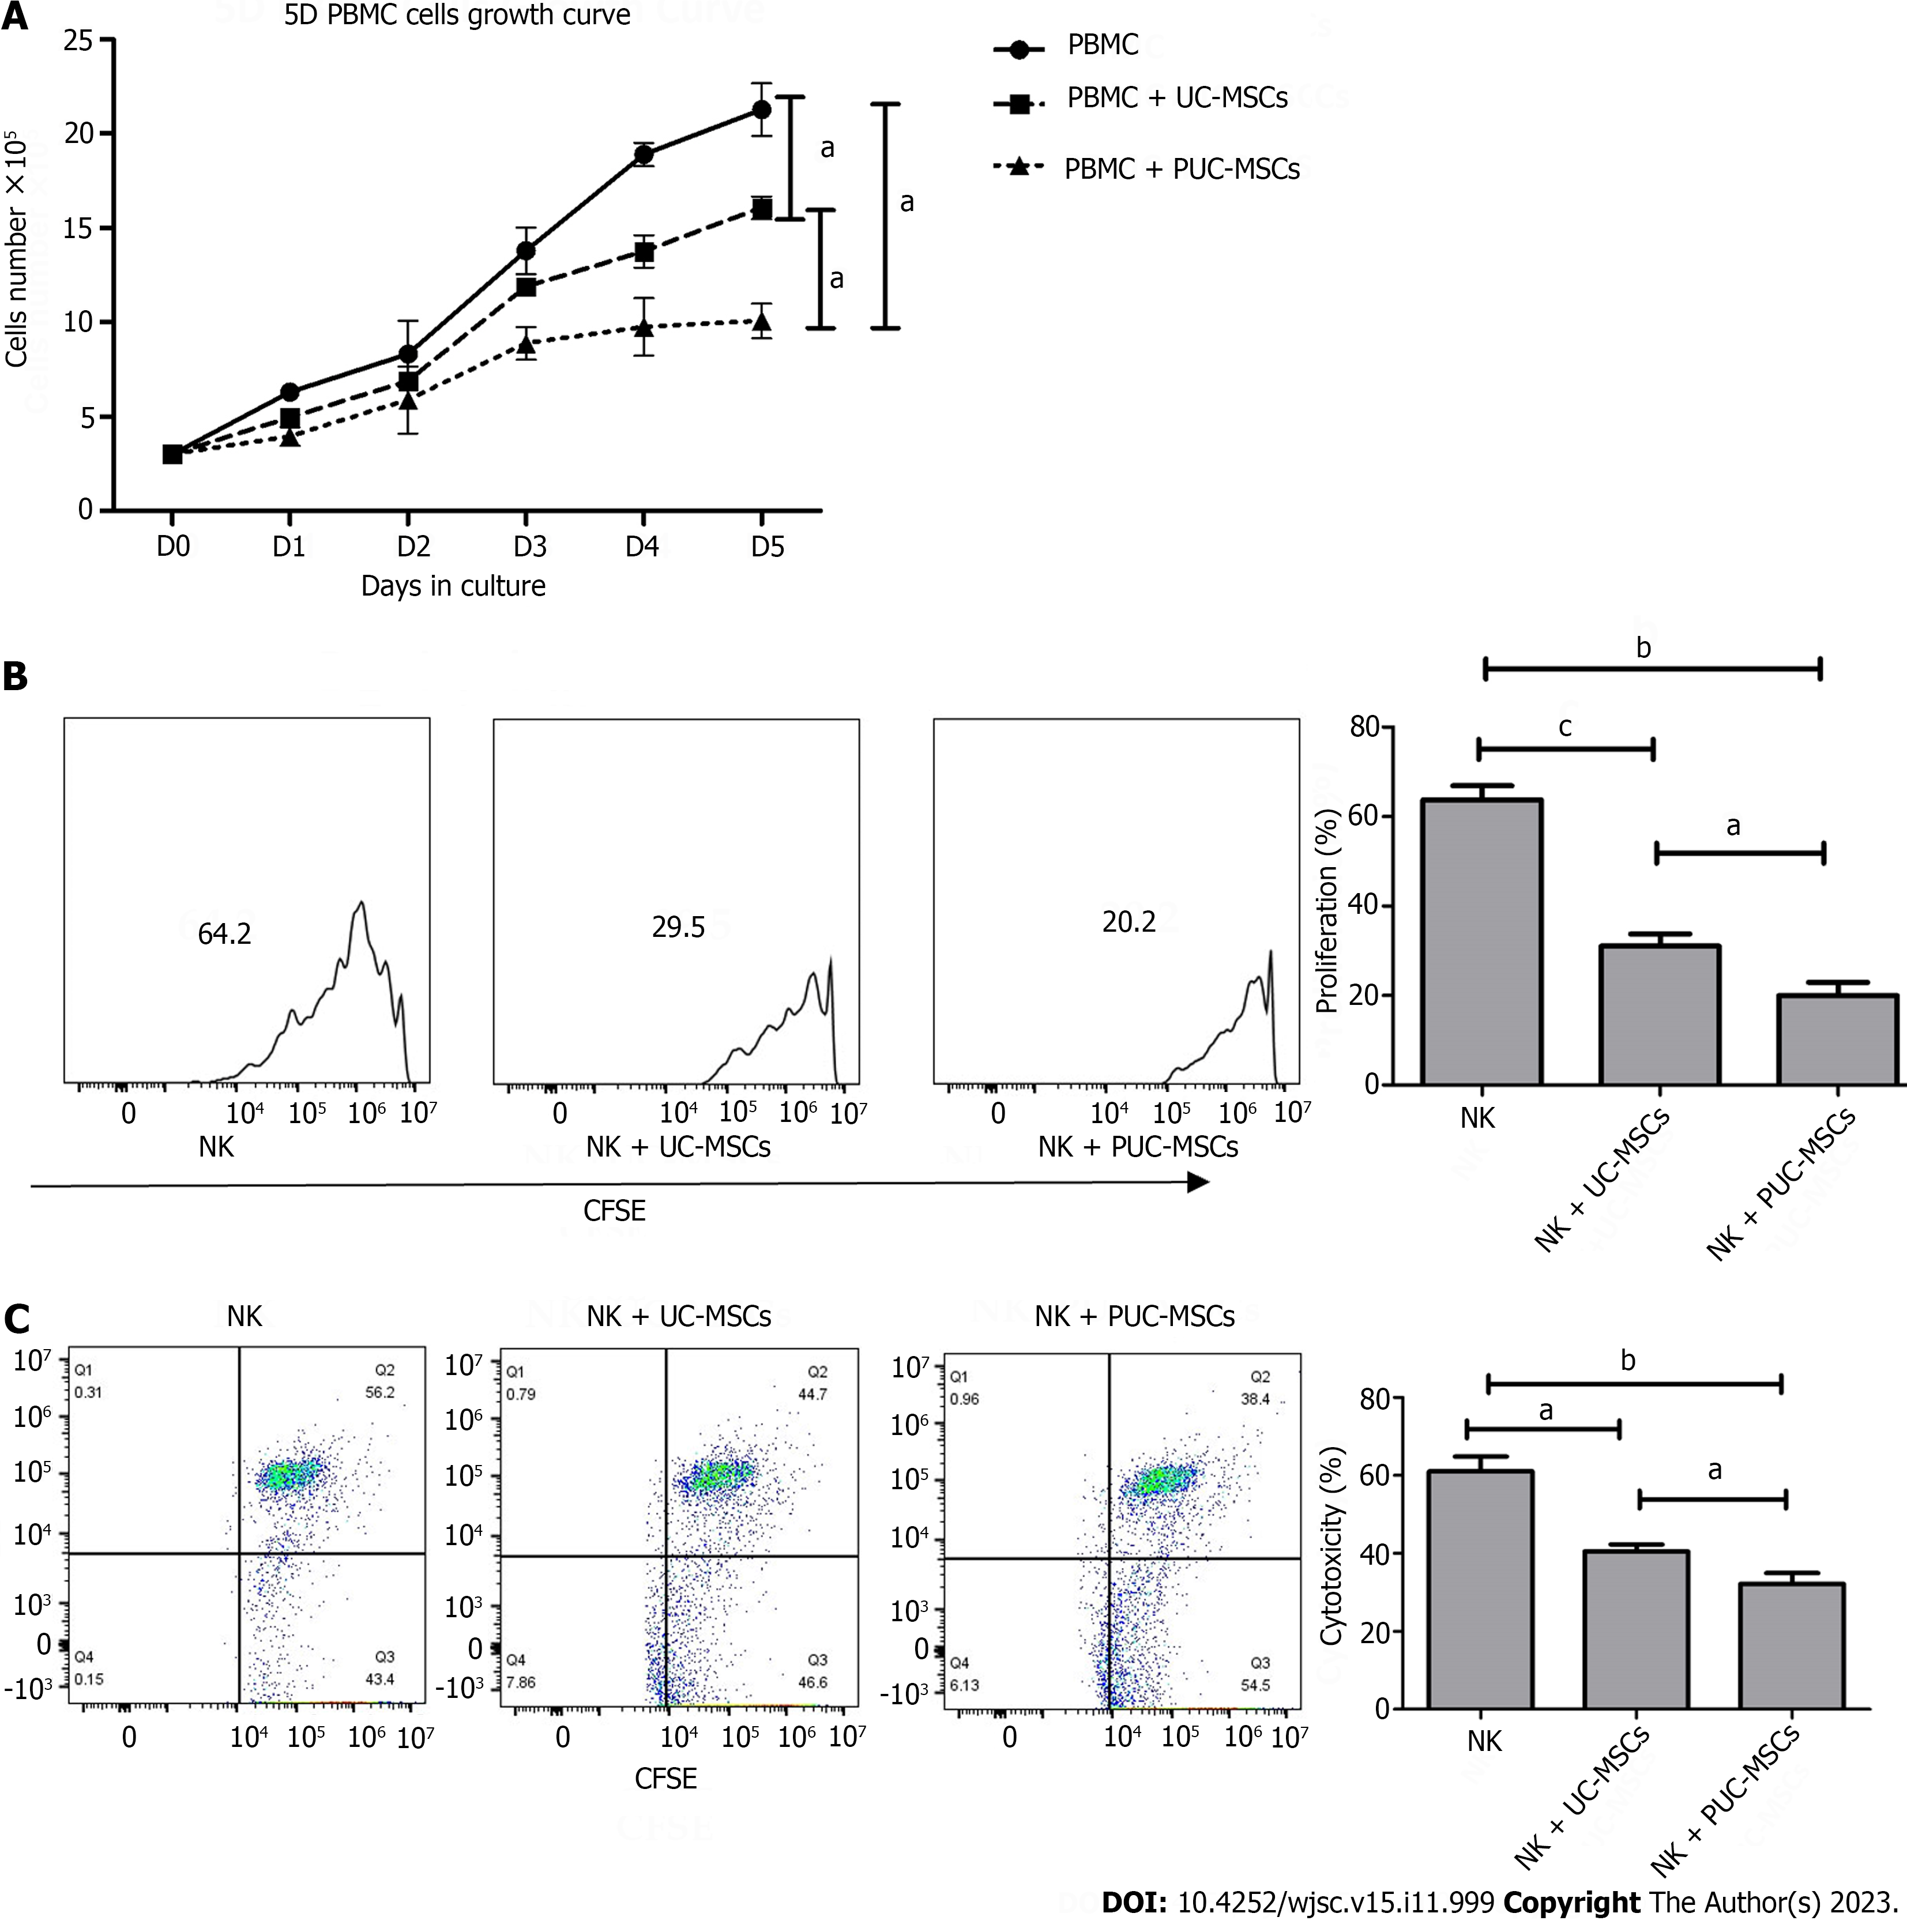
Figure 6 Detection of the immunomodulatory function of umbilical cord mesenchymal stem cells after preconditioning.
A: Peripheral blood mononuclear cells (PBMCs) alone or directly exposed to umbilical cord mesenchymal stem cells (UC-MSCs/primed UC-MSCs) for 5 d in a 3:1 ratio. The number of PBMCs in three groups was measured daily and the growth curve was plotted; B: Carboxyfluorescein diacetate succinimidyl ester (CFSE)-stained natural killer (NK) cells were cultured alone or cocultured with UC-MSCs/PUC-MSCs at a 3:1 ratio for 72 h. NK cells were harvested, and the fluorescence intensity of CFSE was measured by flow cytometry to measure the proliferation rate of NK cells; C: NK cells were collected and incubated with CFSE-stained K562 target cells for 4 h at an effector ratio (E:T = 1:5). Effector cell (NK cell)-mediated cytotoxicity of K562 cells was analyzed by flow cytometry. aP < 0.05; bP < 0.01; cP < 0.001; dP > 0.05.
- Citation: Li H, Ji XQ, Zhang SM, Bi RH. Hypoxia and inflammatory factor preconditioning enhances the immunosuppressive properties of human umbilical cord mesenchymal stem cells. World J Stem Cells 2023; 15(11): 999-1016
- URL: https://www.wjgnet.com/1948-0210/full/v15/i11/999.htm
- DOI: https://dx.doi.org/10.4252/wjsc.v15.i11.999


