Copyright
©The Author(s) 2022.
World J Stem Cells. Sep 26, 2022; 14(9): 729-743
Published online Sep 26, 2022. doi: 10.4252/wjsc.v14.i9.729
Published online Sep 26, 2022. doi: 10.4252/wjsc.v14.i9.729
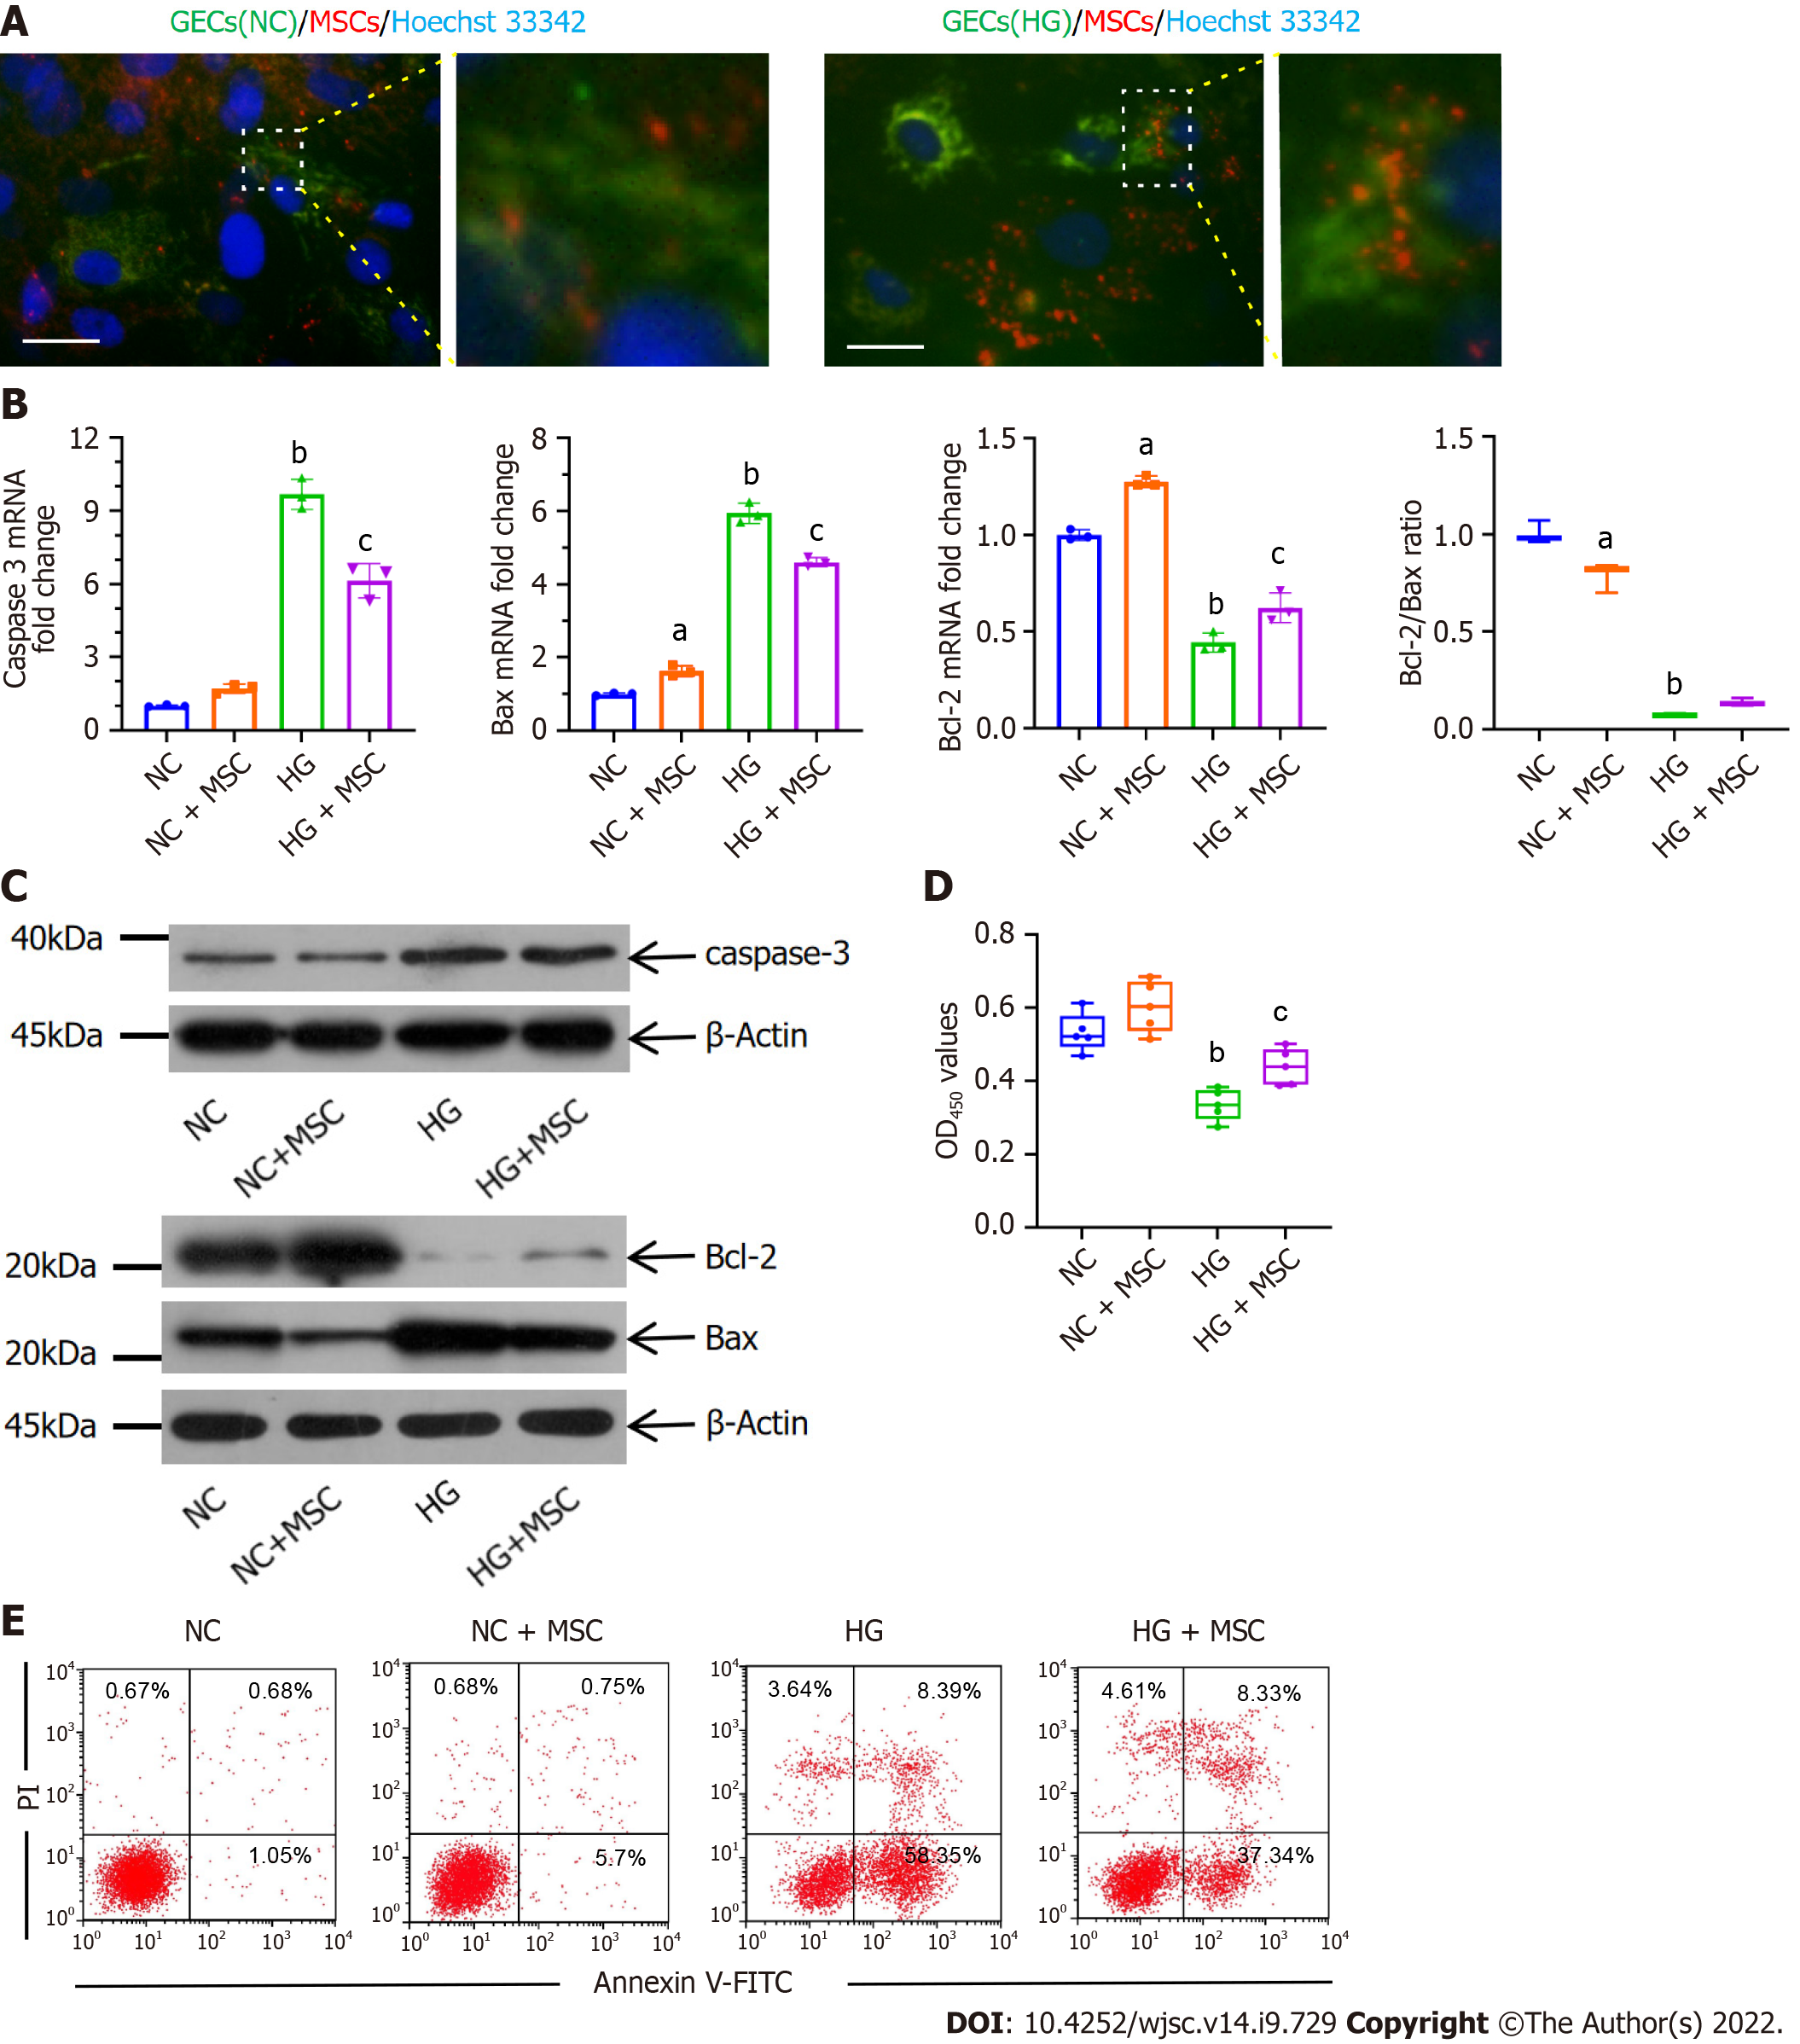
Figure 1 Anti-apoptotic effects of mesenchymal stem cells on high glucose-induced glomerular endothelial cells in vitro.
A: Immunofluorescence images of MitoTracker green (green) labeled normal control-glomerular endothelial cells (NC-GECs) and high glucose-induced GECs (HG-GECs) cultured with MitoTracker Red CMXRos (red) labeled mesenchymal stem cells (MSCs). GEC nuclei were counterstained with Hoechst 33342 (blue). A few spontaneous mitochondria transferred from MSCs to NC-GECs. Interestingly, a robust transfer of numerous mitochondria from MSCs to HG-GECs was observed. Scale bar: 200 nm; B: Caspase 3, Bax, and B-cell lymphoma 2 mRNA expression detected by real-time reverse transcriptase-polymerase chain reaction; C: Caspase 3, Bax, and B-cell lymphoma 2 protein expression detected by western blot; D: GEC viability assays performed using the Cell Counting Kit-8; E: Cellular apoptosis analysis in GEC cells treated with MSCs using Annexin V-FITC/PI staining. Data are presented as the mean ± SD. aP < 0.05 vs normal control group, bP < 0.01 vs normal control group, cP < 0.05 vs high glucose-induced group. GECs: Glomerular endothelial cells; MSCs: Mesenchymal stem cells; NC-GECs: Normal control glomerular endothelial cells; HG-GECs: High glucose-induced GECs; Bcl-2: B-cell lymphoma 2.
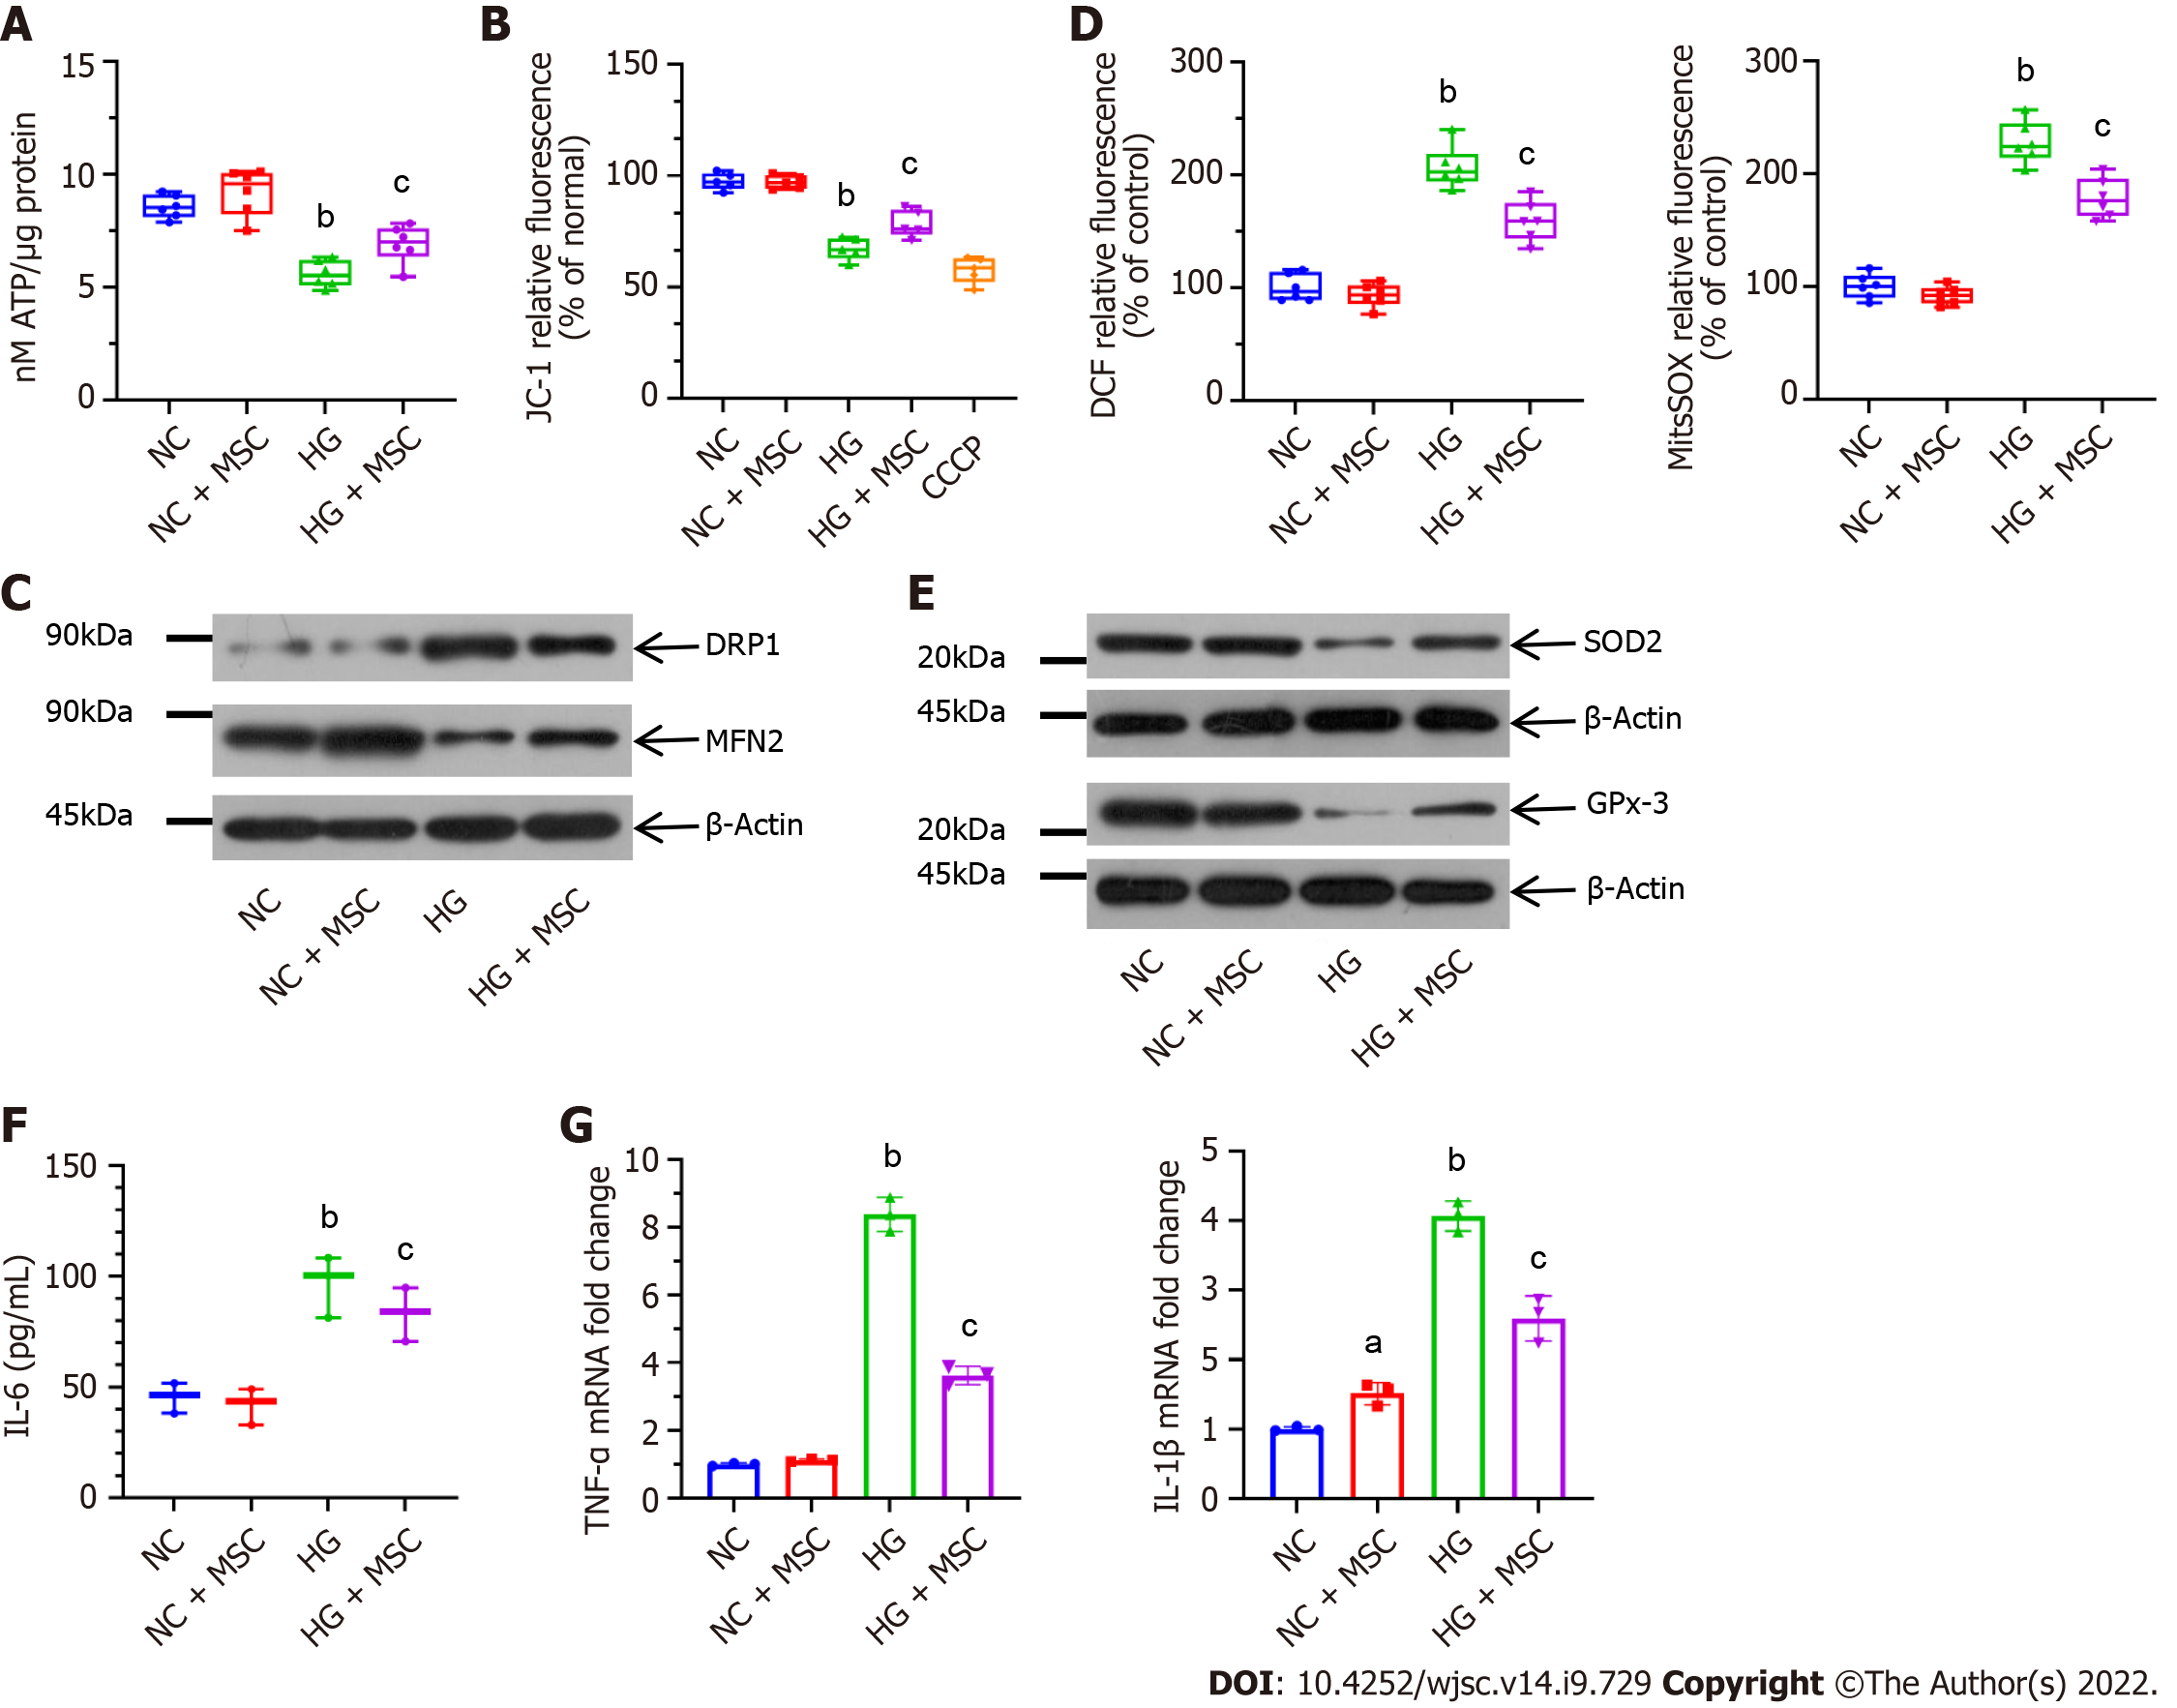
Figure 2 Mesenchymal stem cells alleviate mitochondrial activity and high glucose-induced oxidative stress in cultured glomerular endothelial cells.
A: Mesenchymal stem cells (MSCs) increased adenosine triphosphate production in high glucose (HG)-induced glomerular endothelial cells (GECs); B: MSCs also attenuated mitochondrial membrane potential (ΔΨm) in GECs. Carbonyl cyanide 3-chlorophenylhydrazone as a mitochondrial oxidative phosphorylation uncoupler, was used as the positive control group; C: Effect on mitochondrial fission marker and the fusion marker levels; D: Pretreatment with MSCs attenuated HG-induced upregulation in DCF-DA [intracellular reactive oxygen species (ROS)] and MitoSOX Red (mitochondrial ROS) fluorescent intensity; E: Representative western blot expression levels of ROS-protective enzymes (superoxide dismutase 2 and glutathione peroxidase 3); F: Concentration of interleukin (IL)-6 in the supernatant by enzyme-linked immunosorbent assay; G: Mitochondrial transfer ameliorated the mRNA expression levels of inflammatory markers (tumor necrosis factor-α and IL-1β), as determined using real-time reverse transcriptase-polymerase chain reaction. Data are presented as the mean ± SD. aP < 0.05 vs normal control group, bP < 0.01 vs normal control group, cP < 0.05 vs high glucose group. MSCs: Mesenchymal stem cells; DRP1: Dynamin-related protein 1; MFN2: Mitofusin 2; ROS: Reactive oxygen species; SOD2: Superoxide dismutase 2; GPx-3: Glutathione peroxidase 3; IL-6: Interleukin-6; CCCP: Carbonyl cyanide 3-chlorophenylhydrazone; NC: Normal control; HG: High glucose; TNF-α: Tumor necrosis factor-α; ATP: Adenosine triphosphate.
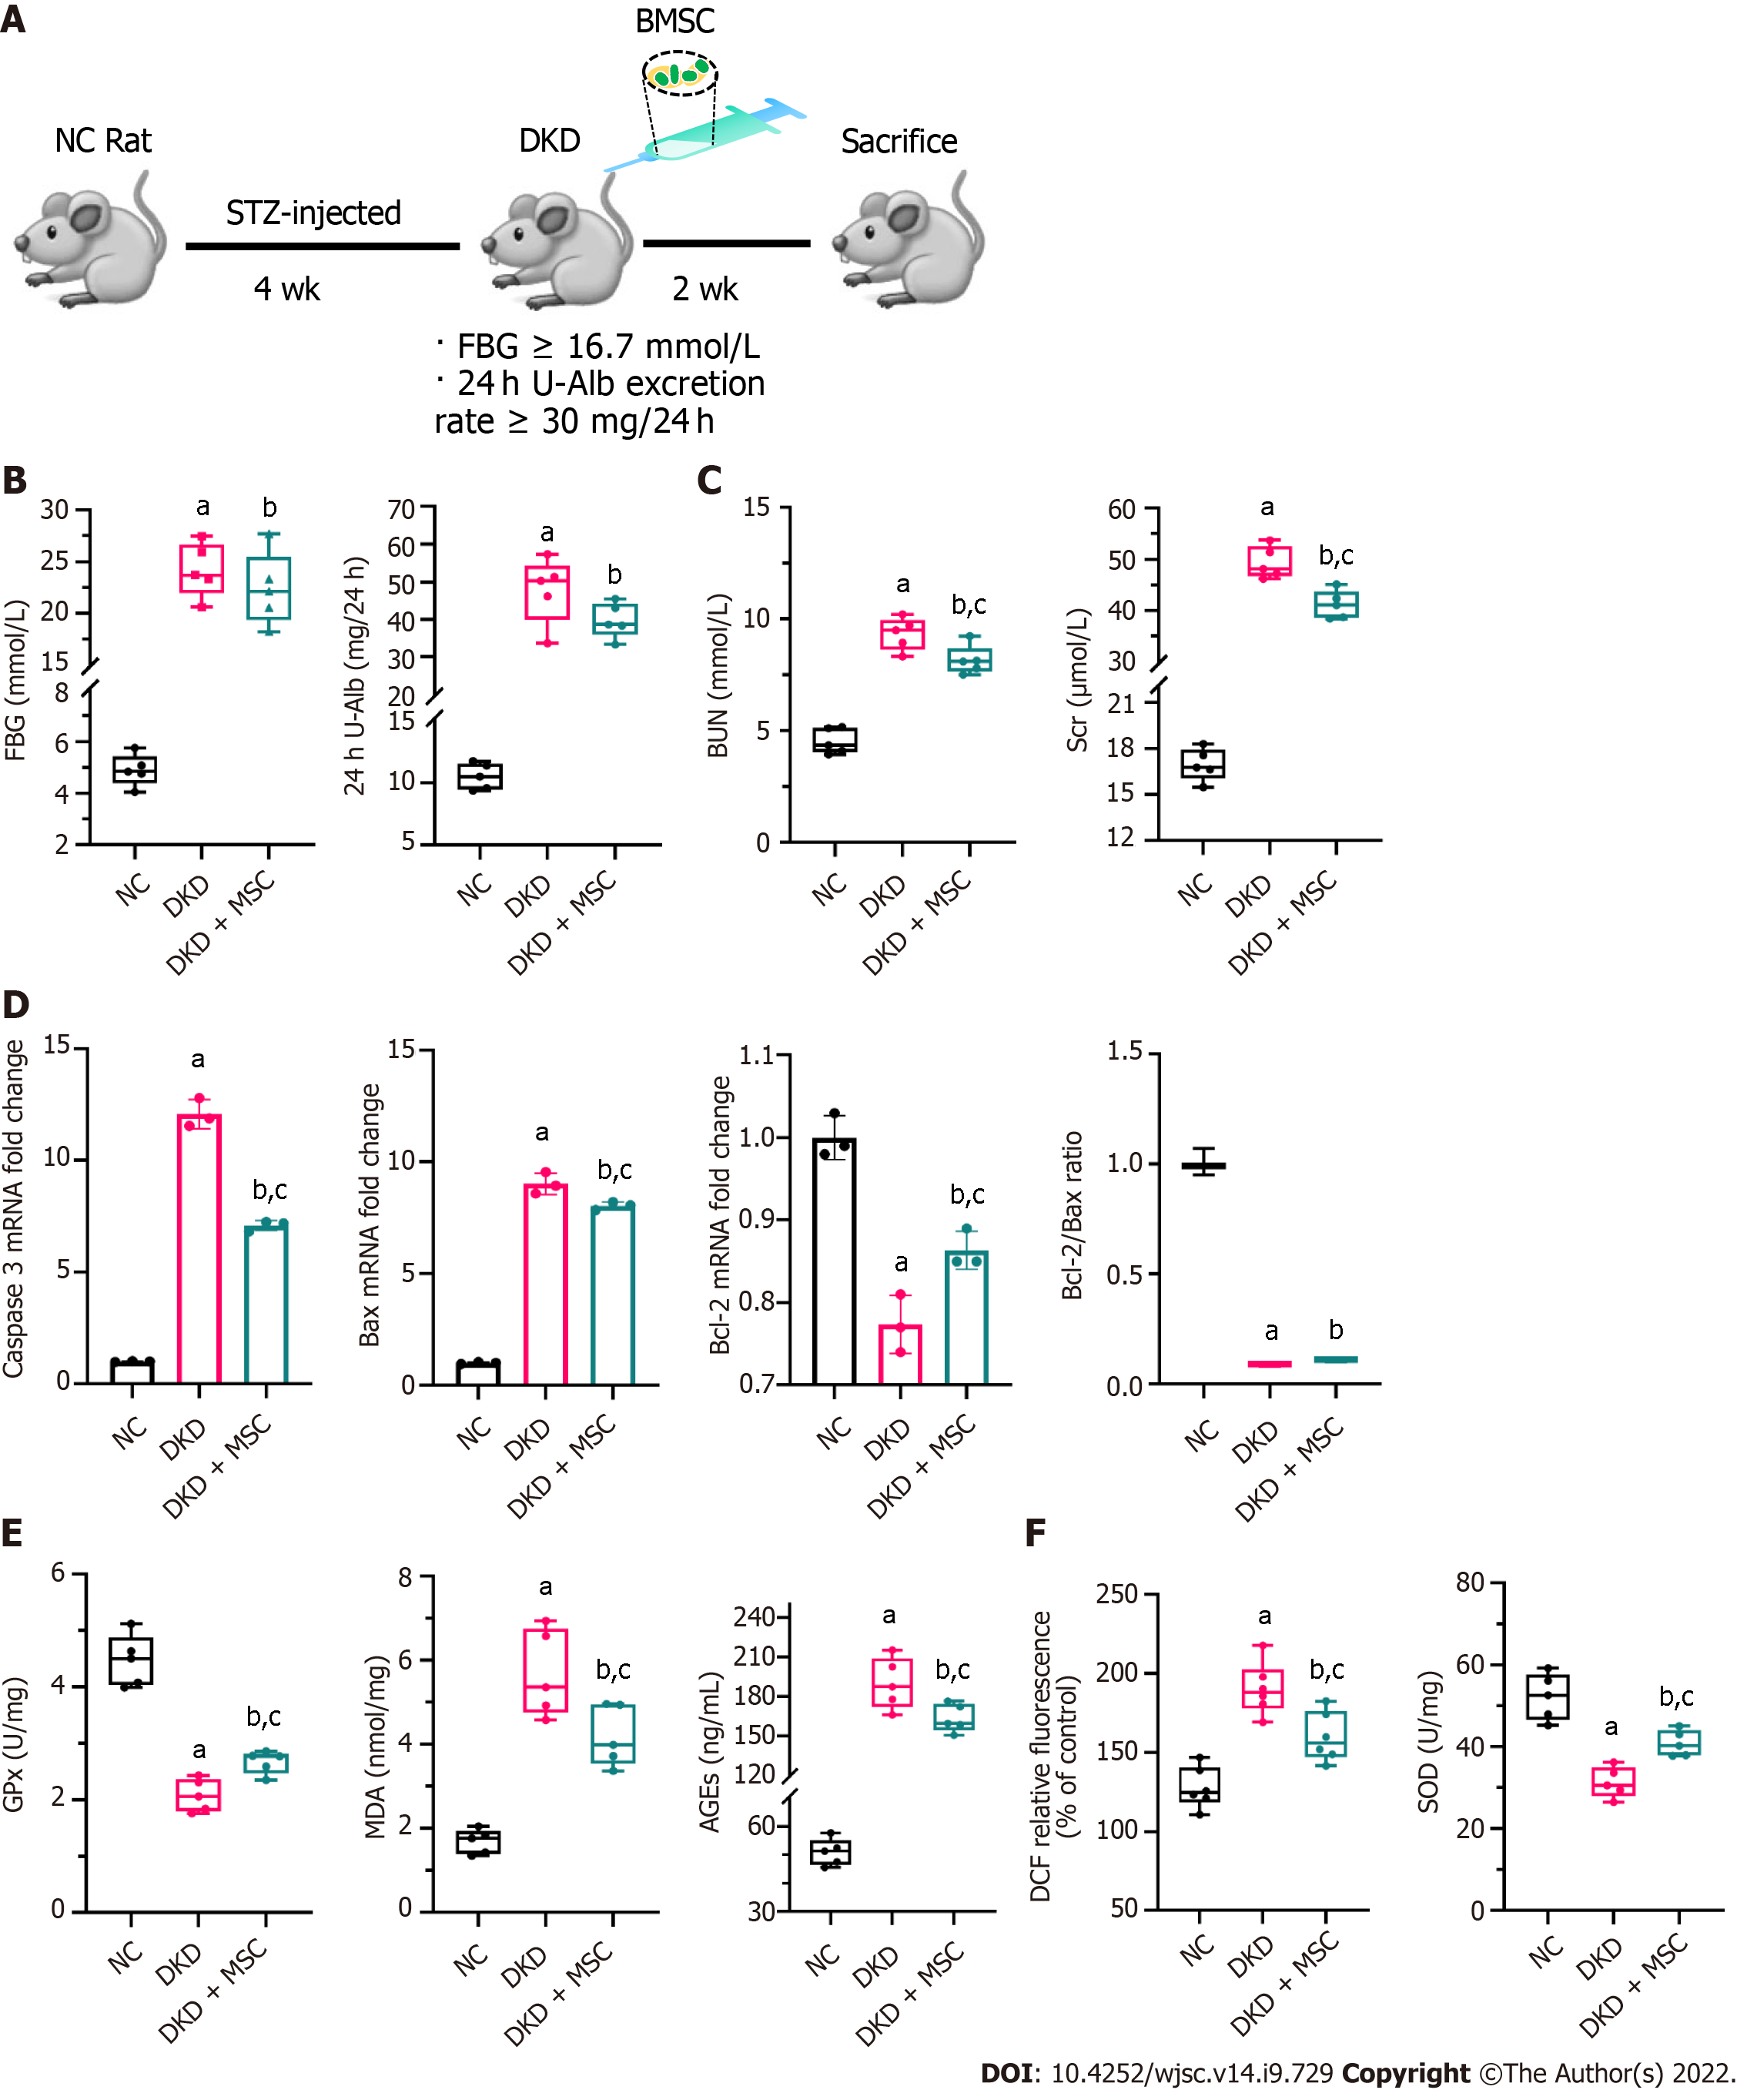
Figure 3 Effects of mesenchymal stem cell treatment on biochemical indexes.
A: Flowchart of rat treatment from day 0 to week 6; B: Fasting blood glucose and 24-h urinary albumin concentration; C: Concentrations of blood urea nitrogen and serum creatinine in rat serum; D: Relative mRNA expression of caspase 3, Bax, and B-cell lymphoma 2 (Bcl-2), and Bcl-2/Bax ratio in rat kidney tissues; E: Concentrations of glutathione peroxidase, malondialdehyde, and advanced glycation end products in rat kidney tissues; F: Levels of reactive oxygen species and superoxide dismutase in kidney tissues. Data are presented as the mean ± SD. aP < 0.001 vs normal control group, bP < 0.01 vs normal control group, cP < 0.05 vs diabetic kidney disease group. NC: Normal control; FBG: Fasting blood glucose; 24 h U-Alb: 24-h urinary albumin; BUN: Blood urea nitrogen; Scr: Serum creatinine; Bcl-2: B-cell lymphoma 2; Bax: BCL2-Associated X; GPx: Glutathione peroxidase; AGEs: Advanced glycation end products; MDA: Malondialdehyde; SOD: Superoxide dismutase; NC: Normal control; DKD: Diabetic kidney disease; MSCs: Mesenchymal stem cells.
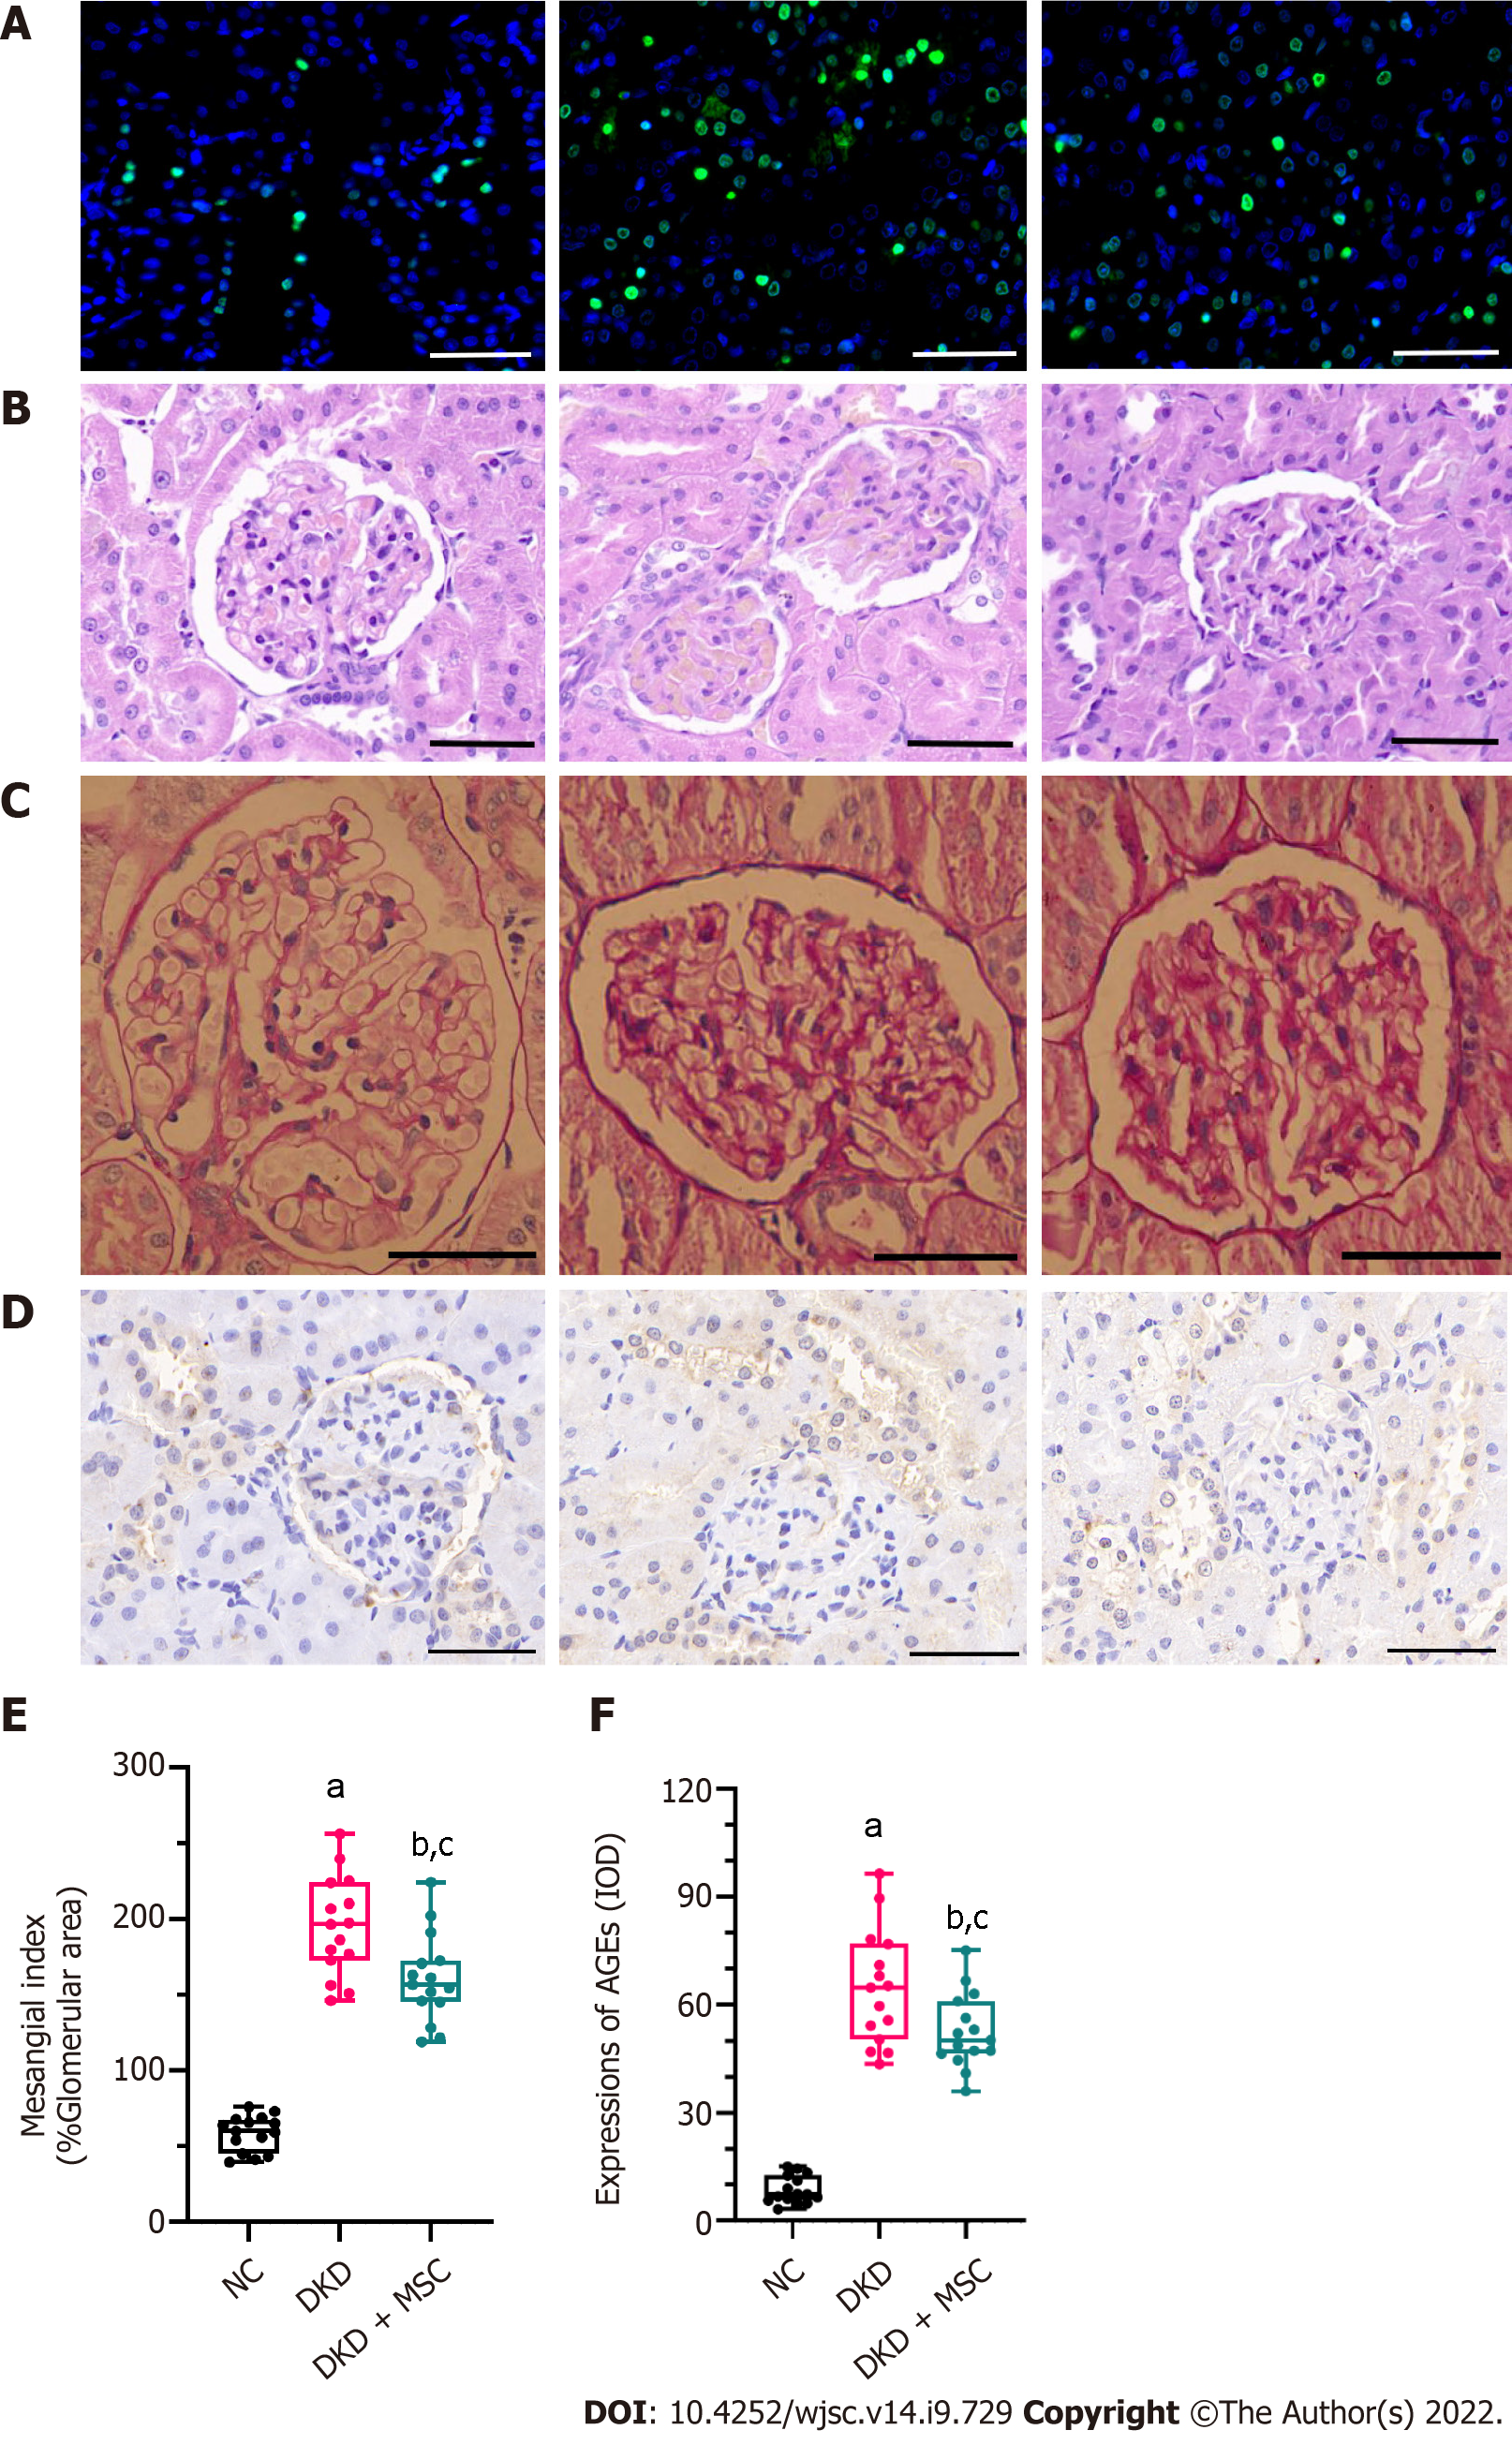
Figure 4 TdT-mediated dUTP nick-end labeling and histopathology analysis of kidney tissues from all rats.
A: TdT-mediated dUTP nick-end labeling staining. Nuclei: Blue; apoptosis: Green; B: Hematoxylin-eosin staining; C: Periodic acid-Schiff (PAS) staining; D: Mesangial index of PAS-positive areas in the glomerulus; E: Immunohistochemical staining of advanced glycation end products (AGEs); F: Integrated optical density of AGEs in kidney tissues. All scale bar: 50 μm. Data are presented as the mean ± SD. aP < 0.001 vs normal control group, bP < 0.001 vs normal control group, cP < 0.05 vs diabetic kidney disease group. AGEs: Advanced glycation end products; NC: Normal control; DKD: Diabetic kidney disease; MSCs: Mesenchymal stem cells.
- Citation: Tang LX, Wei B, Jiang LY, Ying YY, Li K, Chen TX, Huang RF, Shi MJ, Xu H. Intercellular mitochondrial transfer as a means of revitalizing injured glomerular endothelial cells. World J Stem Cells 2022; 14(9): 729-743
- URL: https://www.wjgnet.com/1948-0210/full/v14/i9/729.htm
- DOI: https://dx.doi.org/10.4252/wjsc.v14.i9.729


