Copyright
©The Author(s) 2022.
World J Stem Cells. Sep 26, 2022; 14(9): 714-728
Published online Sep 26, 2022. doi: 10.4252/wjsc.v14.i9.714
Published online Sep 26, 2022. doi: 10.4252/wjsc.v14.i9.714
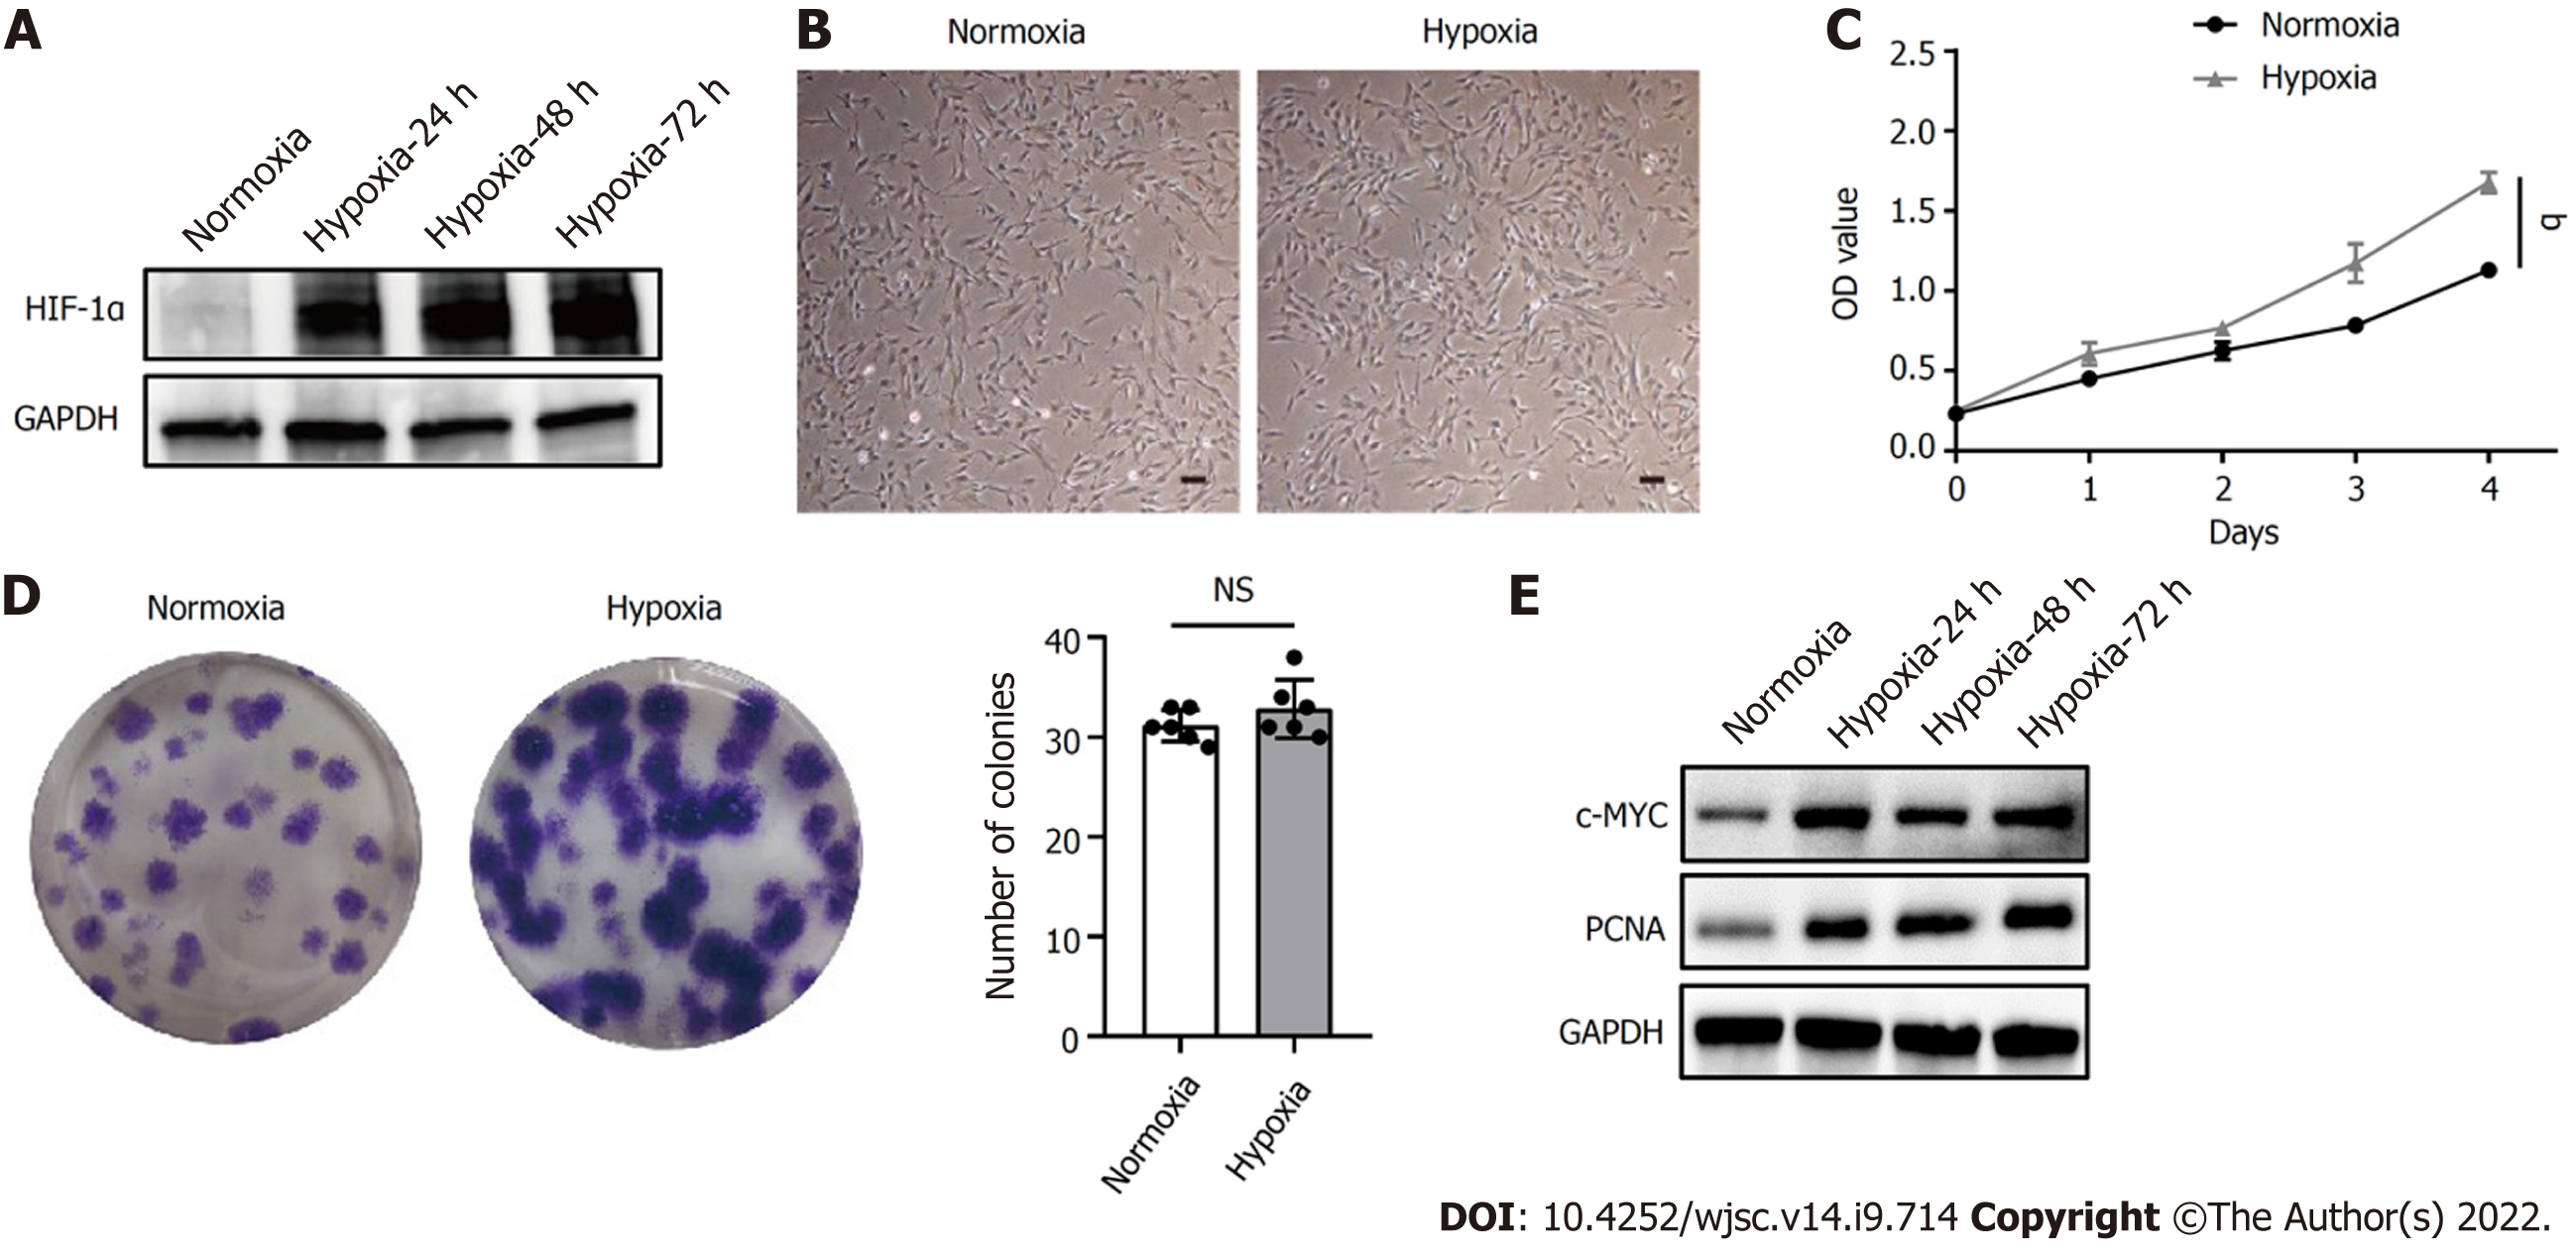
Figure 1 Hypoxia facilitated human placenta-derived mesenchymal stem cell growth and proliferation.
A: Western blot analysis of hypoxia-inducible factor 1α expression in human placenta-derived mesenchymal stem cells (hP-MSCs) under hypoxic culture for 24, 48, or 72 h; B: Morphology of the cultured hP-MSCs under hypoxia (scale bars, 100 μm); C: Proliferation curves of hP-MSCs were established based on cumulative cell numbers at different incubation times (0, 1, 2, 3, and 4 d) under normoxia or hypoxia; D: Colony size and colony number of hP-MSCs under normoxic or hypoxic culture (n = 6); E: The protein expression of c-MYC and proliferating cell nuclear antigen in hP-MSCs under hypoxic culture for 24, 48, or 72 h. Data are presented as means ± SD. aP < 0.05. NS: No significance; PCNA: Proliferating cell nuclear antigen; HIF-1α: Hypoxia-inducible factor 1α.
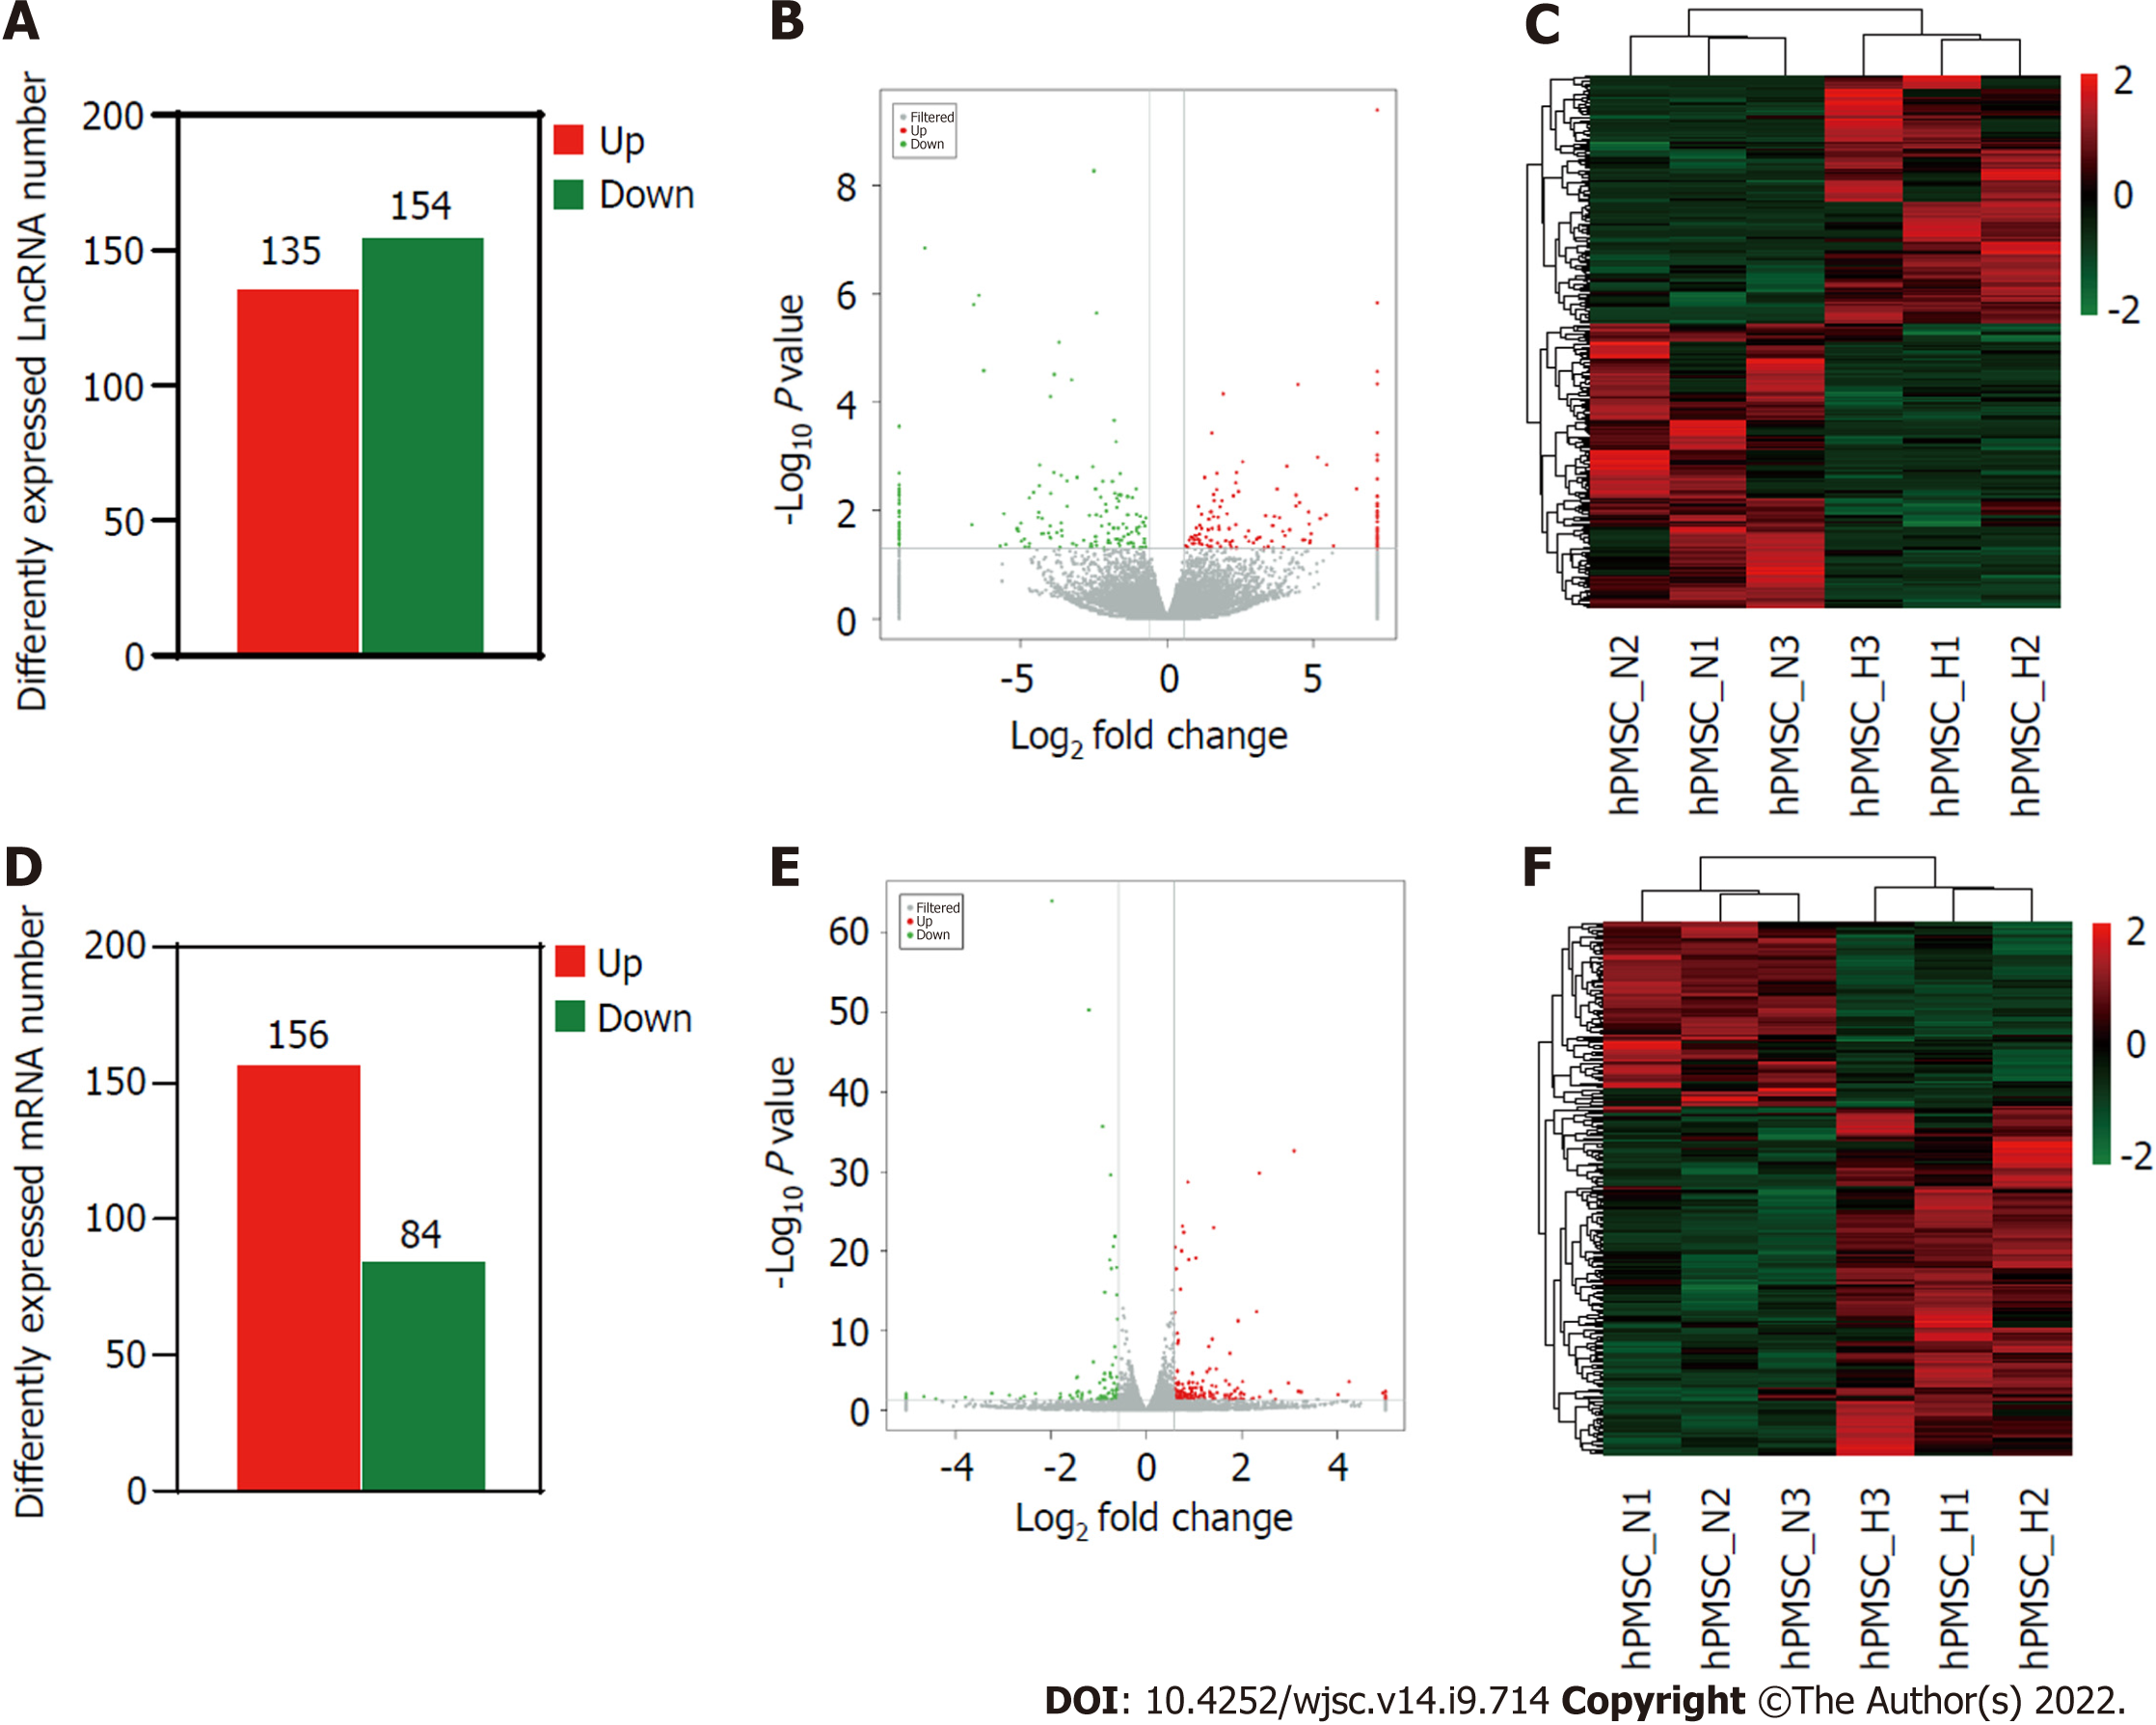
Figure 2 Long non-coding RNAs and messenger RNA expression profiles under hypoxia and normoxia.
A: Number of differentially expressed long non-coding (lnc)RNAs between hypoxia and normoxia; B: Volcano plot depicting differentially expressed lncRNAs between hypoxia and normoxia; C: Heatmap of all differentially expressed lncRNAs identified in hypoxia vs normoxia; D: Number of differentially expressed messenger (m)RNAs; E: Volcano plot of differentially expressed mRNAs; F: Heatmap showing hierarchical clustering of differentially expressed mRNAs.
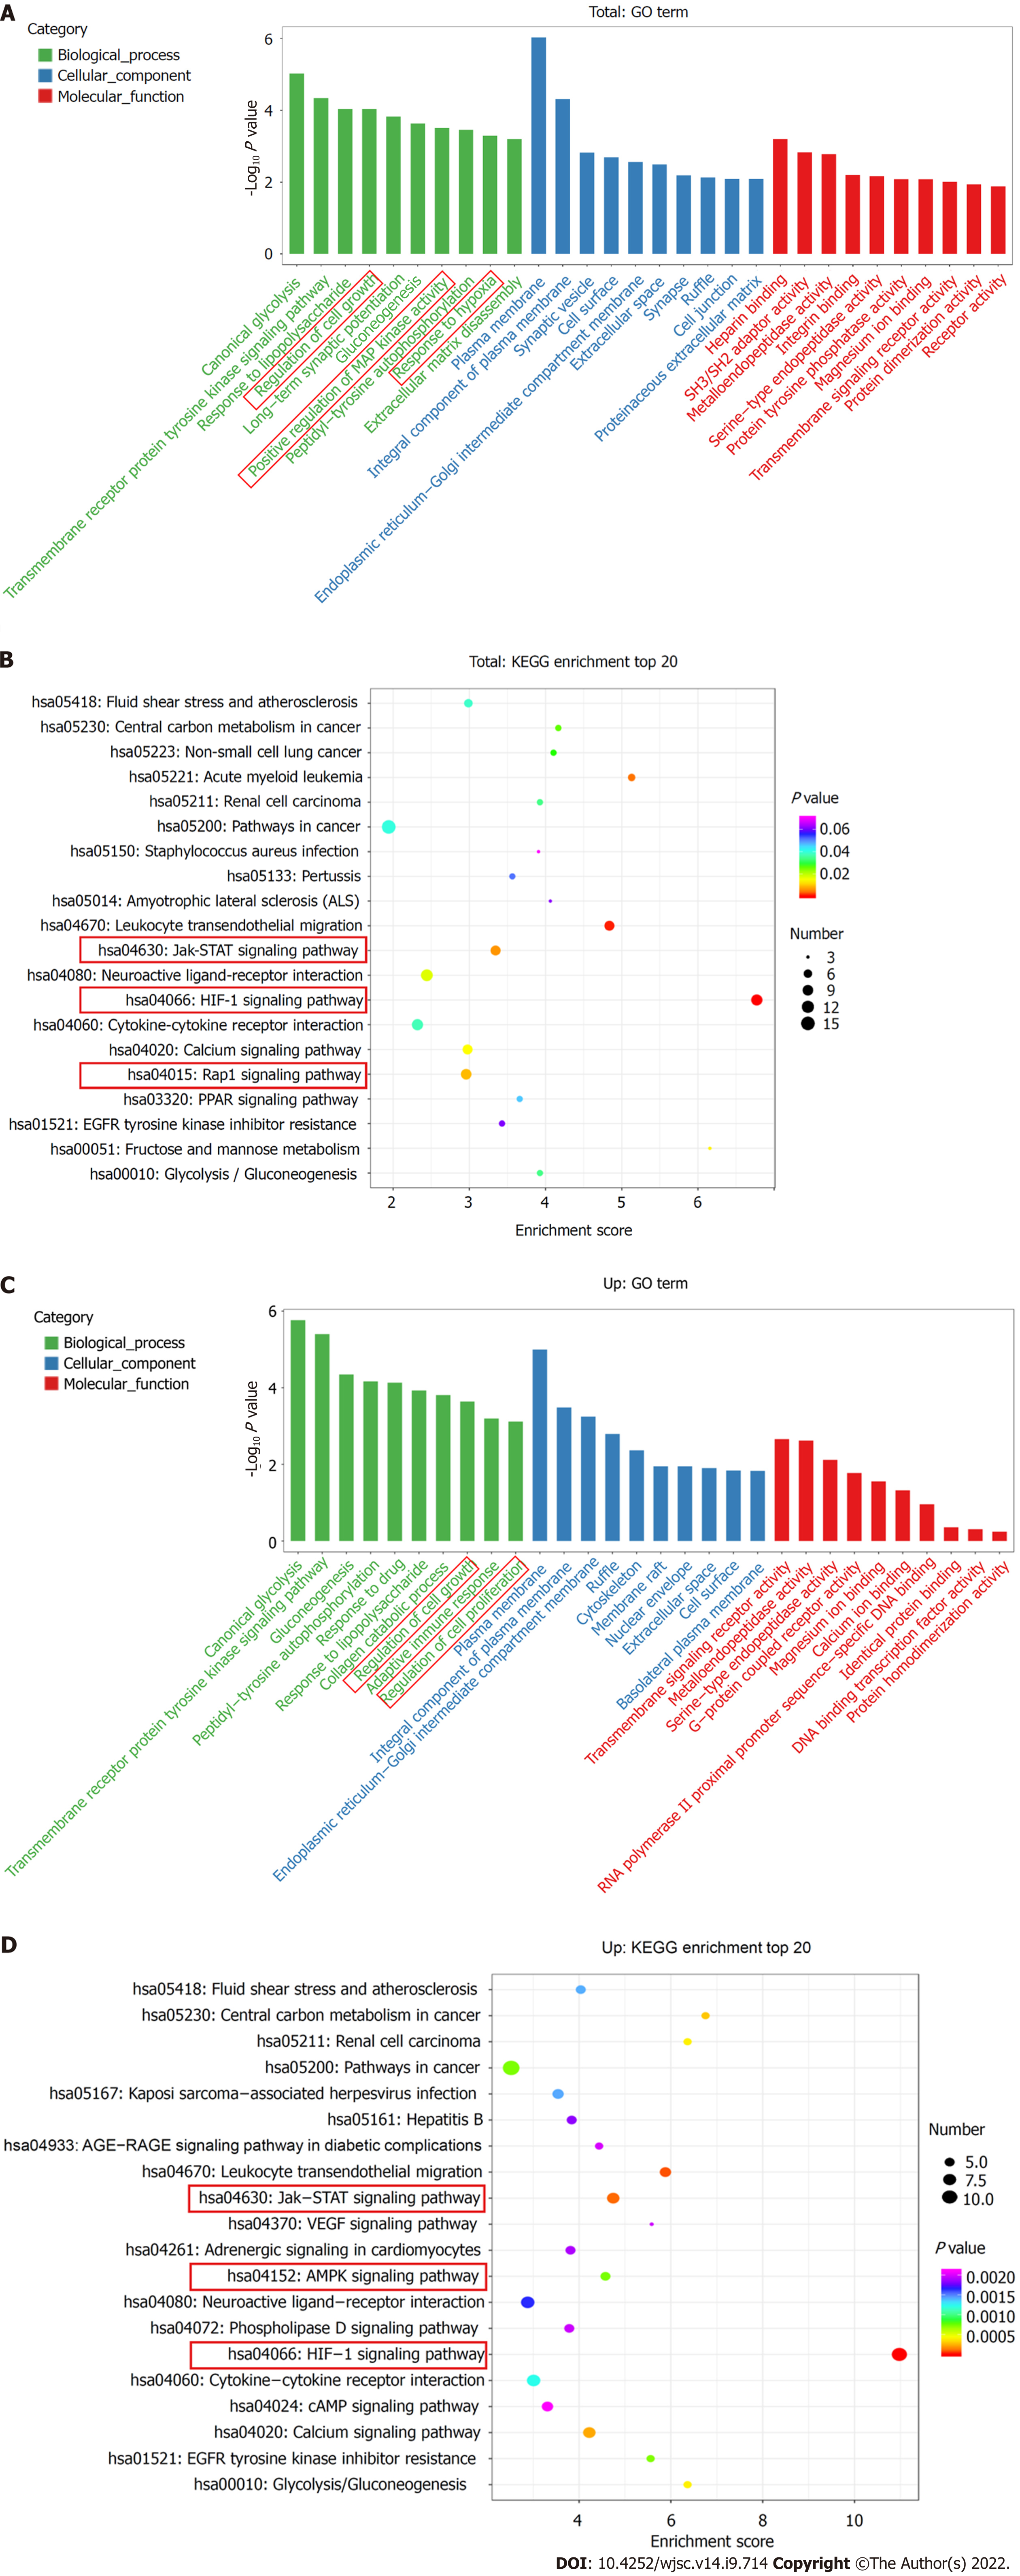
Figure 3 Gene Ontology terms and Kyoto Encyclopedia of Genes and Genomes pathway analyses.
A: Enrichment of biological process, cellular component, and molecular function in all differentially expressed messenger RNAs (mRNAs); B: Kyoto Encyclopedia of Genes and Genomes (KEGG) pathway enrichment of all differentially expressed mRNAs; the top 20 are listed; C: Gene Ontology (GO) annotation and functional enrichment of upregulated mRNAs; D: KEGG pathway enrichment analysis of upregulated mRNAs.
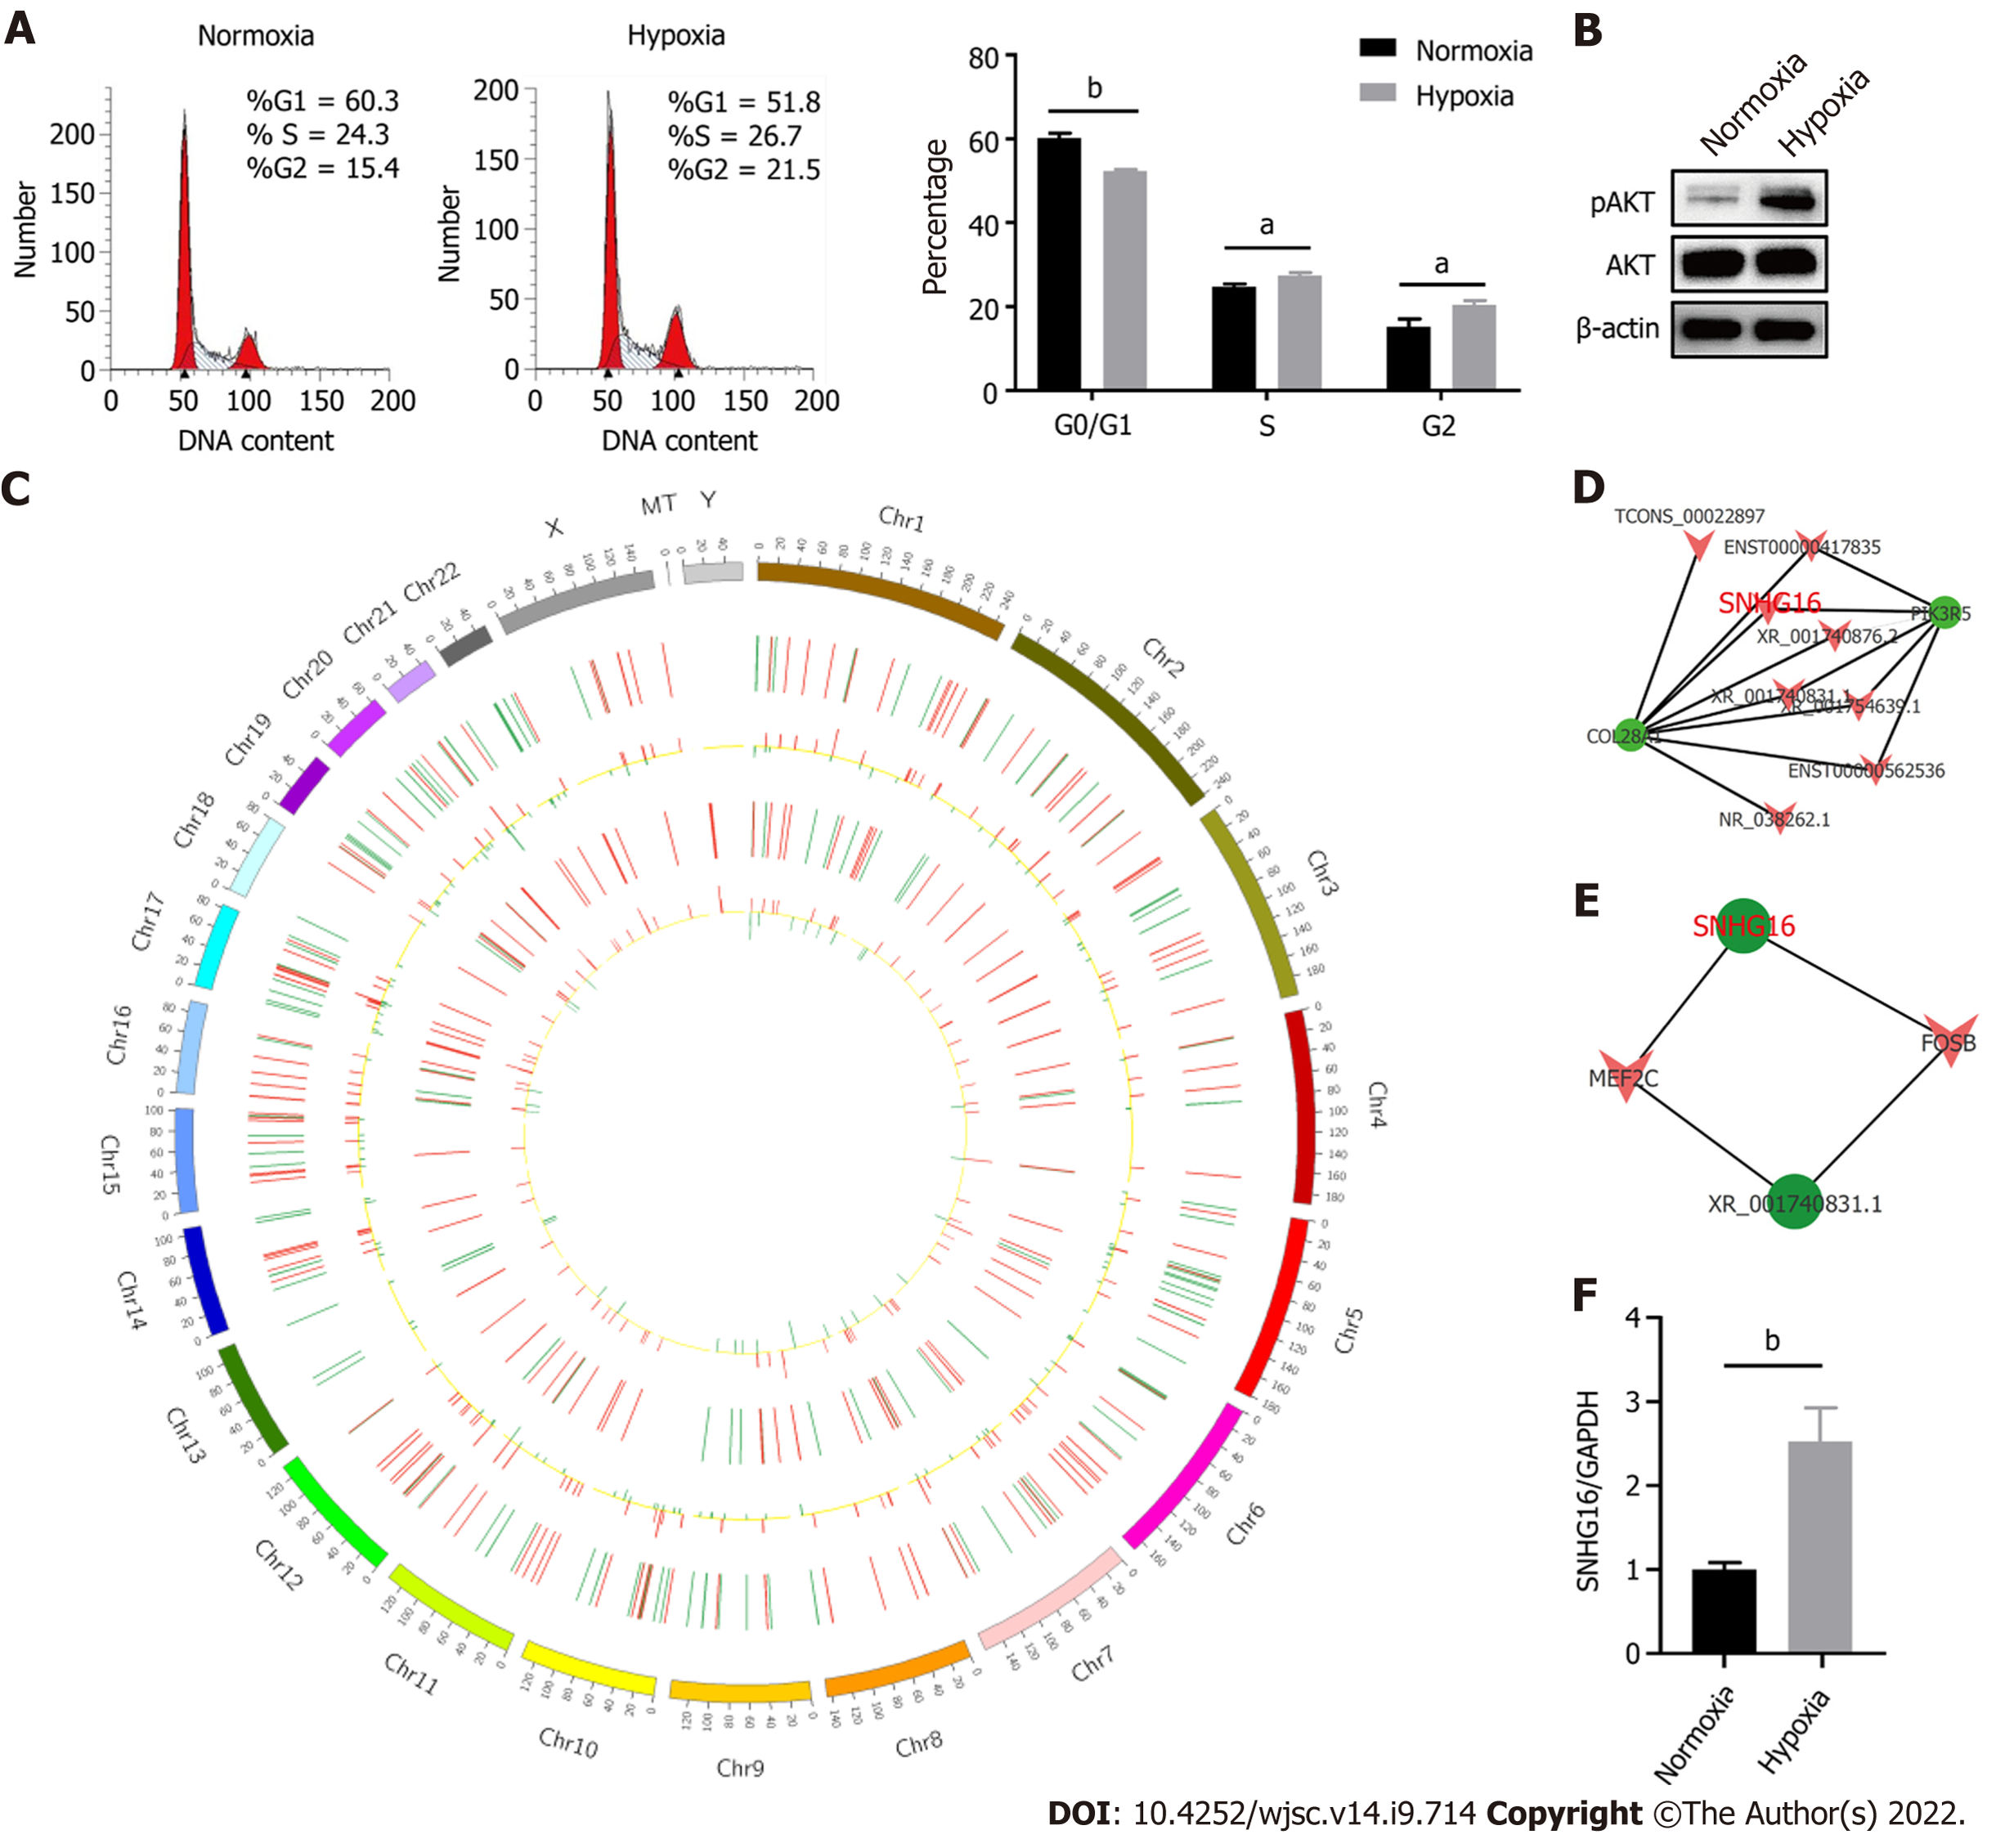
Figure 4 SNHG16 was a potential promotor of human placenta-derived mesenchymal stem cell proliferation ability.
A: Cell cycle analysis of human placenta-derived mesenchymal stem cells (hP-MSCs) under hypoxic culture via flow cytometry; B: Western blot analysis of AKT phosphorylation in hP-MSCs exposed to hypoxia; C: Circos plot of the long non-coding RNAs (lncRNAs)-messenger (m)RNA co-expression network. The outermost circle is the autosomal distribution. The second and third circles are the distribution of differentially expressed lncRNAs on chromosomes. The red line represents upregulation, and the green line represents downregulation. Higher bars indicate a greater number of differential genes in the interval. The fourth and fifth circles are the distribution of differentially expressed genes on chromosomes, with the same interpretation as lncRNA; D: Part of lncRNA-mRNA interaction network analysis visualized using the Cytoscape software; E: Part of the association analysis of differentially expressed lncRNAs and transcription factors; F: Effects of hypoxia on the expression of SNHG16 in hP-MSCs by quantitative reverse transcription polymerase chain reaction. Data are presented as means ± standard deviation. bP < 0.01.
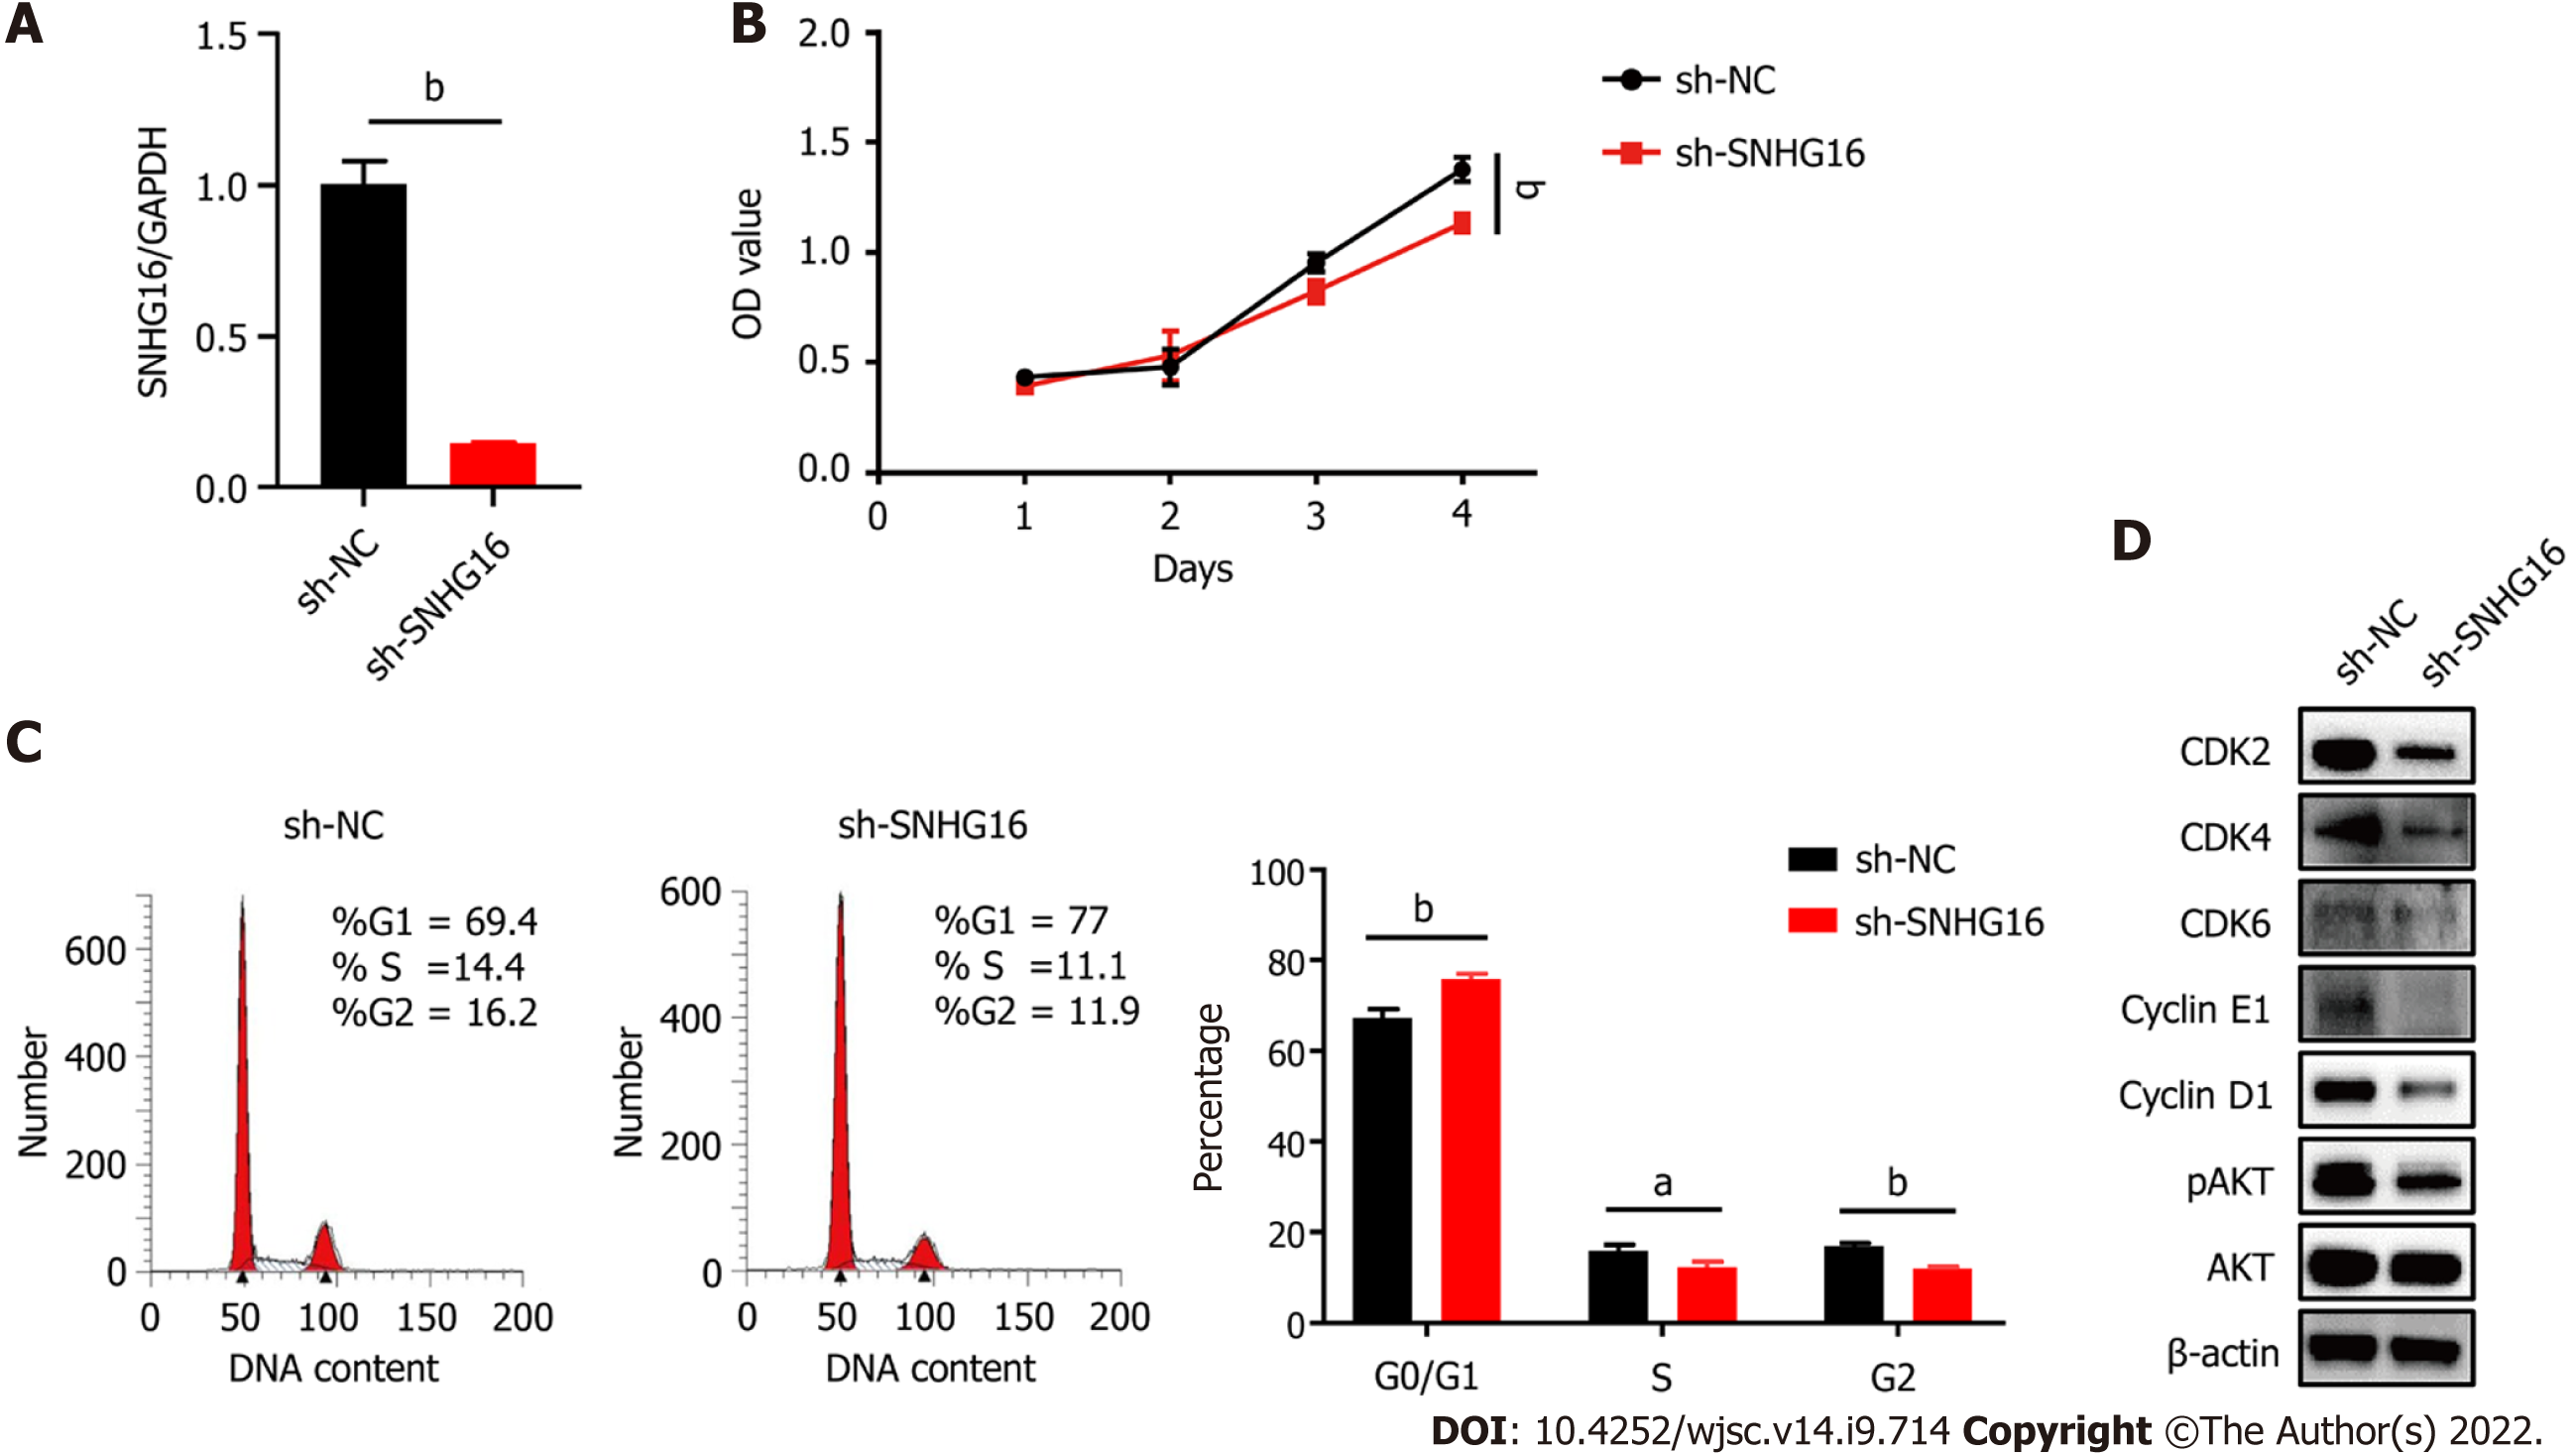
Figure 5 Knockdown of SNHG16 attenuated the proliferation ability of human placenta-derived mesenchymal stem cells.
A: Quantitative reverse transcription polymerase chain reaction analysis of relative SNHG16 expression after transfection of SNHG16 short hairpin RNA (sh-SNHG16) and the corresponding controls (sh-NC) in human placenta-derived mesenchymal stem cells; B: Cell proliferation capacity evaluated by cell counting kit-8 assay; C: Cell cycle measured by flow cytometry; D: The G1 to S phase transition-related proteins and p-AKT detected by western blot analysis. Data are presented as means ± standard deviation. bP < 0.01.
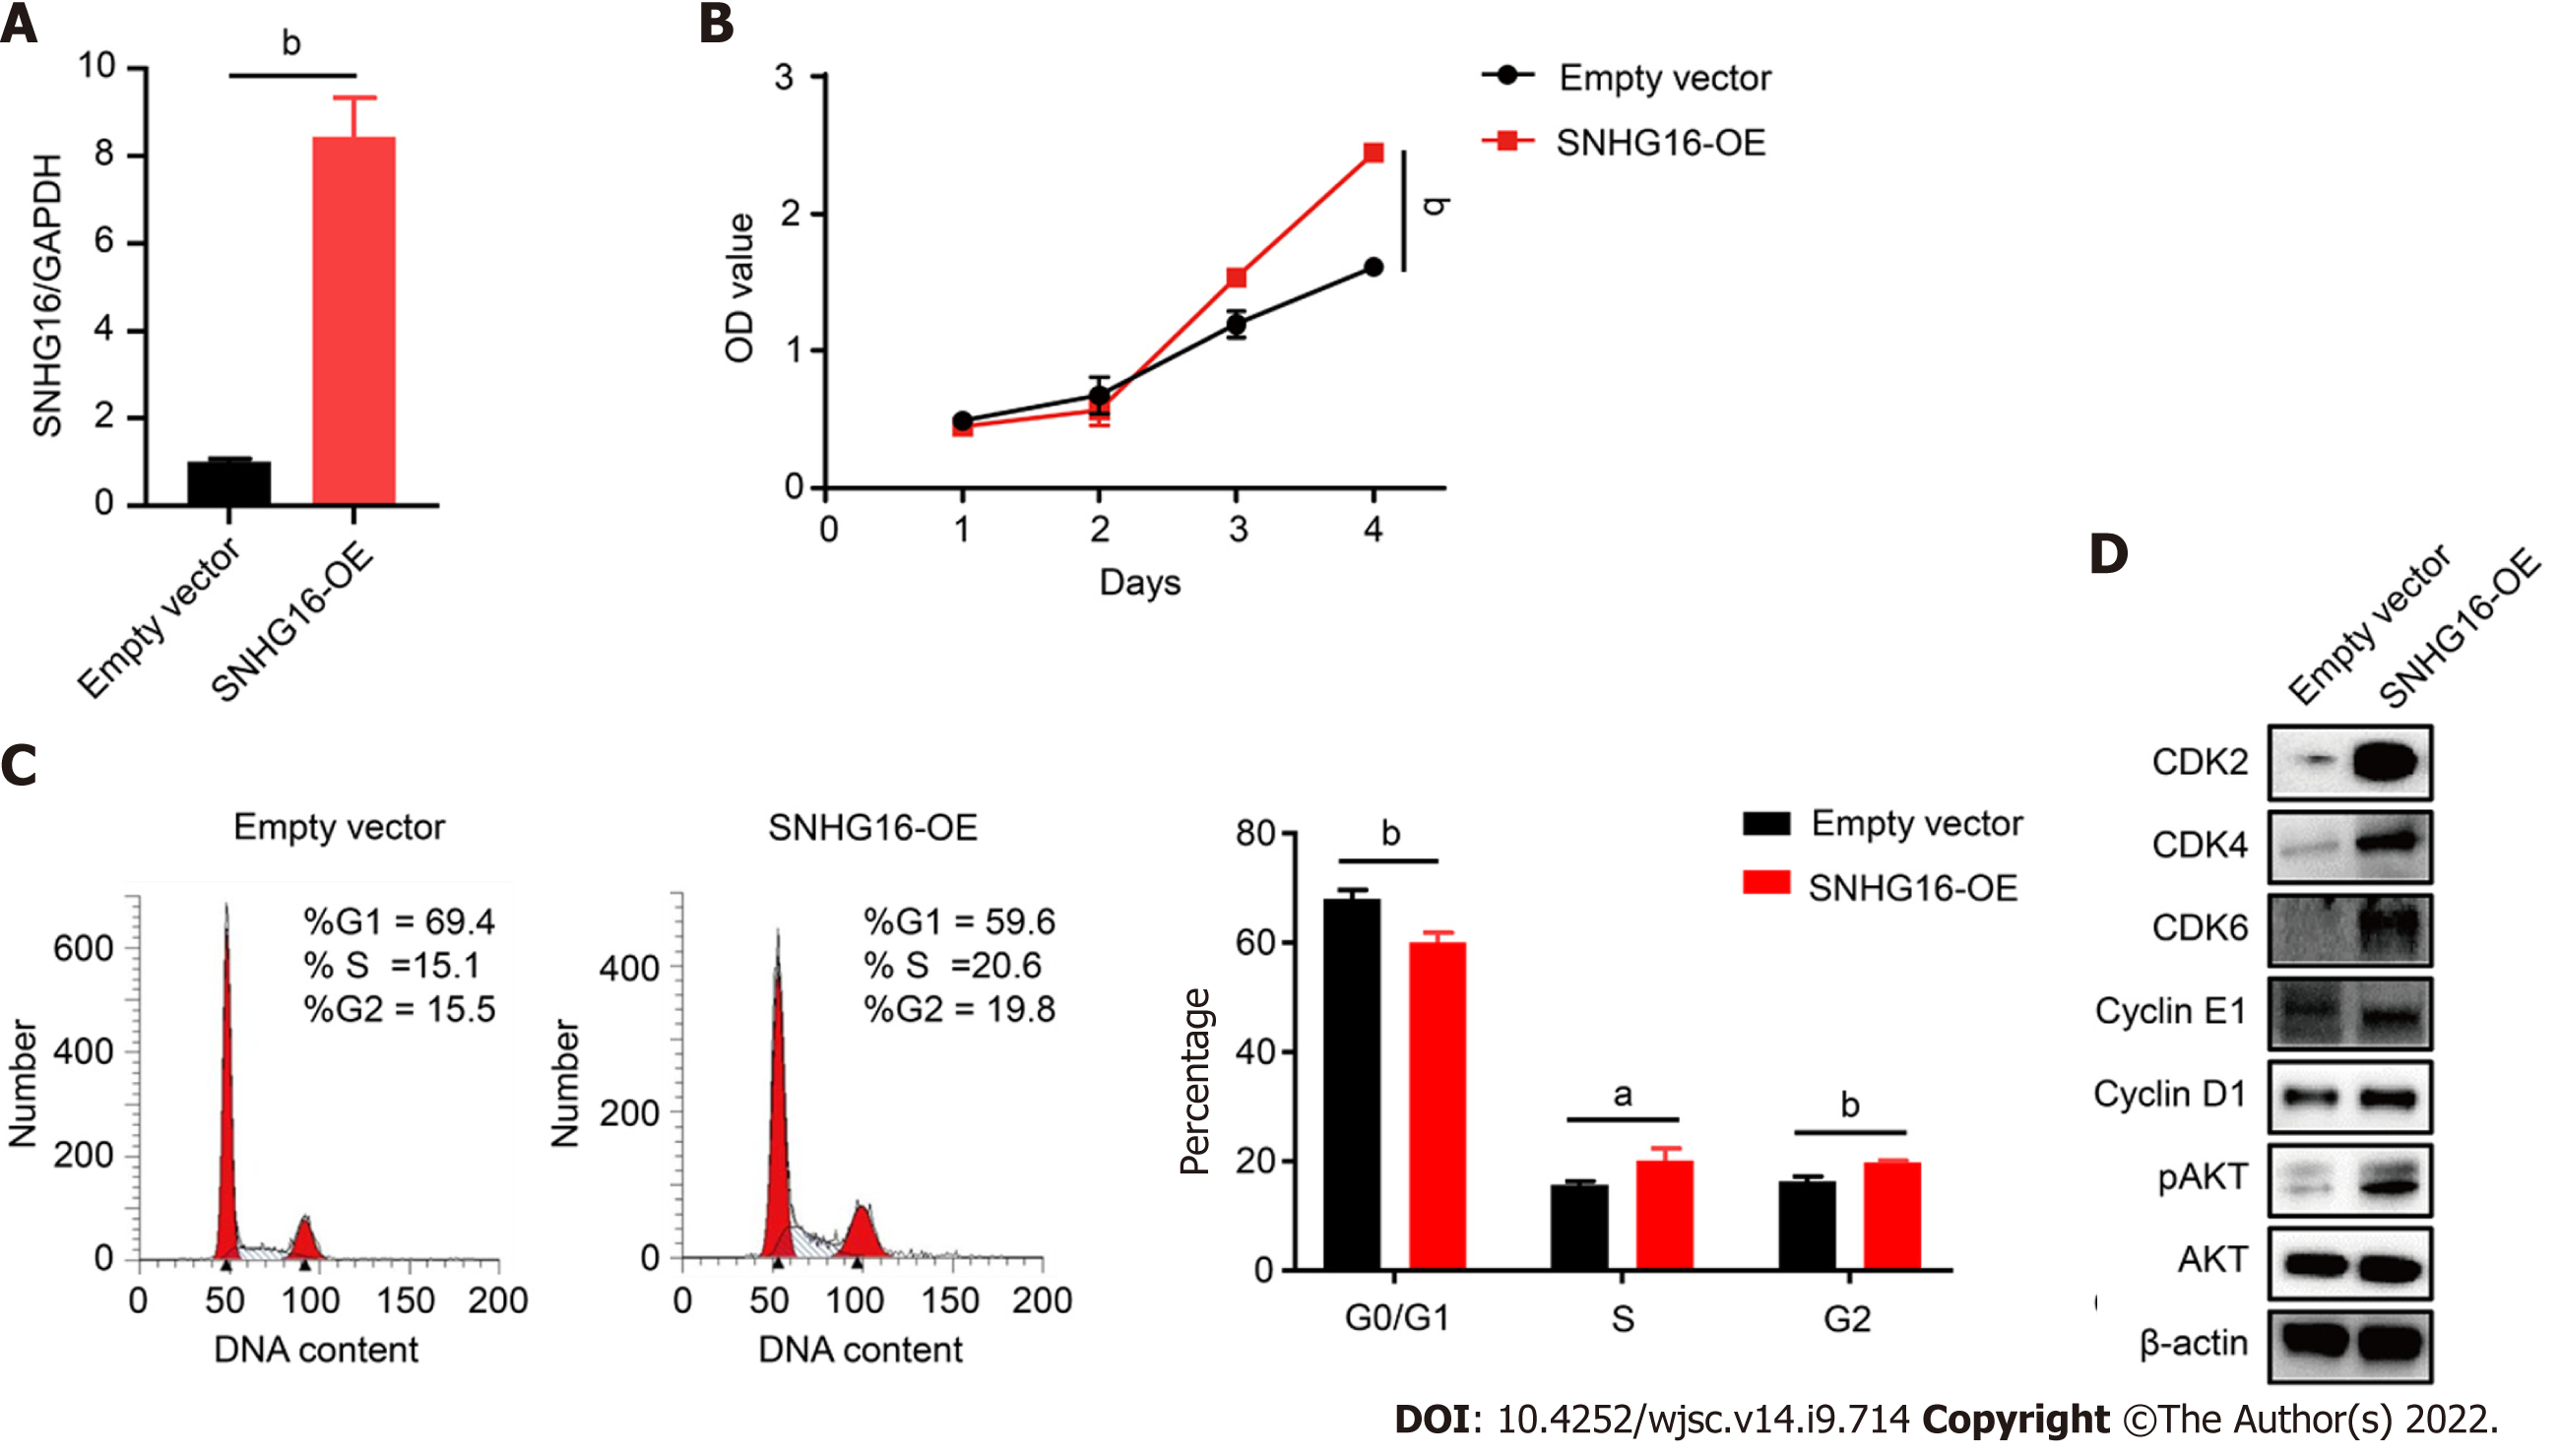
Figure 6 SNHG16 overexpression resulted in activation of the PI3K/AKT pathway and a significant enhancement in the proliferative rate of human placenta-derived mesenchymal stem cells.
A: Quantitative reverse transcription polymerase chain reaction analysis of relative SNHG16 expression after transfection of lentivirus overexpressing SNHG16 (SNHG16-OE) and the corresponding empty vector in human placenta-derived mesenchymal stem cells; B: Cell proliferation after SNHG16 overexpression was evaluated by cell counting kit-8 assay; C: Cell cycle distribution after SNHG16 overexpression was evaluated by flow cytometry; D: The expression levels of CDK2, CDK4, CDK6, cyclin E1, cyclin D1, and phosphorylated AKT. Data are presented as the means ± SD obtained from three separate experiments. bP < 0.01.
- Citation: Feng XD, Zhou JH, Chen JY, Feng B, Hu RT, Wu J, Pan QL, Yang JF, Yu J, Cao HC. Long non-coding RNA SNHG16 promotes human placenta-derived mesenchymal stem cell proliferation capacity through the PI3K/AKT pathway under hypoxia. World J Stem Cells 2022; 14(9): 714-728
- URL: https://www.wjgnet.com/1948-0210/full/v14/i9/714.htm
- DOI: https://dx.doi.org/10.4252/wjsc.v14.i9.714


