Copyright
©The Author(s) 2022.
World J Stem Cells. Aug 26, 2022; 14(8): 599-615
Published online Aug 26, 2022. doi: 10.4252/wjsc.v14.i8.599
Published online Aug 26, 2022. doi: 10.4252/wjsc.v14.i8.599
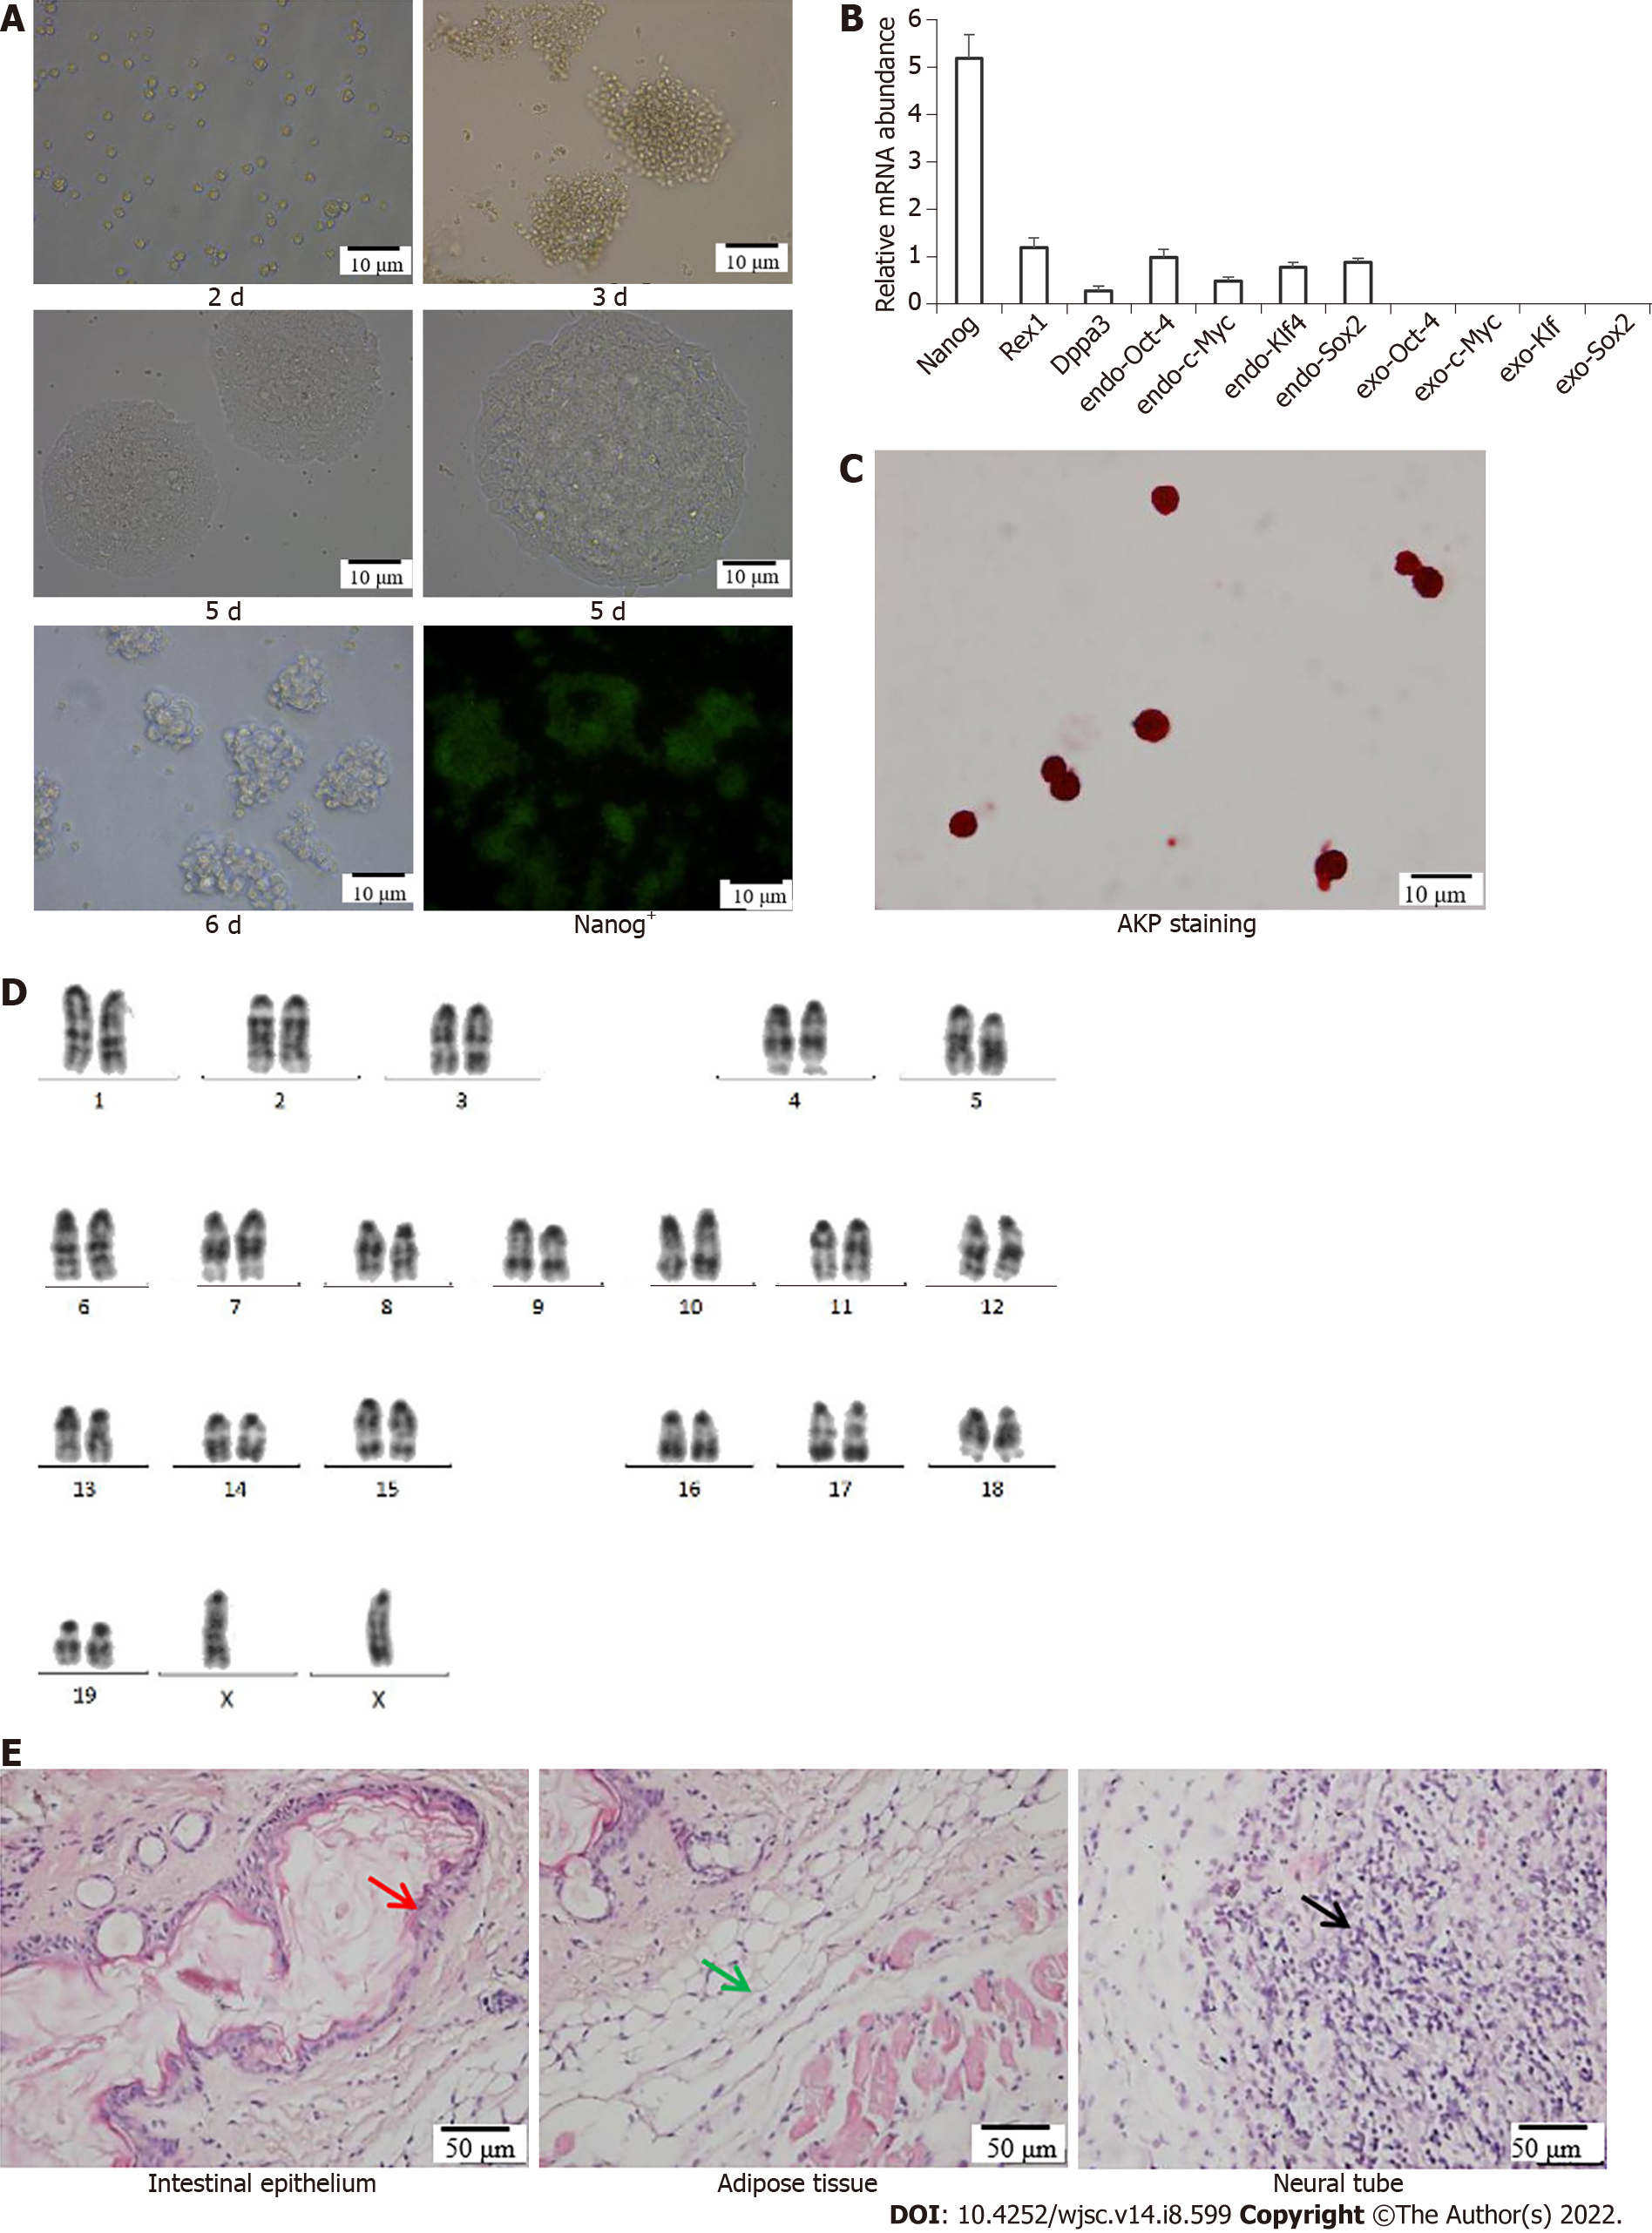
Figure 1 Induced pluripotent stem cells culture and identification.
A: Morphological observation and cell cloning of induced pluripotent stem cells (iPSCs) at 2 d, 3 d, 5 d and 6 d and Nanog+-iPSCs in culture; B: Quantitative polymerase chain reaction identification; C: Alkaline phosphatase staining; D: Chromosome identification; E: Teratoma formation; red arrow = intestinal epithelium (endoderm), green arrow = muscle tissue (mesoderm), and black arrow = nerve tissue (endoderm). AKP: Alkaline phosphatase.
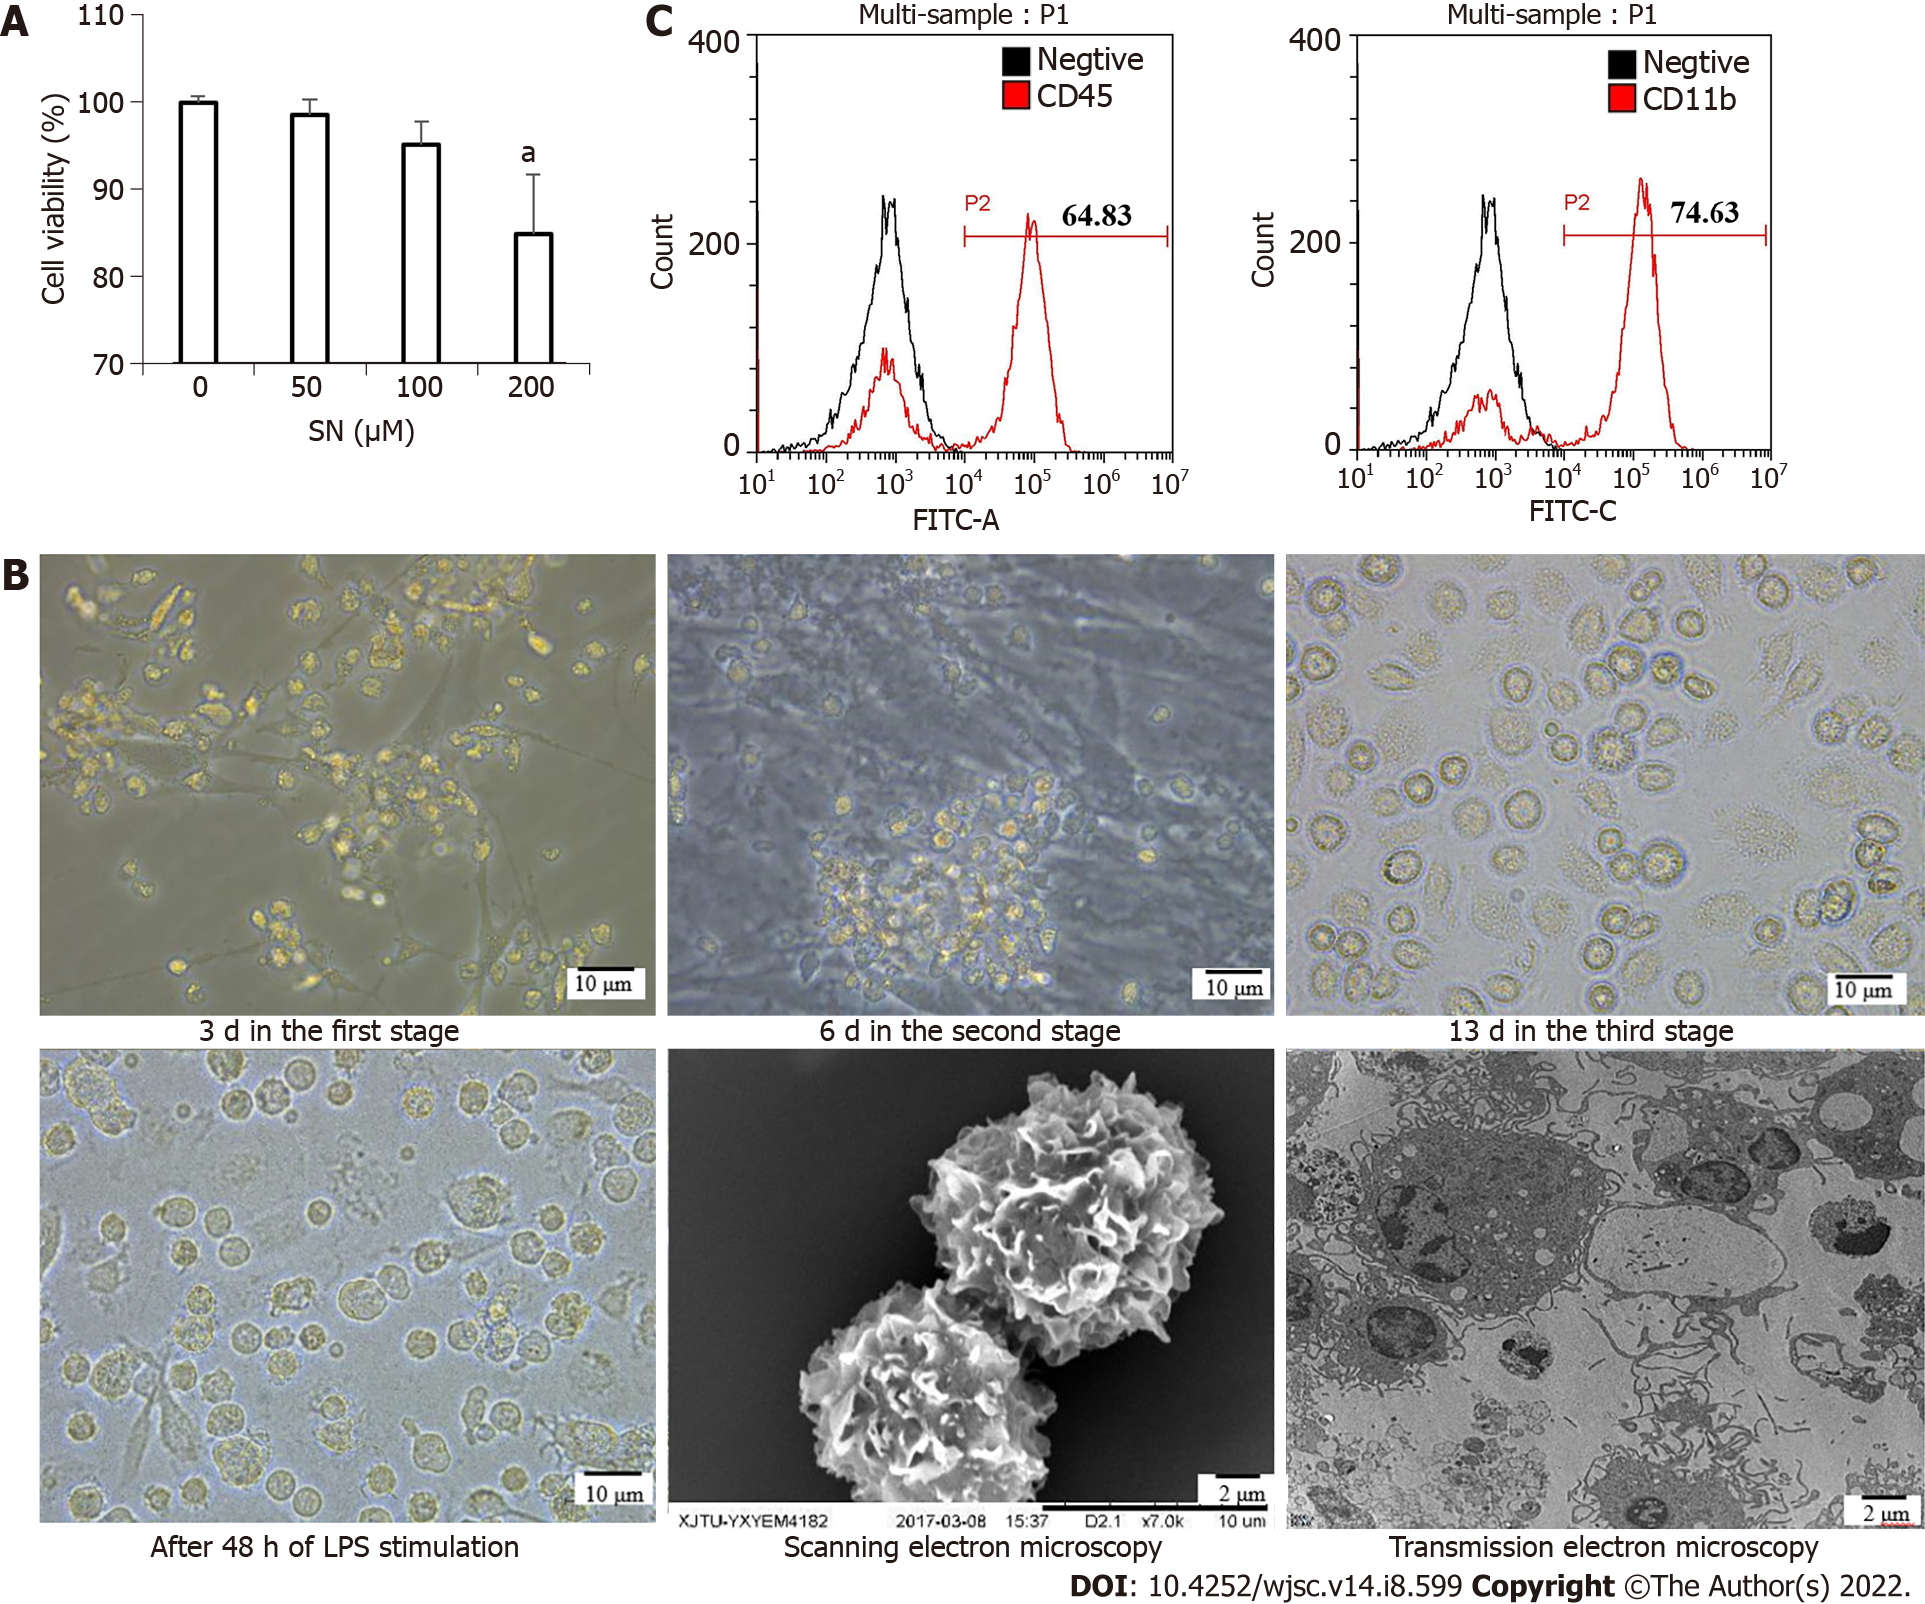
Figure 2 Morphological changes from induced pluripotent stem cells to induced pluripotent stem cells-dendritic cells.
A: The optimal concentration of sinomenine (SN) was 100 μM; B: Morphological changes from induced pluripotent stem cells (iPSCs) to iPSCs-dendritic cells (DCs) at 3 d in the first stage; iPSC-derived hematopoietic cells at 6 d in the second stage; and iPSC-derived imDCs at 13 d in the third stage under the influence of SN. After 48 h of lipopolysaccharide stimulation, the morphology of SN-iPSCs-DCs in phase contrast microscopy, scanning electron microscopy and transmission electron microscopy; C: Expression of the cell surface markers CD45 and CD11b from iPSCs to iPSCs–DCs under the influence of SN on day 6 in the second stage. SN: Sinomenine.
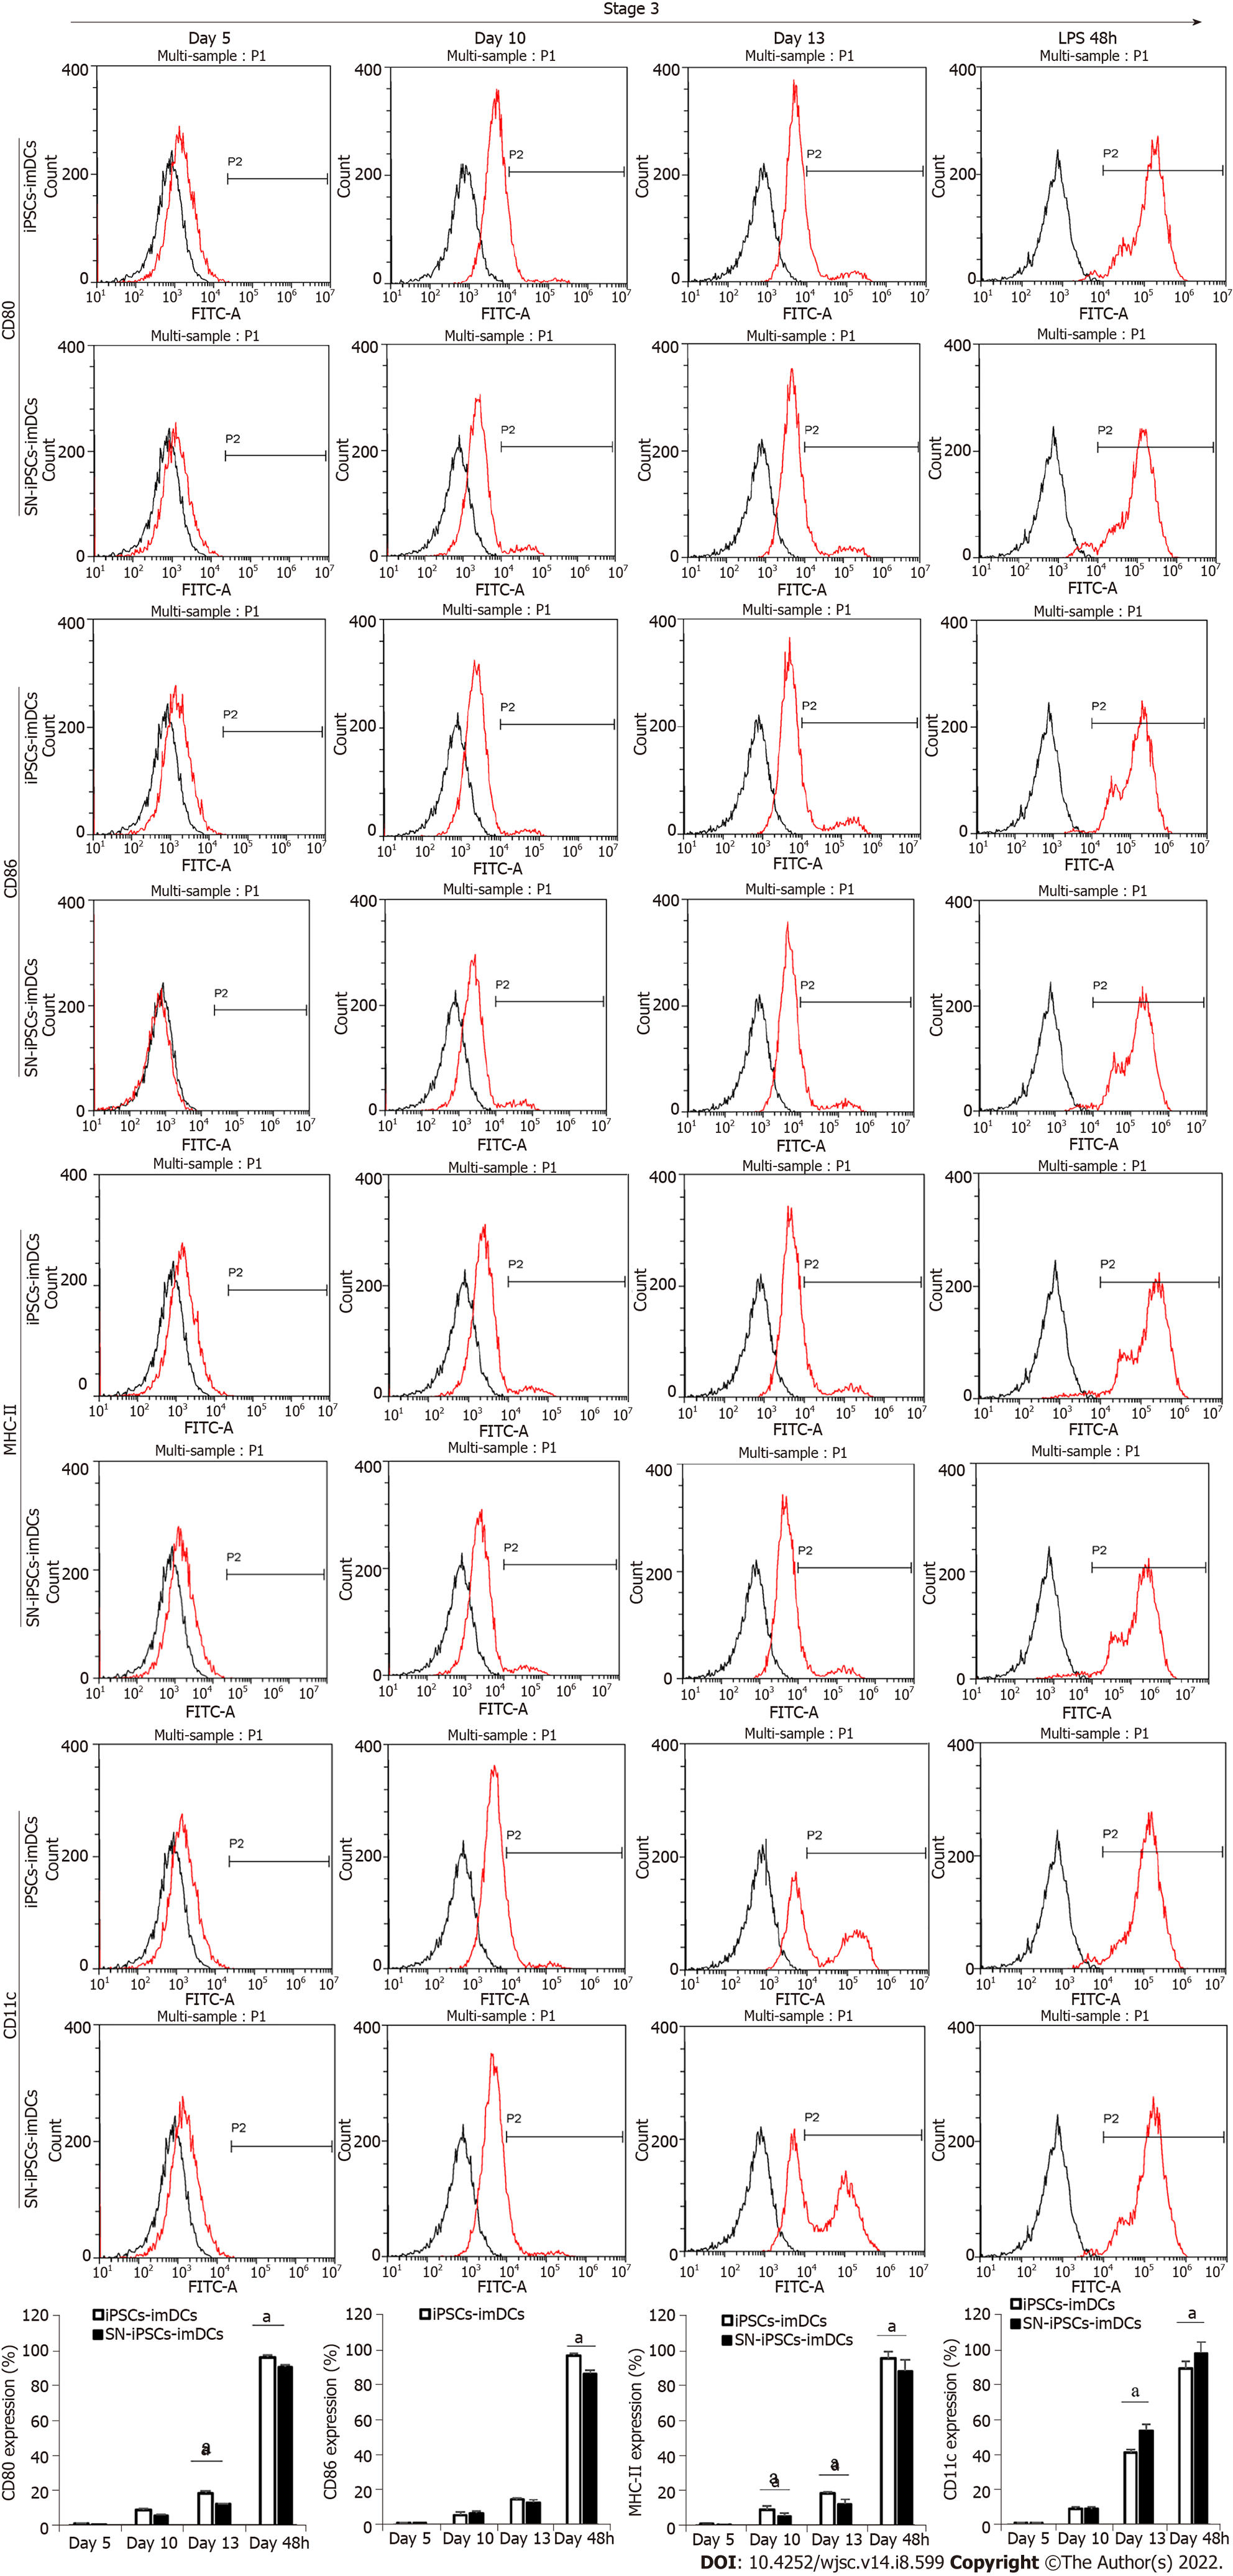
Figure 3 Immature dendritic cells surface phenotypes in differentiation culture.
CD80, CD86, MHC-II and CD11c expression from induced pluripotent stem cells (iPSCs) to iPSCs-immature dendritic cells in the presence of sinomenine on days 5, 10 and 13 in stage 3 and after lipopolysaccharide stimulation for 48 h. Compared with iPSCs-dendritic cells group at the same time, aP < 0.05. SN: Sinomenine; iPSCs: Induced pluripotent stem cells; imDCs: Immature dendritic cells.
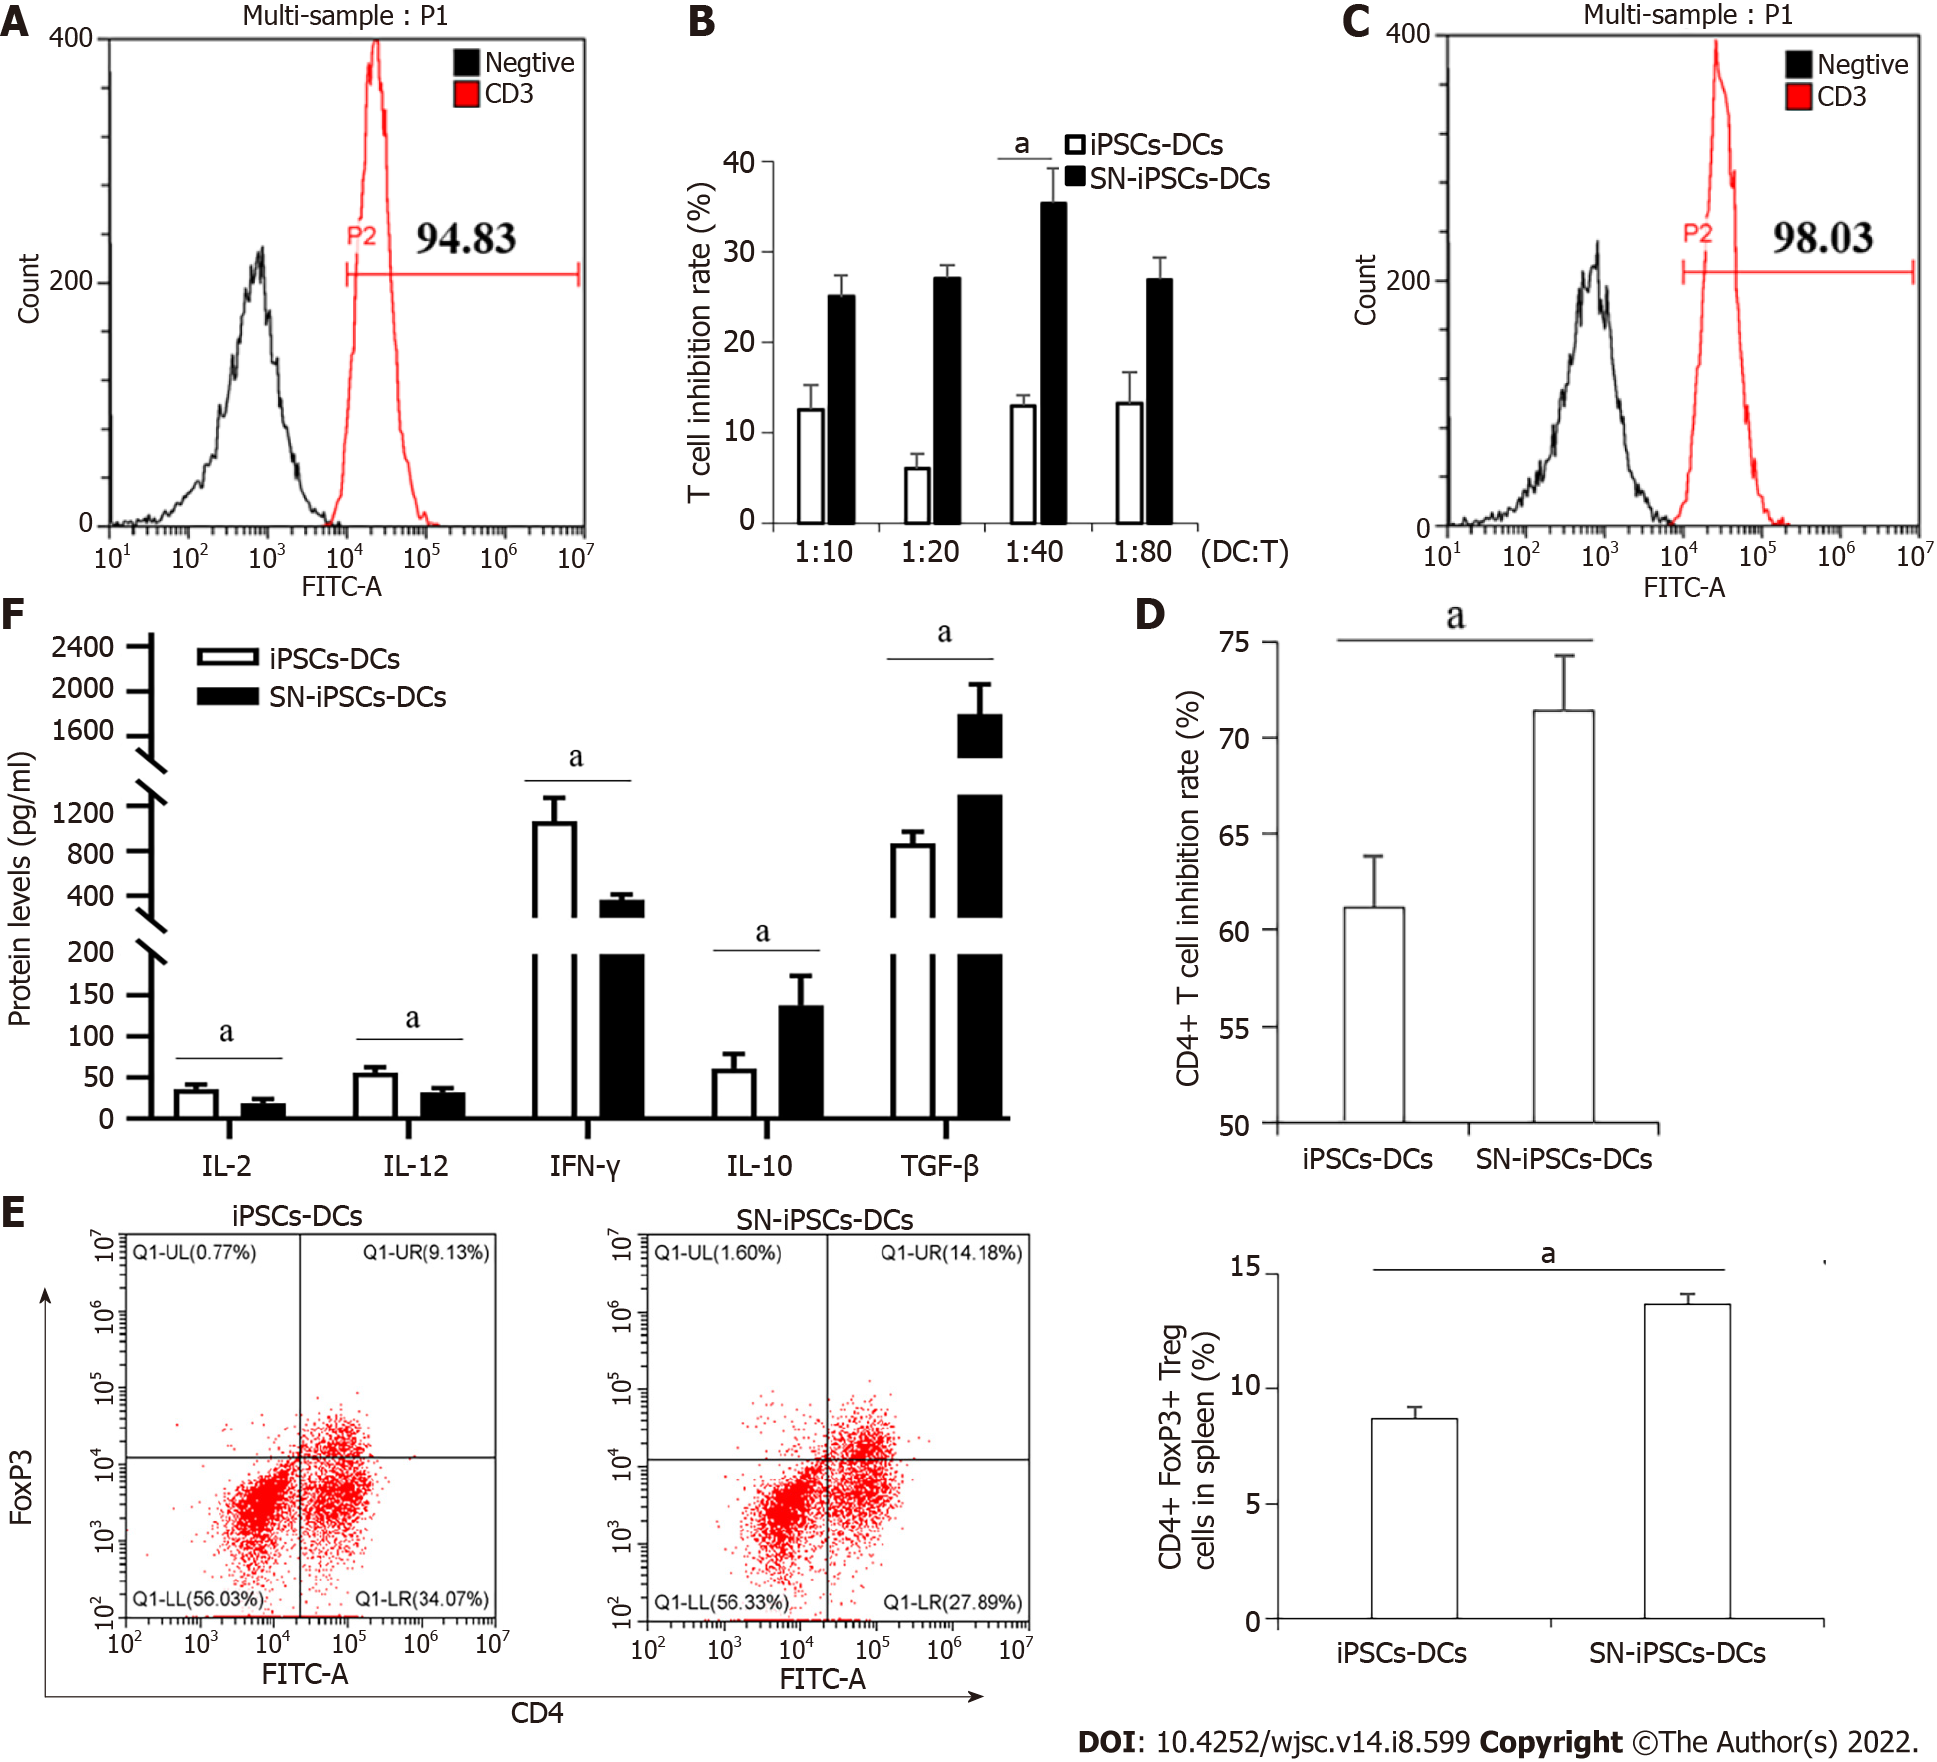
Figure 4 Sinomenine-induced pluripotent stem cells–immature dendritic cells suppress T cell proliferation and enhanced regulatory T cell proliferation.
A: Purity of CD3+ T cells after sorting; B: Mixed lymphocyte reaction at different proportions of immature dendritic cells: CD3+ T cells. Compared with induced pluripotent stem cells-dendritic cells (iPSCs-DCs) group, aP < 0.05; C: Purity of CD4+ T cells after sorting; D: Mixed culture of iPSCs-DCs or sinomenine (SN)-iPSCs-DCs and CD4+ T cells at 1:40. Compared with iPSCs-DCs group, aP < 0.05; E: Effects of iPSCs-DCs or SN-iPSCs-DCs on regulatory T (Treg) cell proliferation. Compared with iPSCs-DCs group, aP < 0.05; F: Cytokine levels in supernatants from cocultured DCs and Treg cells. Compared with iPSCs-DCs group, aP < 0.05. SN: Sinomenine; iPSCs: Induced pluripotent stem cells; DCs: Dendritic cells; IL: Interleukin; IFN: Interferon; TGF-: Transforming growth factor-.
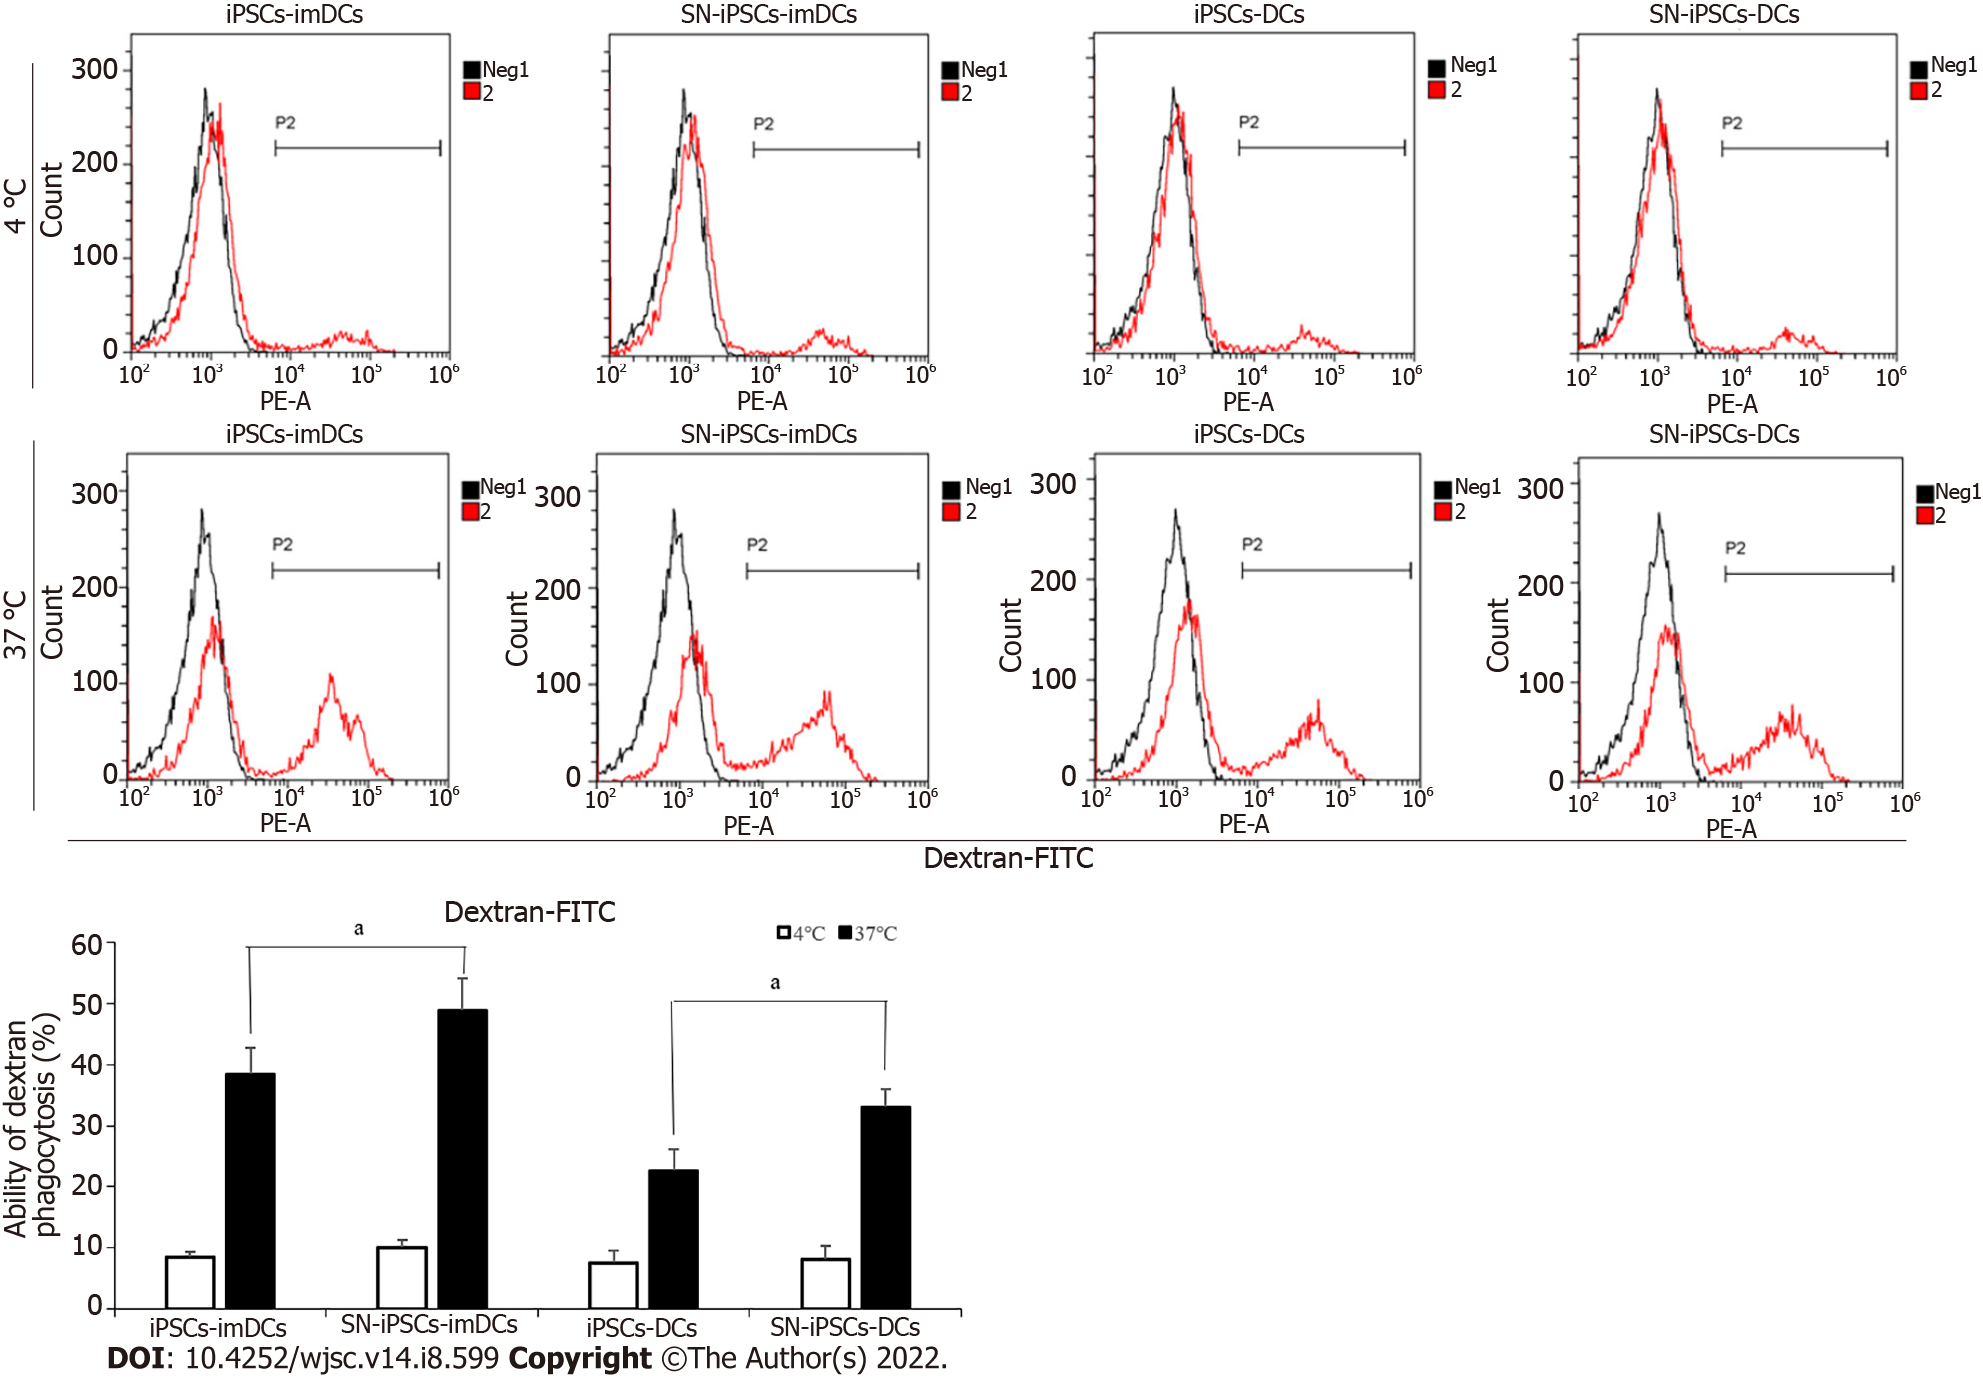
Figure 5 Endocytotic capacity in sinomenine-induced pluripotent stem cells-immature dendritic cells and sinomenine-induced pluripotent stem cells-dendritic cells.
Antigen uptake in induced pluripotent stem cells (iPSCs)-immature dendritic cells (imDCs) and sinomenine (SN)-iPSCs-imDCs. Compared with iPSCs-imDCs group, aP < 0.05; Antigen uptake in iPSCs-DCs and SN-iPSCs-DCs. Compared with iPSCs-DCs group, aP < 0.05. SN: Sinomenine; iPSCs: Induced pluripotent stem cells; DCs: Dendritic cells; imDCs: Immature dendritic cells.
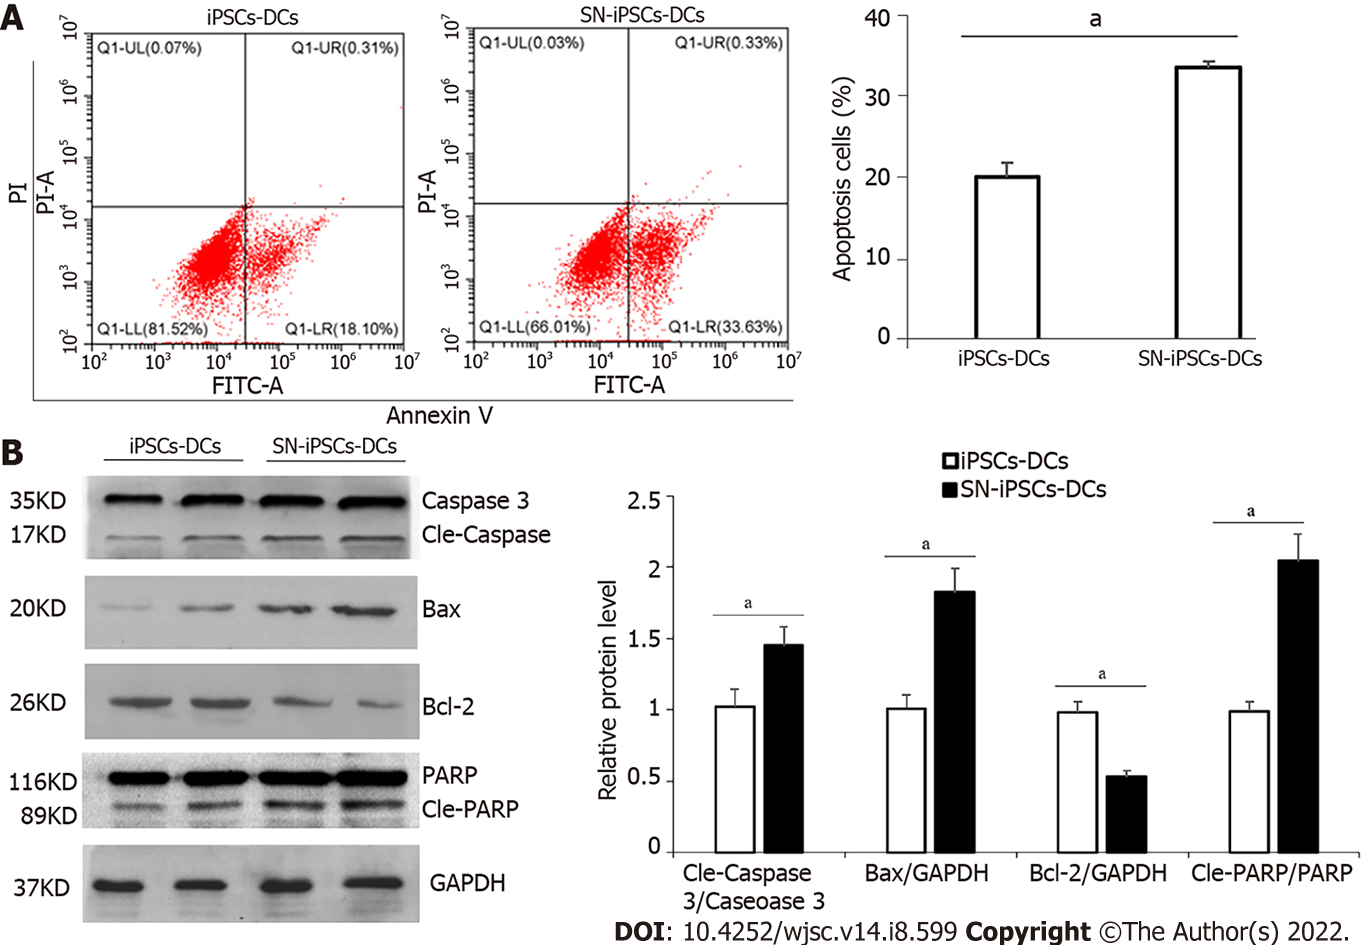
Figure 6 Apoptosis of induced pluripotent stem cells-dendritic cells and sinomenine-induced pluripotent stem cells-dendritic cells stimulated with lipopolysaccharide.
A: Apoptosis rate in induced pluripotent stem cells-dendritic cells (iPSCs-DCs) and sinomenine (SN)-iPSCs-DCs stimulated with lipopolysaccharide (LPS). Compared with iPSCs-DCs group, aP < 0.05; B: Apoptosis-related protein expression in iPSCs-DCs and SN-iPSCs-DCs stimulated with LPS. Compared with iPSCs-DCs group, aP < 0.05. SN: Sinomenine; iPSCs: Induced pluripotent stem cells; DCs: Dendritic cells; PARP: Poly(ADP-ribose) polymerase; GAPDH: Glyceraldehyde 3-phosphate dehydrogenase.
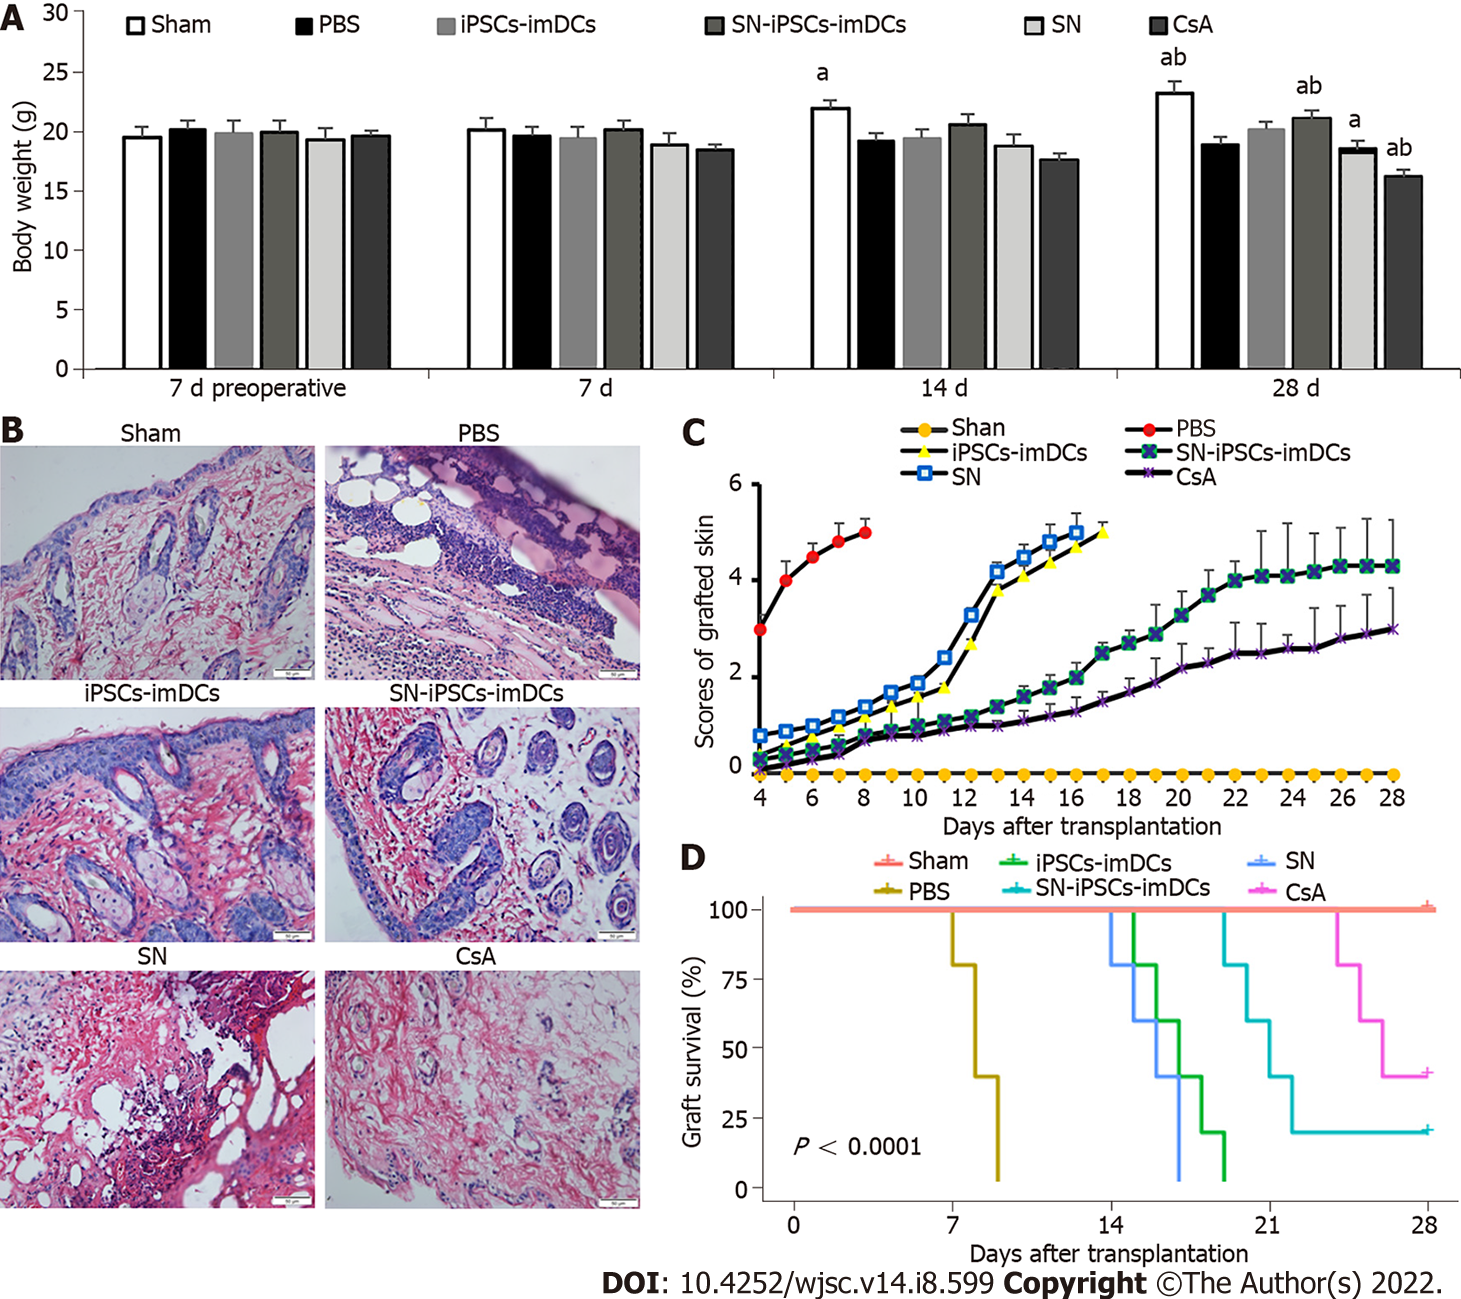
Figure 7 Sinomenine-induced pluripotent stem cells–immature dendritic cells immunization prolonged survival of allogeneic skin grafts.
A: Body weight in all groups. Compared with PBS in the same time, aP < 0.05. Compared with induced pluripotent stem cells-immature dendritic cells group in the same time, bP < 0.05; B: Hematoxylin and eosin staining in all groups; C: Graft scores in all groups; D: Survival curves for all groups. SN: Sinomenine; iPSCs: Induced pluripotent stem cells; DCs: Dendritic cells; imDCs: Immature dendritic cells.
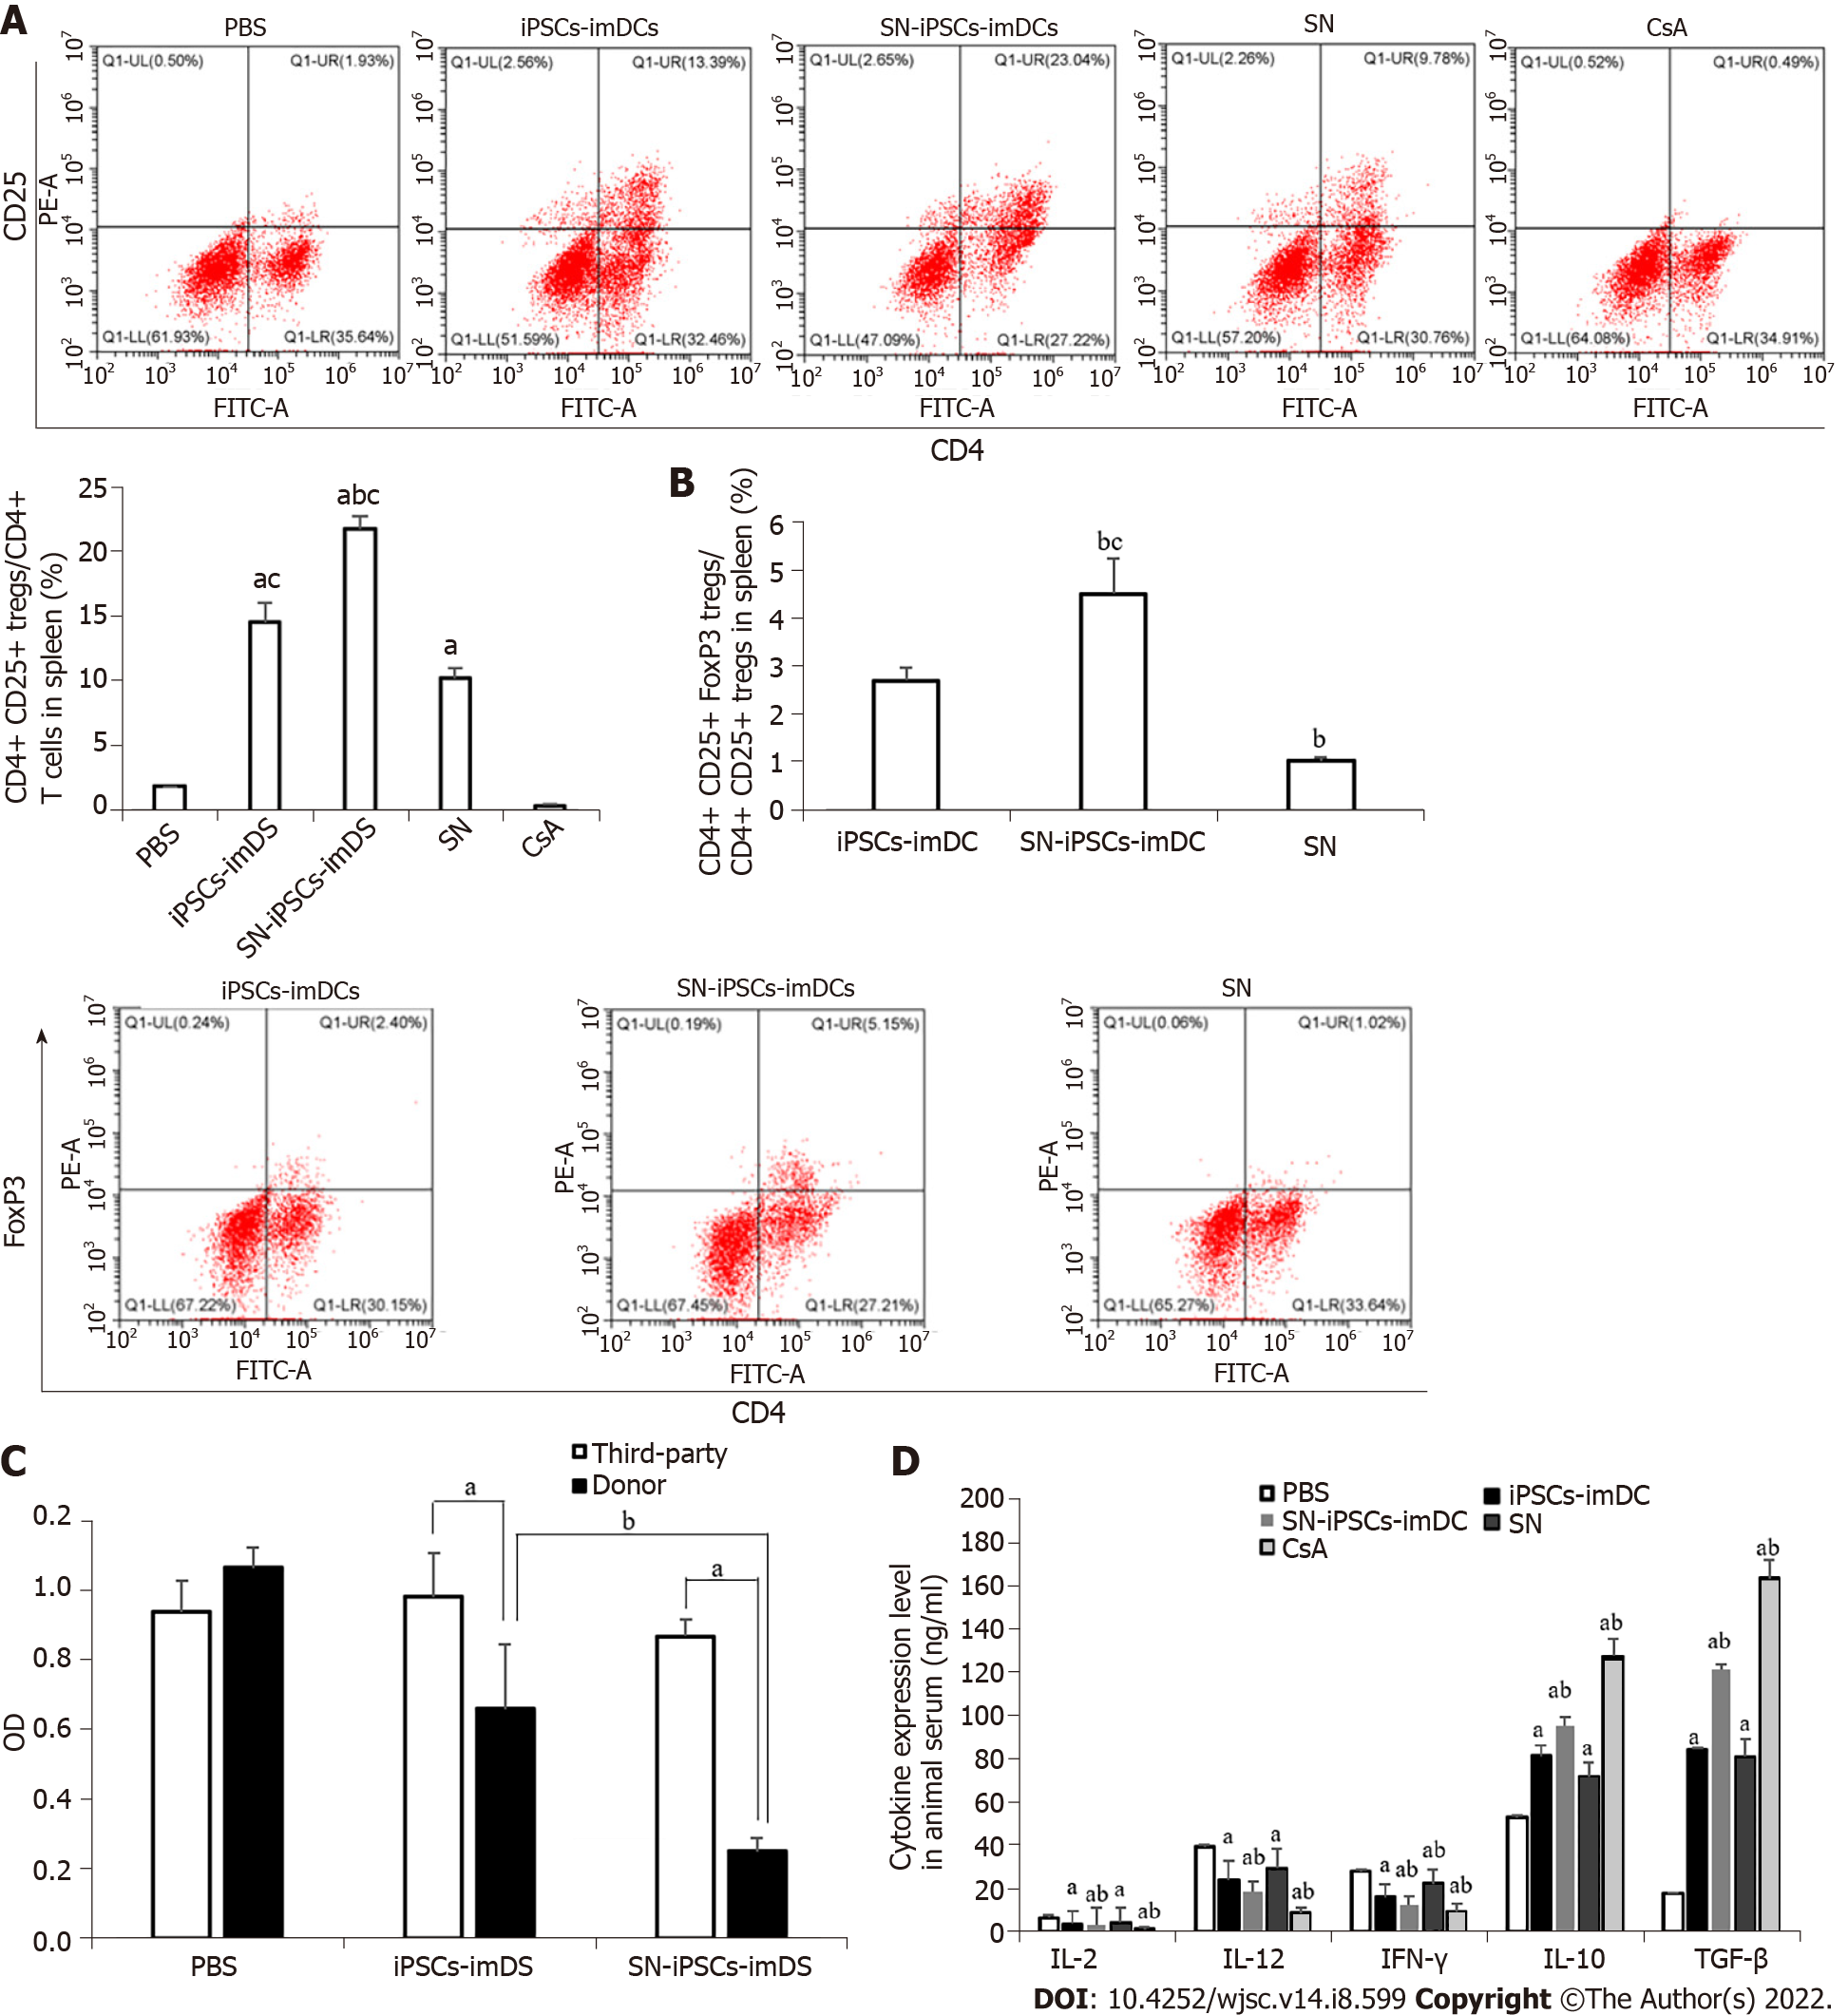
Figure 8 Sinomenine-induced pluripotent stem cells-immature dendritic cells immunization suppressed T cells and increased activated regulatory T cells in allografts.
A: Sinomenine (SN)-induced pluripotent stem cells (iPSCs)-immature dendritic cells (imDCs) increased the ratio of CD4+CD25+ regulatory T (Treg) cells/CD4+ T cells in spleen. Compared with PBS group, aP < 0.05. Compared with iPSCs-imDCs group, bP < 0.05. Compared with SN group, cP < 0.05; B: SN-iPSCs-imDCs increased the ratio of CD4+CD25+FoxP3+ Treg cells/CD4+CD25+ Treg cells in spleen. Compared with iPSCs-imDCs group, bP < 0.05. Compared with SN group, cP < 0.05; C: Reactivity of recipient lymphocytes to donor or unrelated third-party lymphocytes. Compared to third-party lymphocytes, aP < 0.05. Compared with iPSCs-imDCs group, bP < 0.05; D: SN-iPSCs-imDCs downregulated proinflammatory cytokines and upregulated anti-inflammatory cytokines. Compared with PBS group, aP < 0.05. Compared with iPSCs-imDCs group, bP < 0.05. SN: Sinomenine; iPSCs: Induced pluripotent stem cells; DCs: Dendritic cells; imDCs: Immature dendritic cells; IL: Interleukin; IFN: Interferon; TGF-: Transforming growth factor-.
- Citation: Huang XY, Jin ZK, Dou M, Zheng BX, Zhao XR, Feng Q, Feng YM, Duan XL, Tian PX, Xu CX. Sinomenine promotes differentiation of induced pluripotent stem cells into immature dendritic cells with high induction of immune tolerance. World J Stem Cells 2022; 14(8): 599-615
- URL: https://www.wjgnet.com/1948-0210/full/v14/i8/599.htm
- DOI: https://dx.doi.org/10.4252/wjsc.v14.i8.599


