Copyright
©The Author(s) 2022.
World J Stem Cells. Feb 26, 2022; 14(2): 163-182
Published online Feb 26, 2022. doi: 10.4252/wjsc.v14.i2.163
Published online Feb 26, 2022. doi: 10.4252/wjsc.v14.i2.163
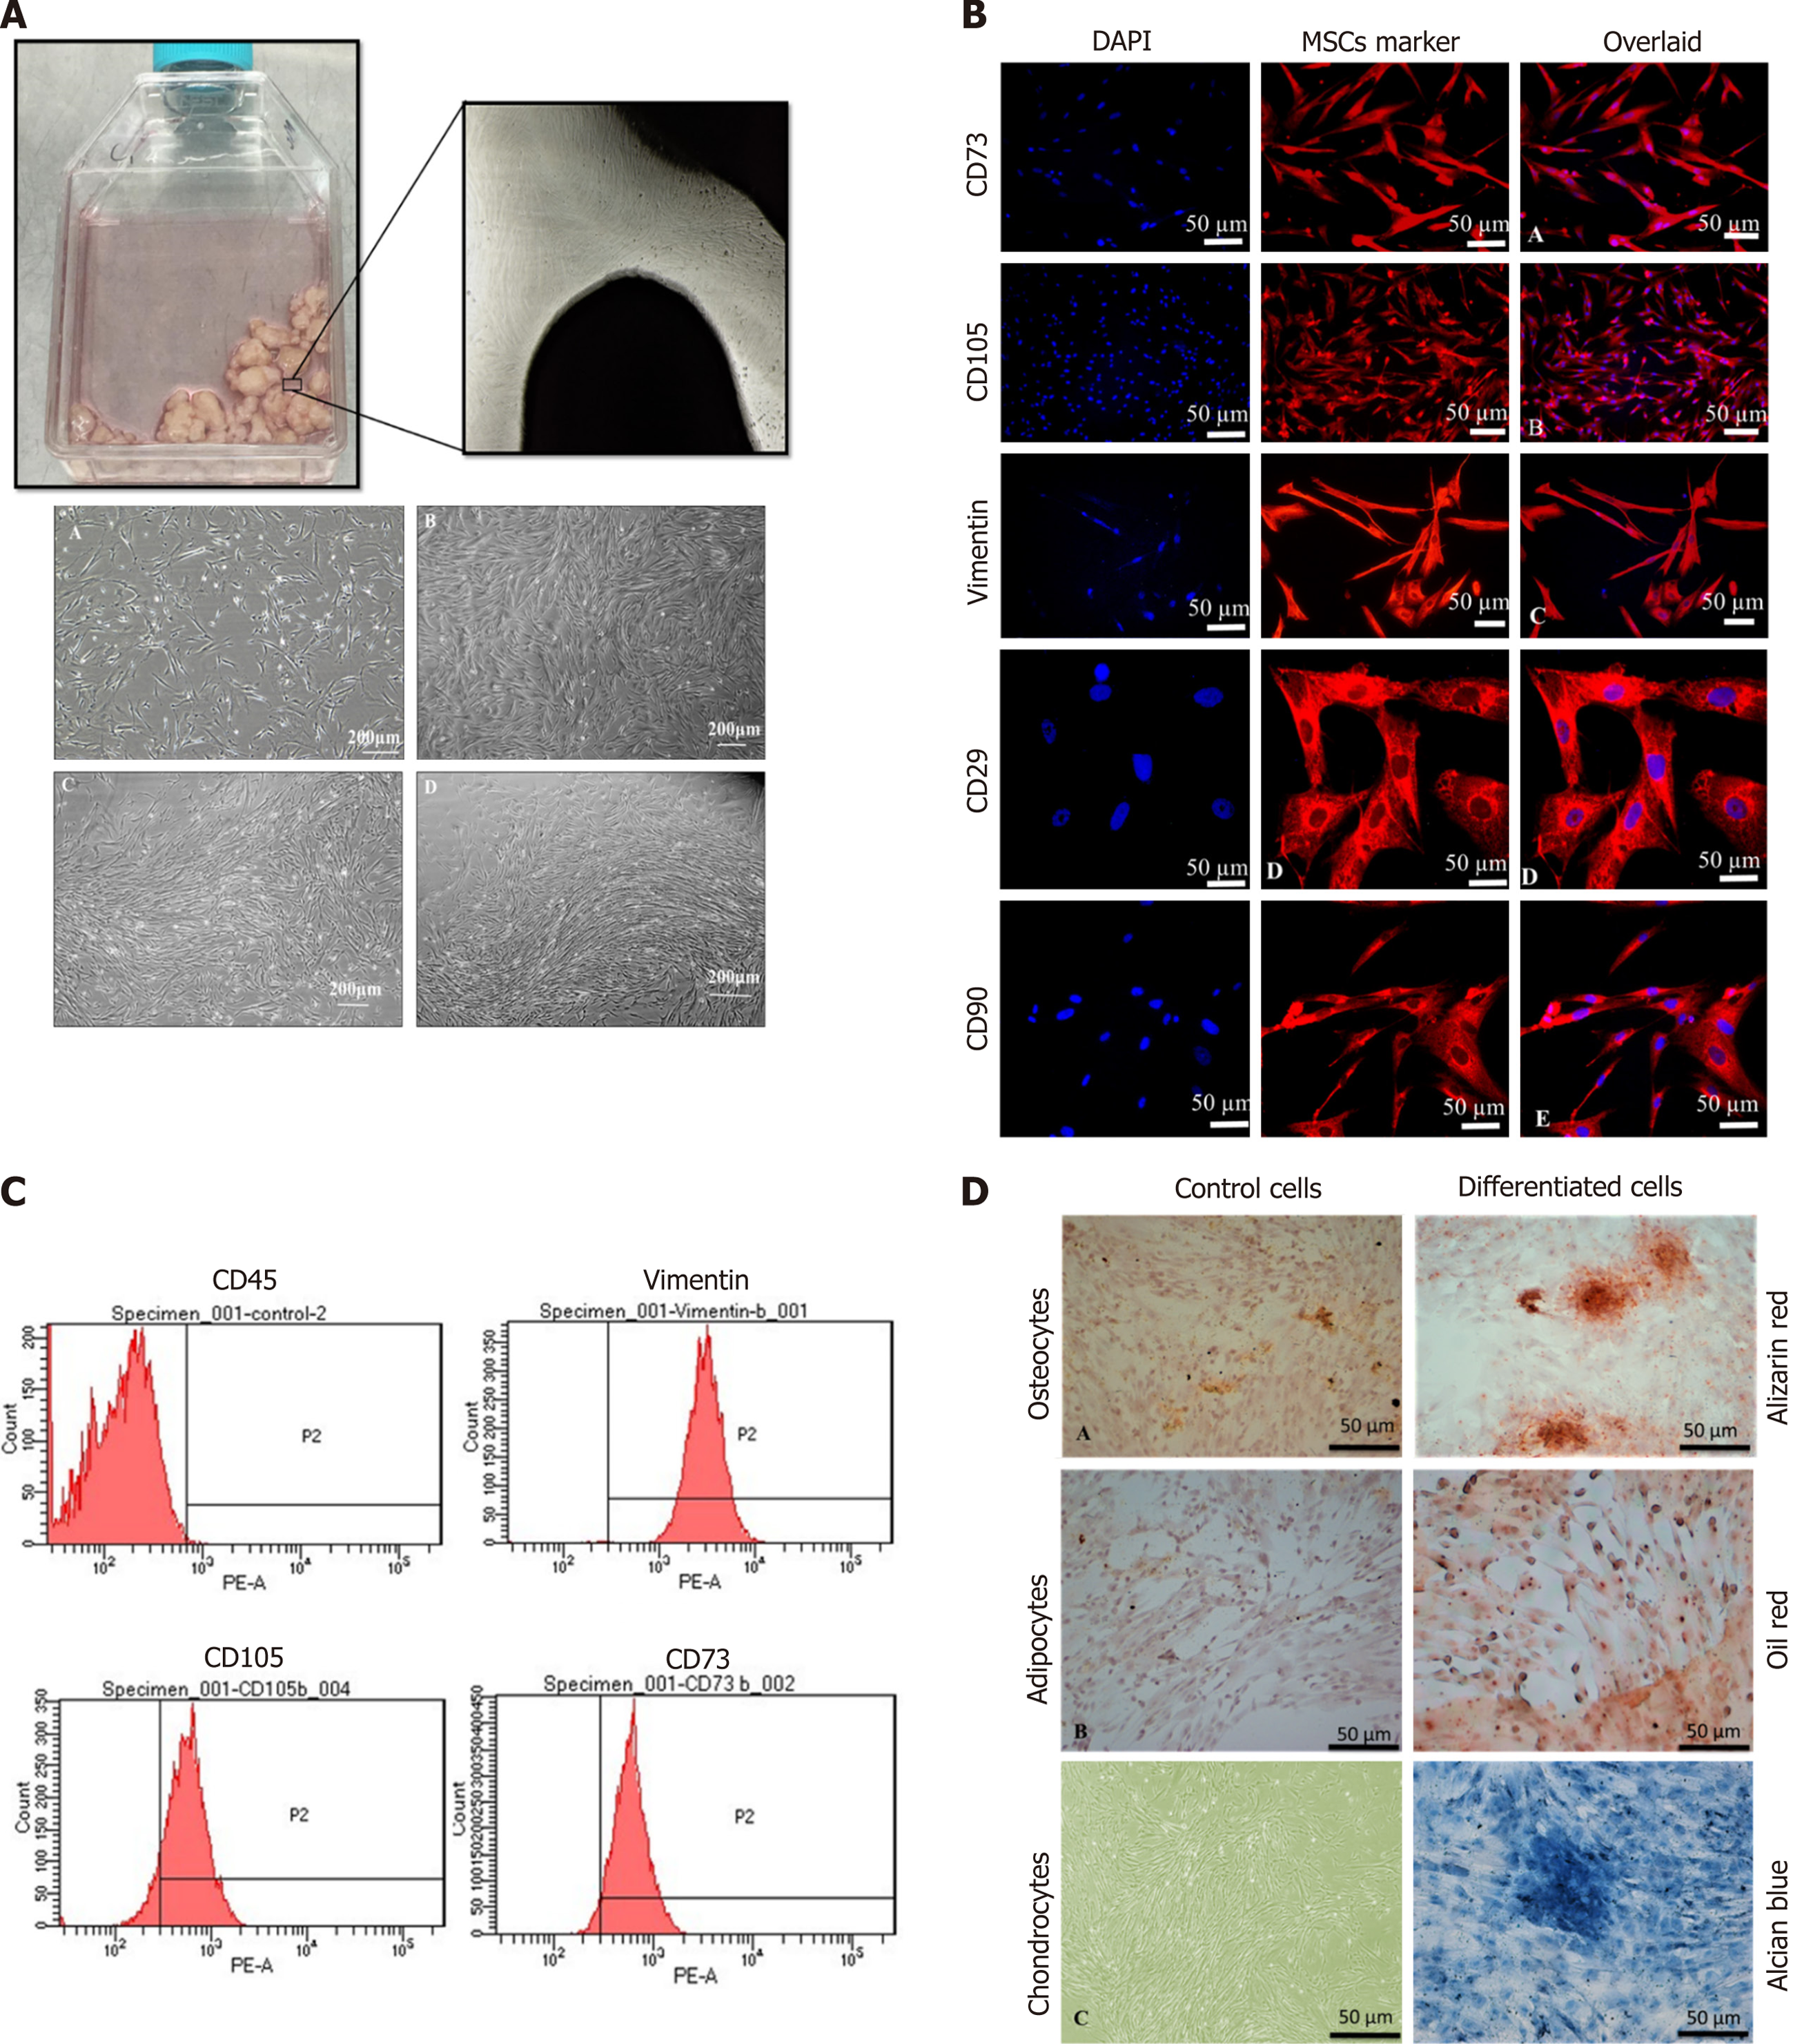
Figure 1 Characterization of human umbilical cord mesenchymal stem cells.
A: Culture of human umbilical cord mesenchymal stem cells (hUC-MSCs) showed spindle-shaped fibroblast-like morphology at passage P1 to P4; B: MSCs showed positive expression of CD73, CD105, Vimentin, CD29, and CD90. Nuclei were stained with DAPI; C: Histogram of MSCs with specific markers. MSCs showed negative expression of CD45, while positive expression for Vimentin, CD105, and CD73; D: Tri-lineage differentiation of hUC-MSCs. Alizarin Red stained calcium deposits produced by osteocytes, Oil red O-stained lipid vacuoles produced by adipocytes, and Alcian blue stained proteoglycans and glycosaminoglycans secreted by chondrocytes.
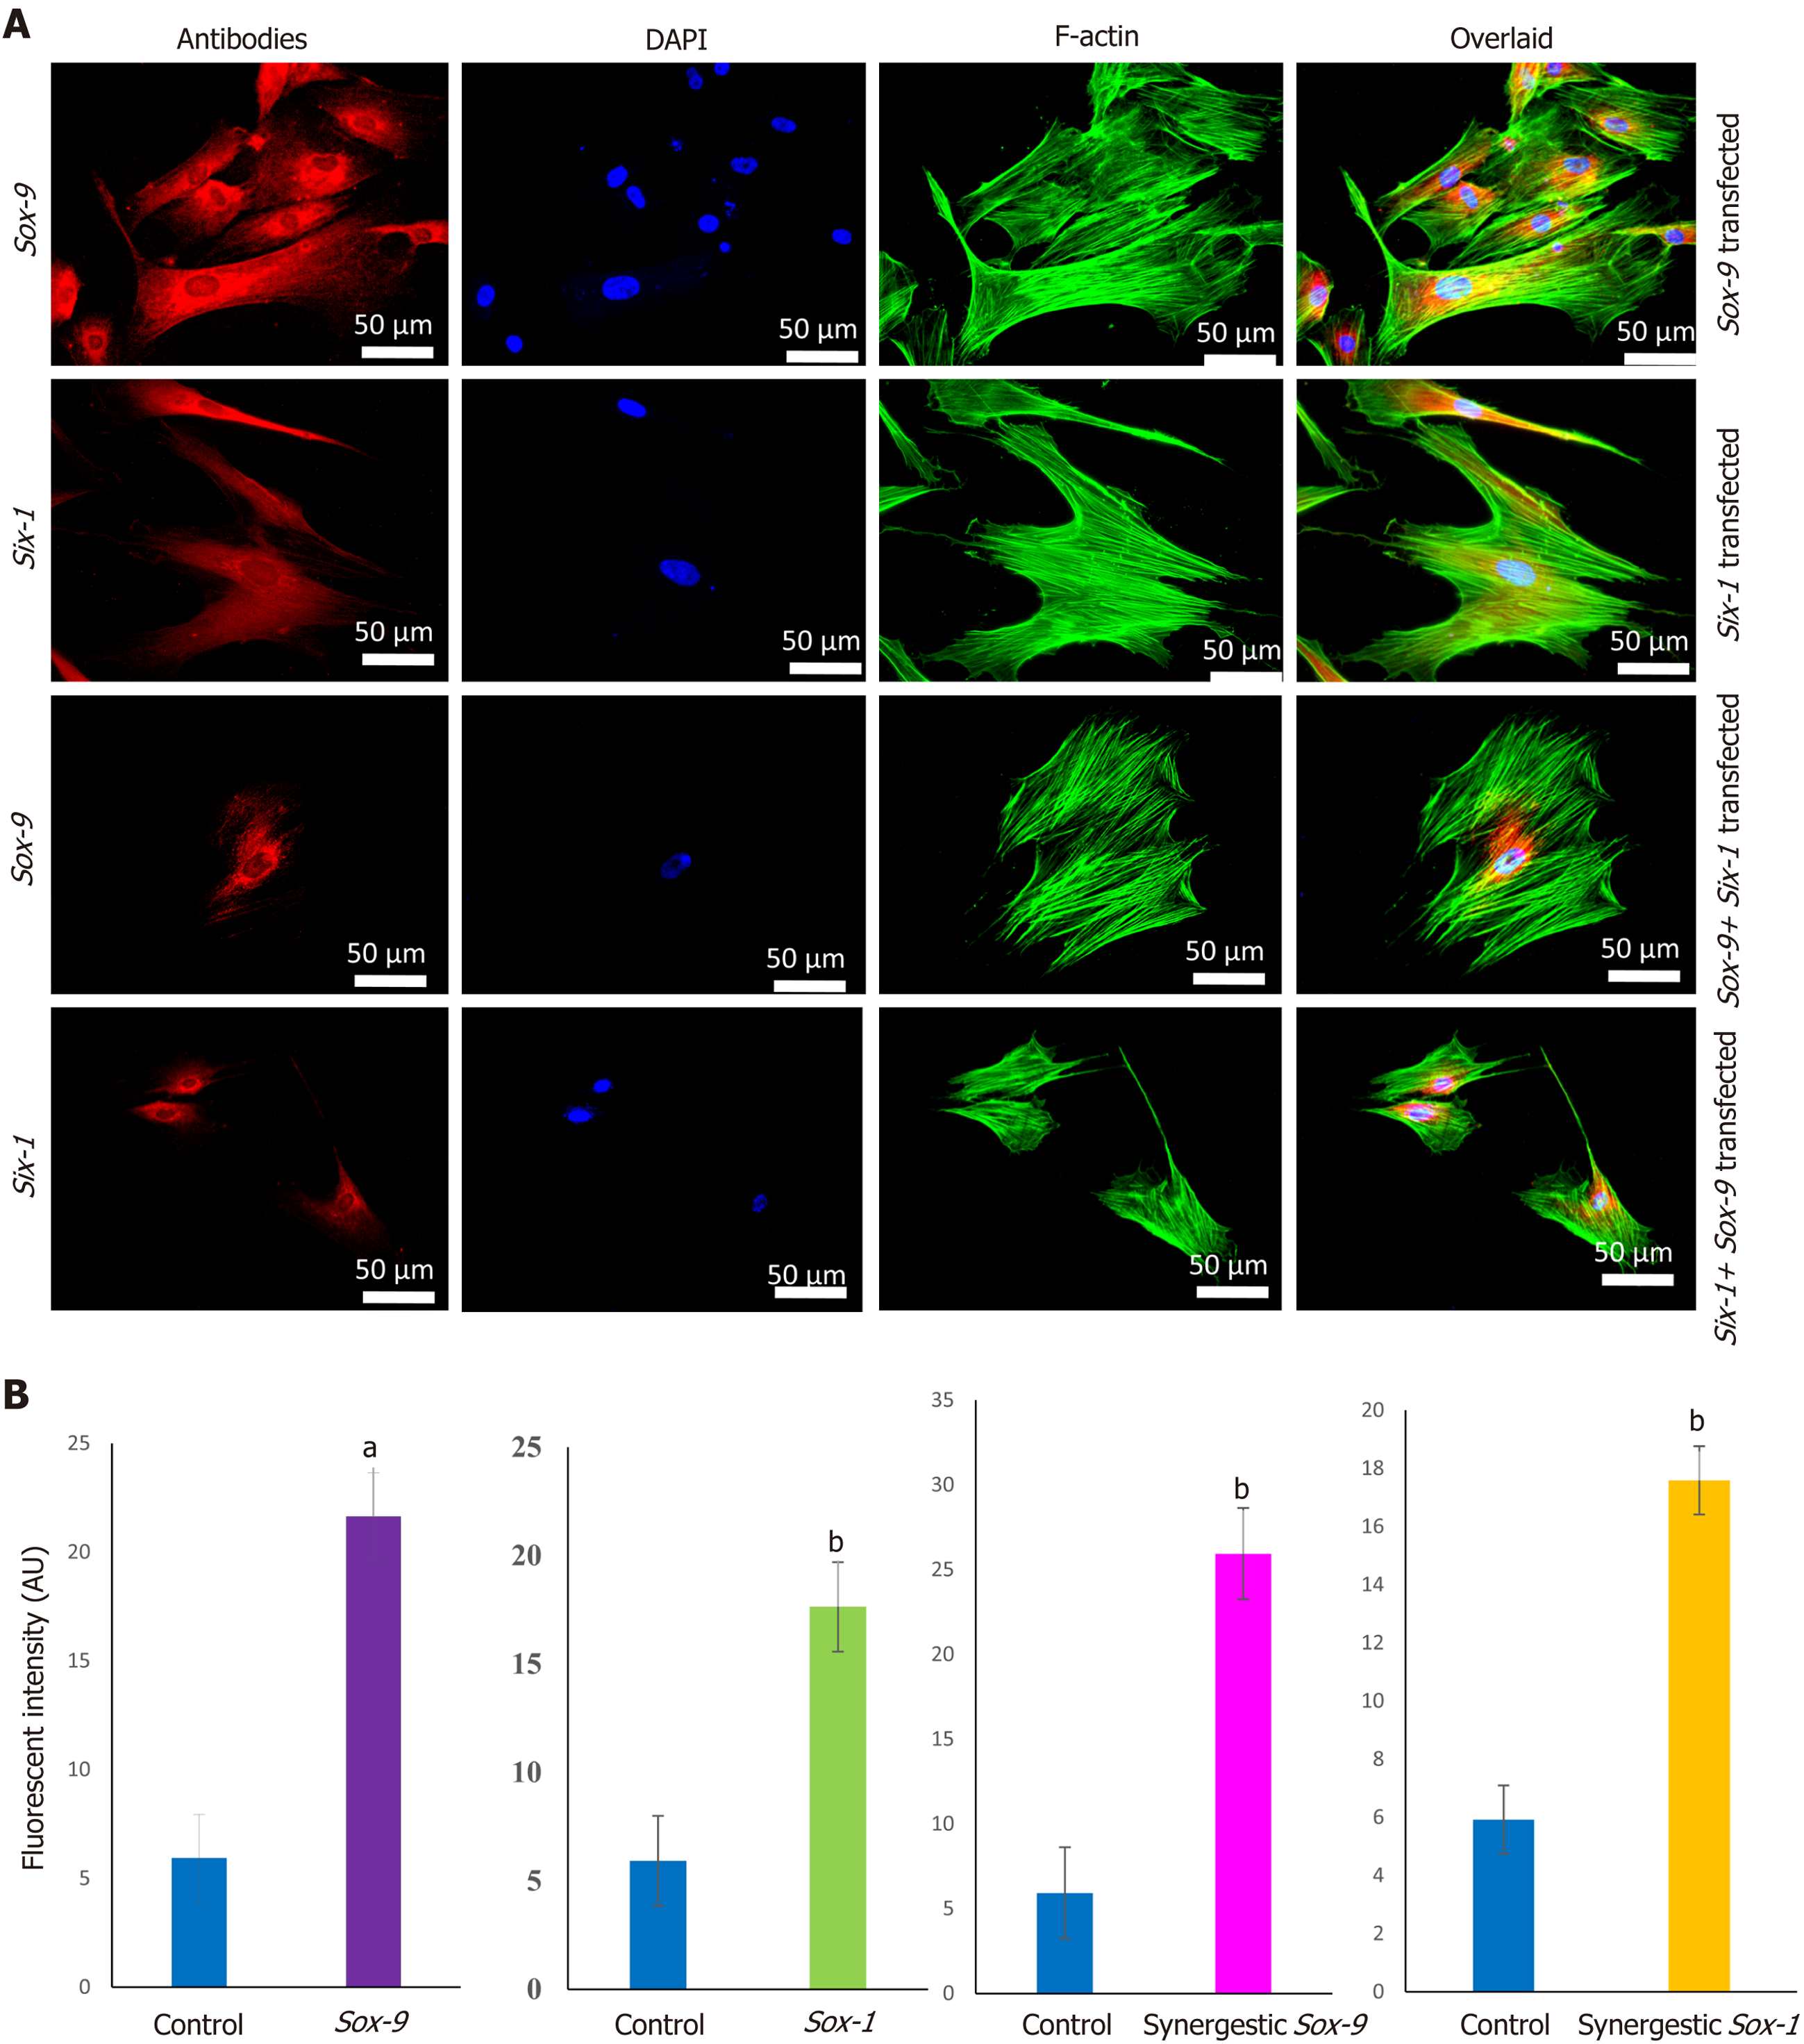
Figure 2 Transfection efficiency of human umbilical cord mesenchymal stem cells.
A: Positive expression of Sox-9, and Six-1 proteins was observed after 48 h of electroporation, as analyzed by immunocytochemical staining; B: Quantification of fluorescent intensities showed that Sox-9 transfected cells expressed Sox-9 protein, Six-1 transfected mesenchymal stem cells (MSCs) expressed Six-1 protein, and Sox-9+Six-1 transfected MSCs expressed Sox-9, and Six-1 proteins. aP < 0.05 vs control; bP < 0.01 vs control.
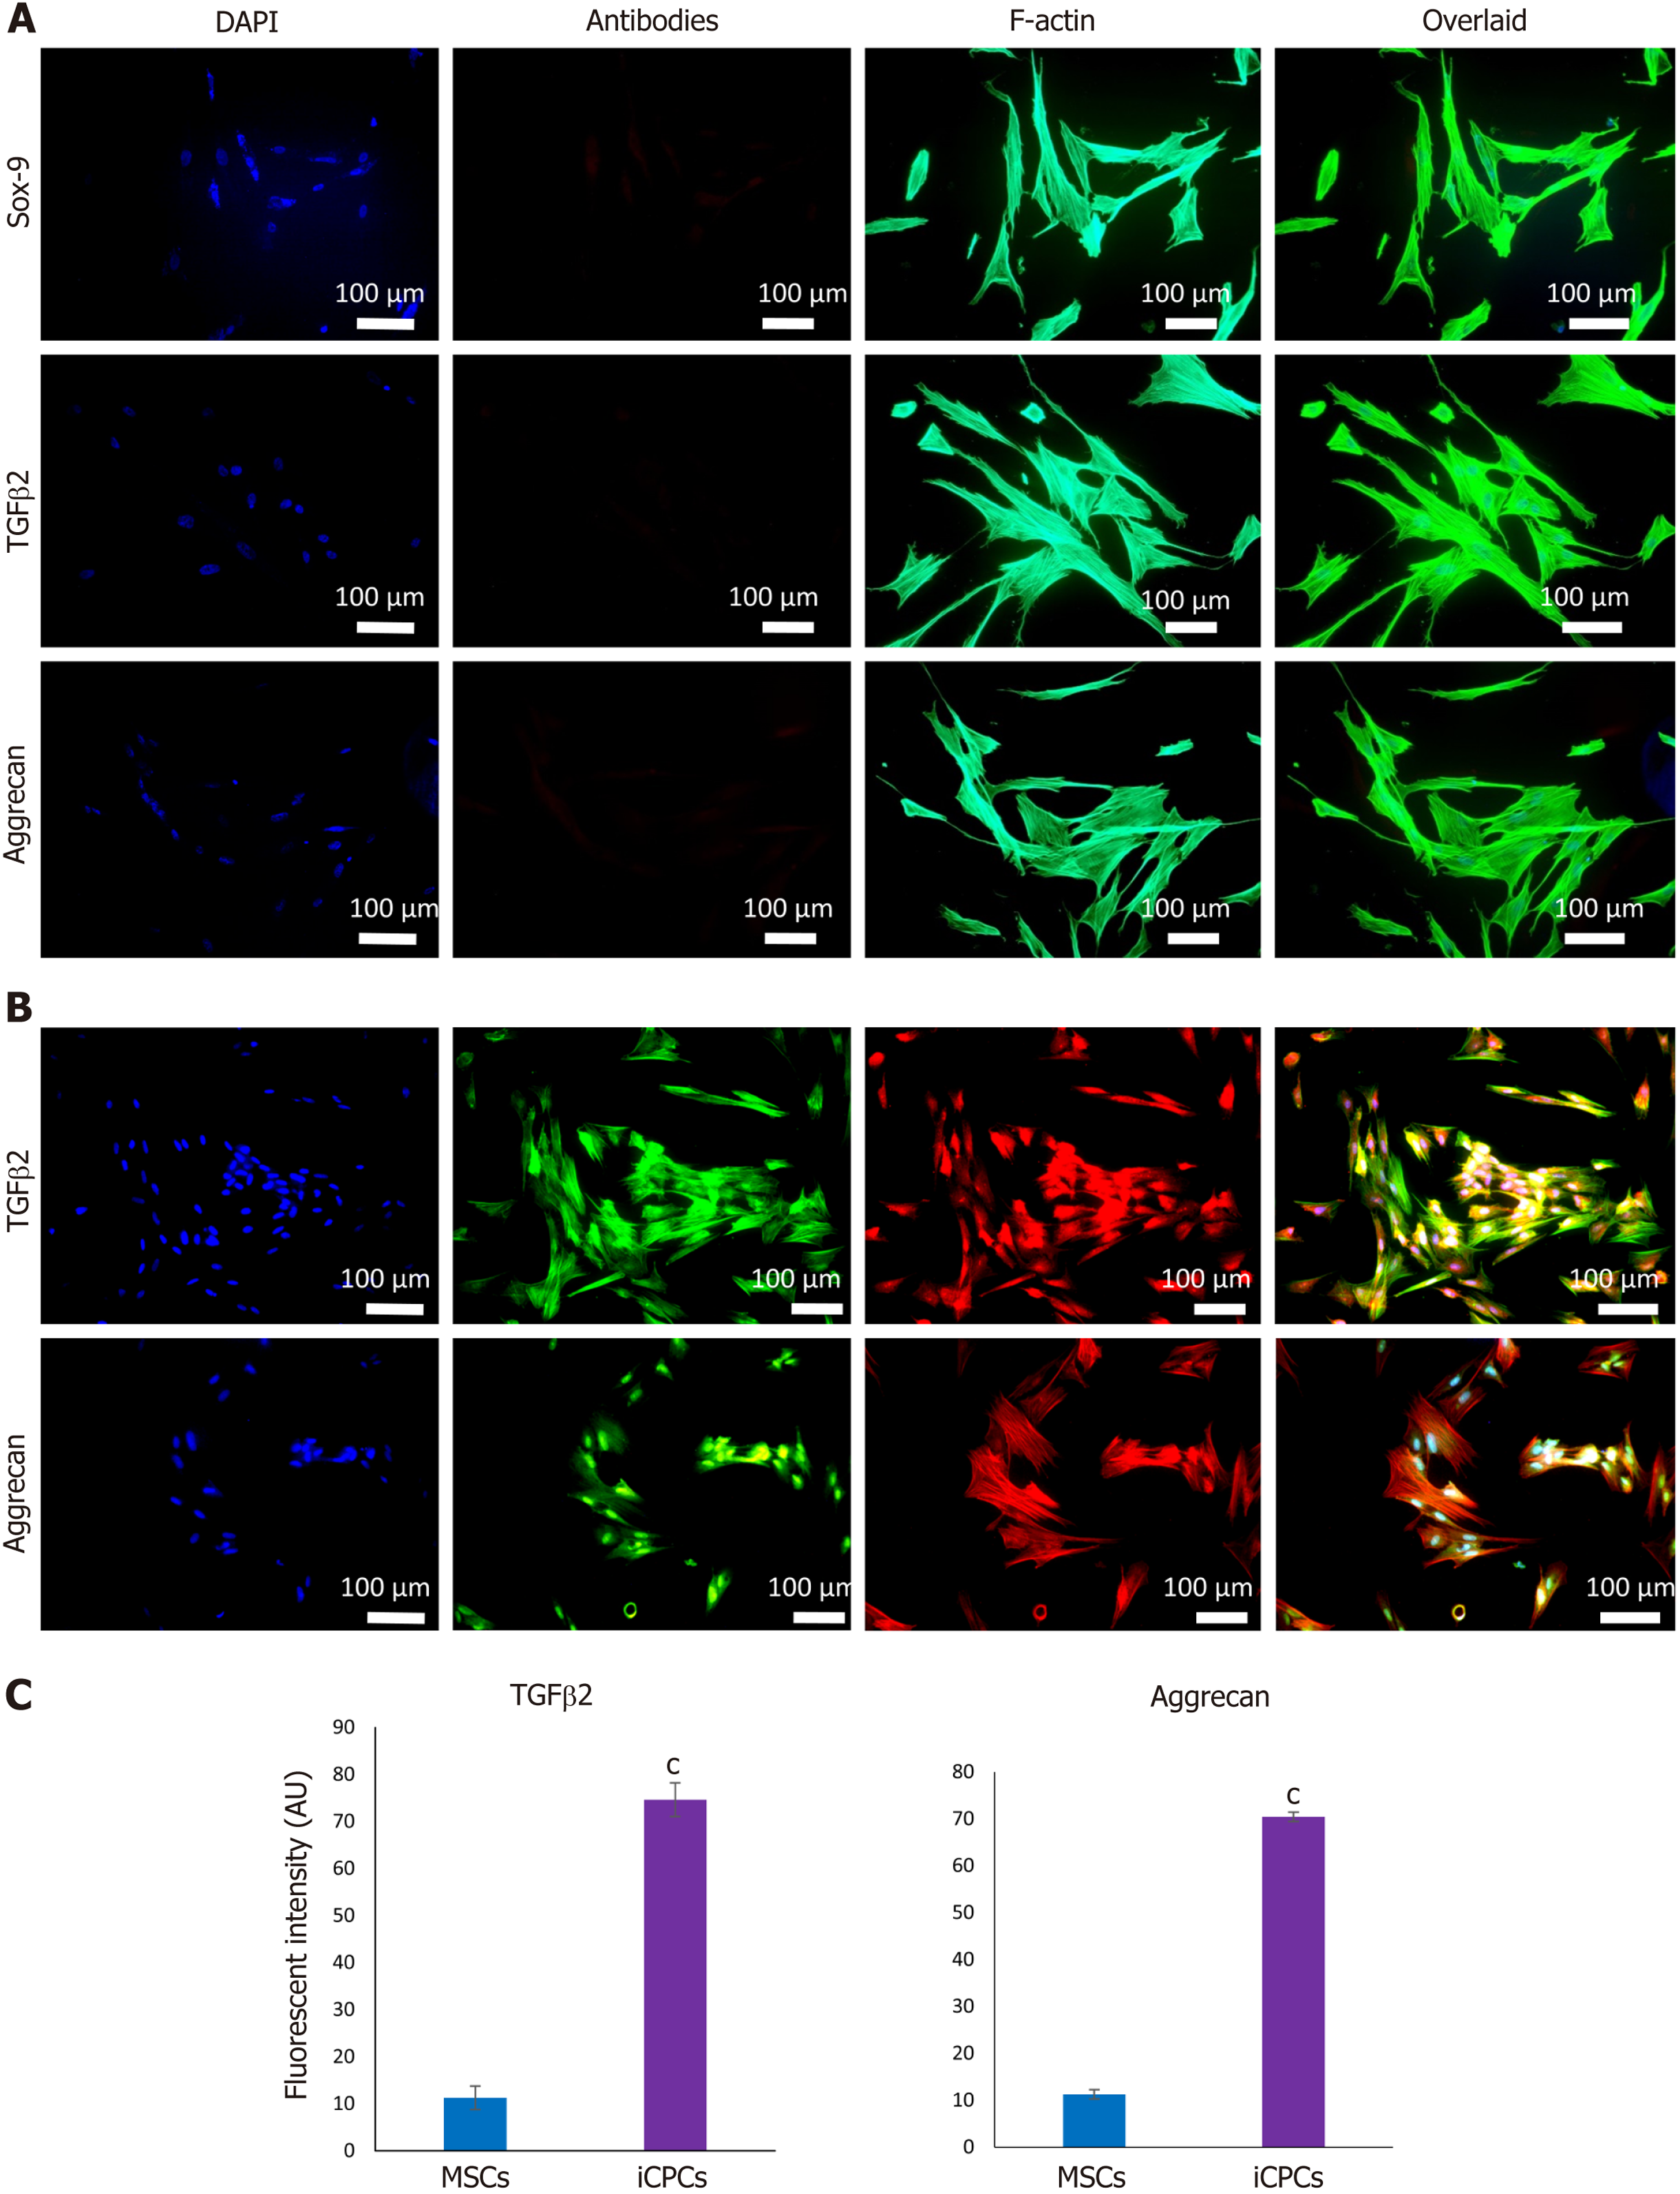
Figure 3 Expression of chondrogenic markers in human umbilical cord mesenchymal stem cells and induced chondro-progenitor cells.
A: Human umbilical cord (hUC)-mesenchymal stem cells (MSCs) did not express Sox-9, transforming growth factor beta-2 (TGFβ2), and aggrecan, which indicates that MSCs are negative for the expression of early and late chondrogenic markers; B: Induced chondro-progenitor cells expressed aggrecan, and TGFβ2, showing that MSCs were differentiated into chondrocytes; C: The quantification of fluorescent intensities for aggrecan and TGFβ2 showed their significantly higher expression in differentiated cells as compared to control. cP < 0.001 vs MSCs.
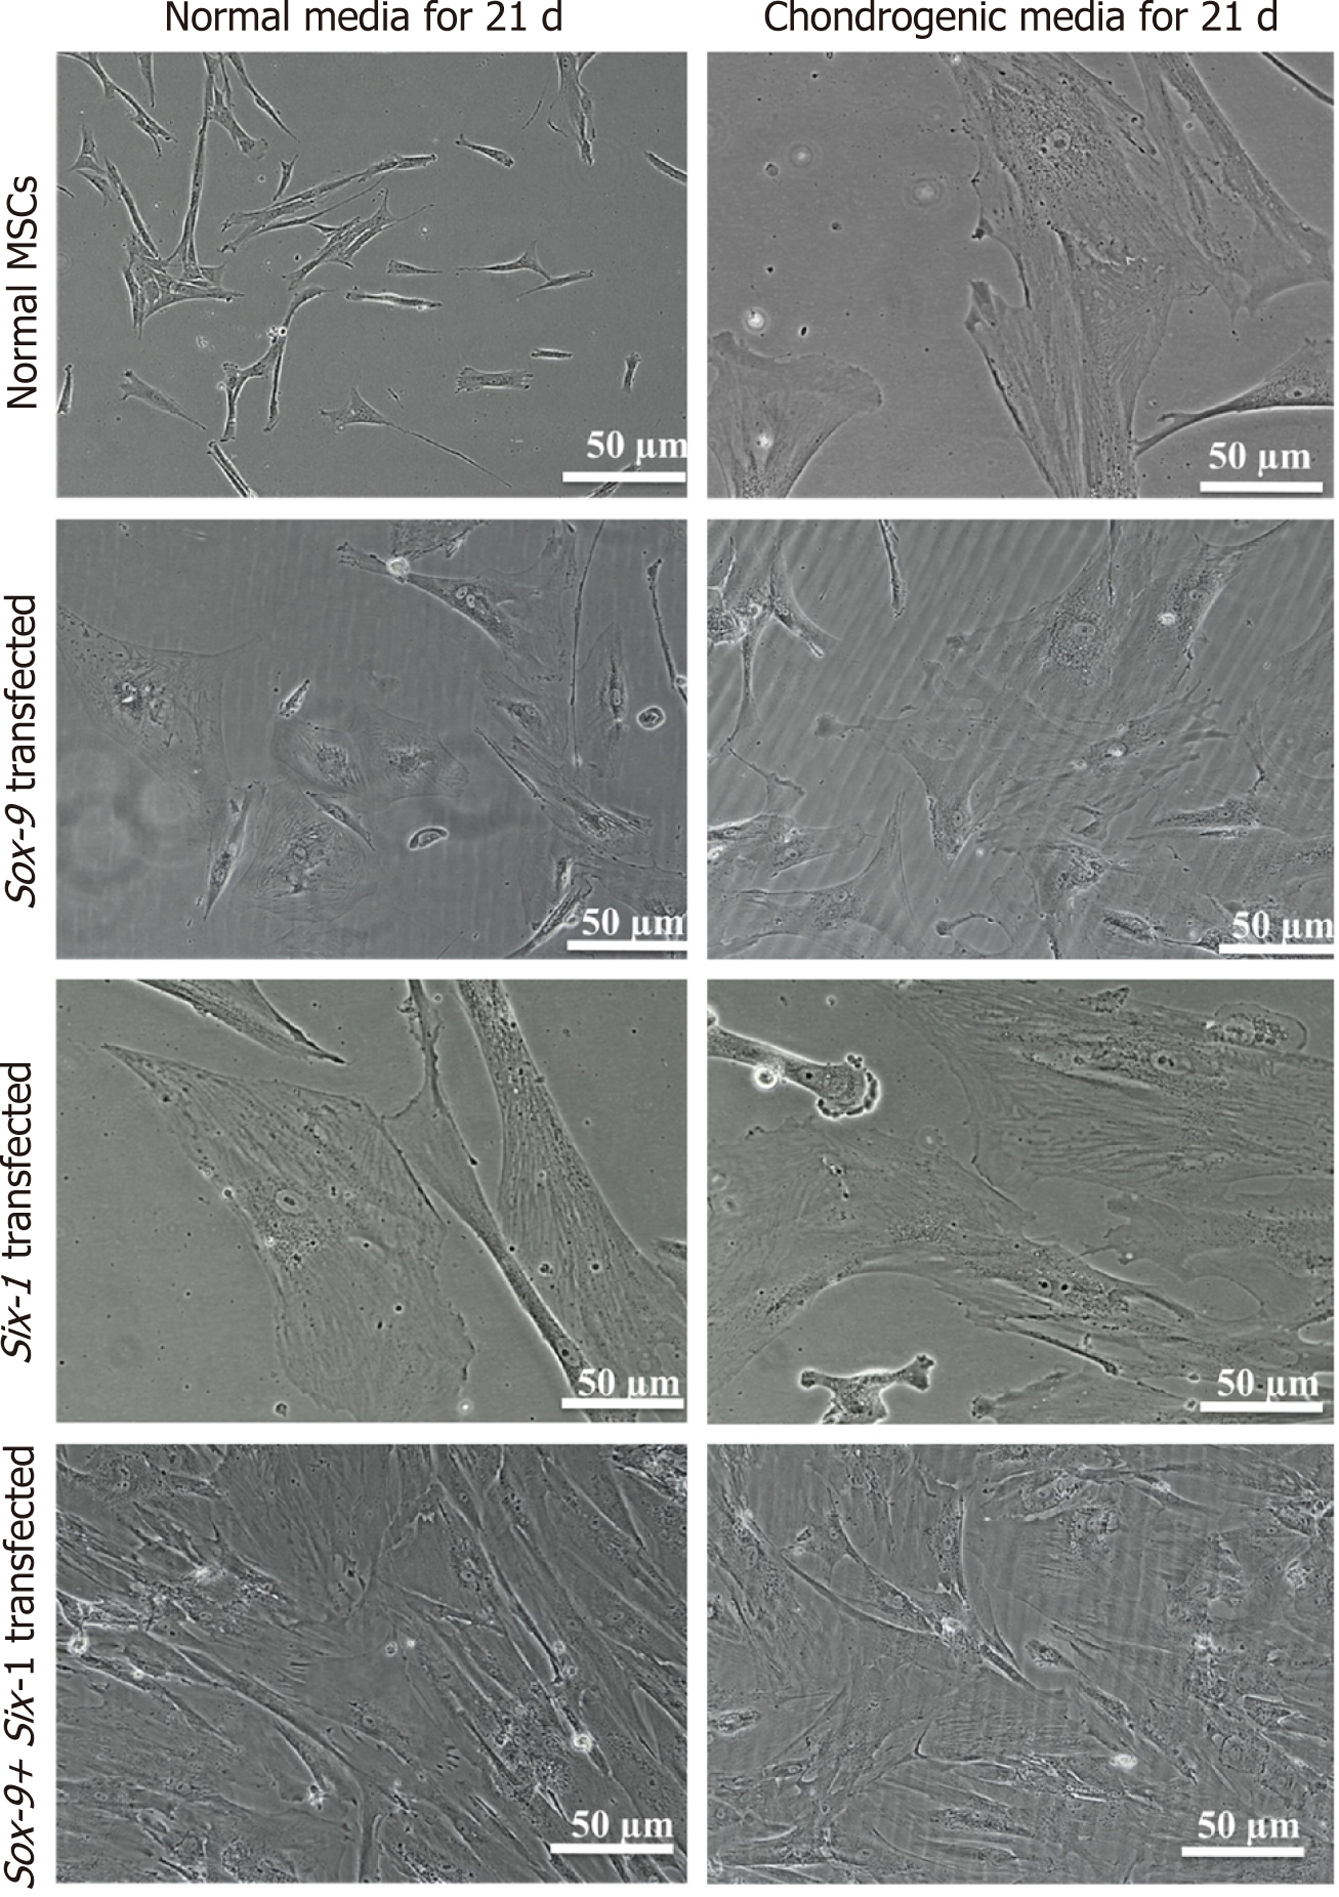
Figure 4 Morphology of transfected human umbilical cord mesenchymal stem cells.
Transfected human umbilical cord mesenchymal stem cells (MSCs) after 21 d of culture in the normal and chondro-induction media under phase contrast microscope showed broad and polygonal morphology which is similar to the morphology of induced chondroprogenitor cells, indicating that differentiation is induced in the transfected cells.
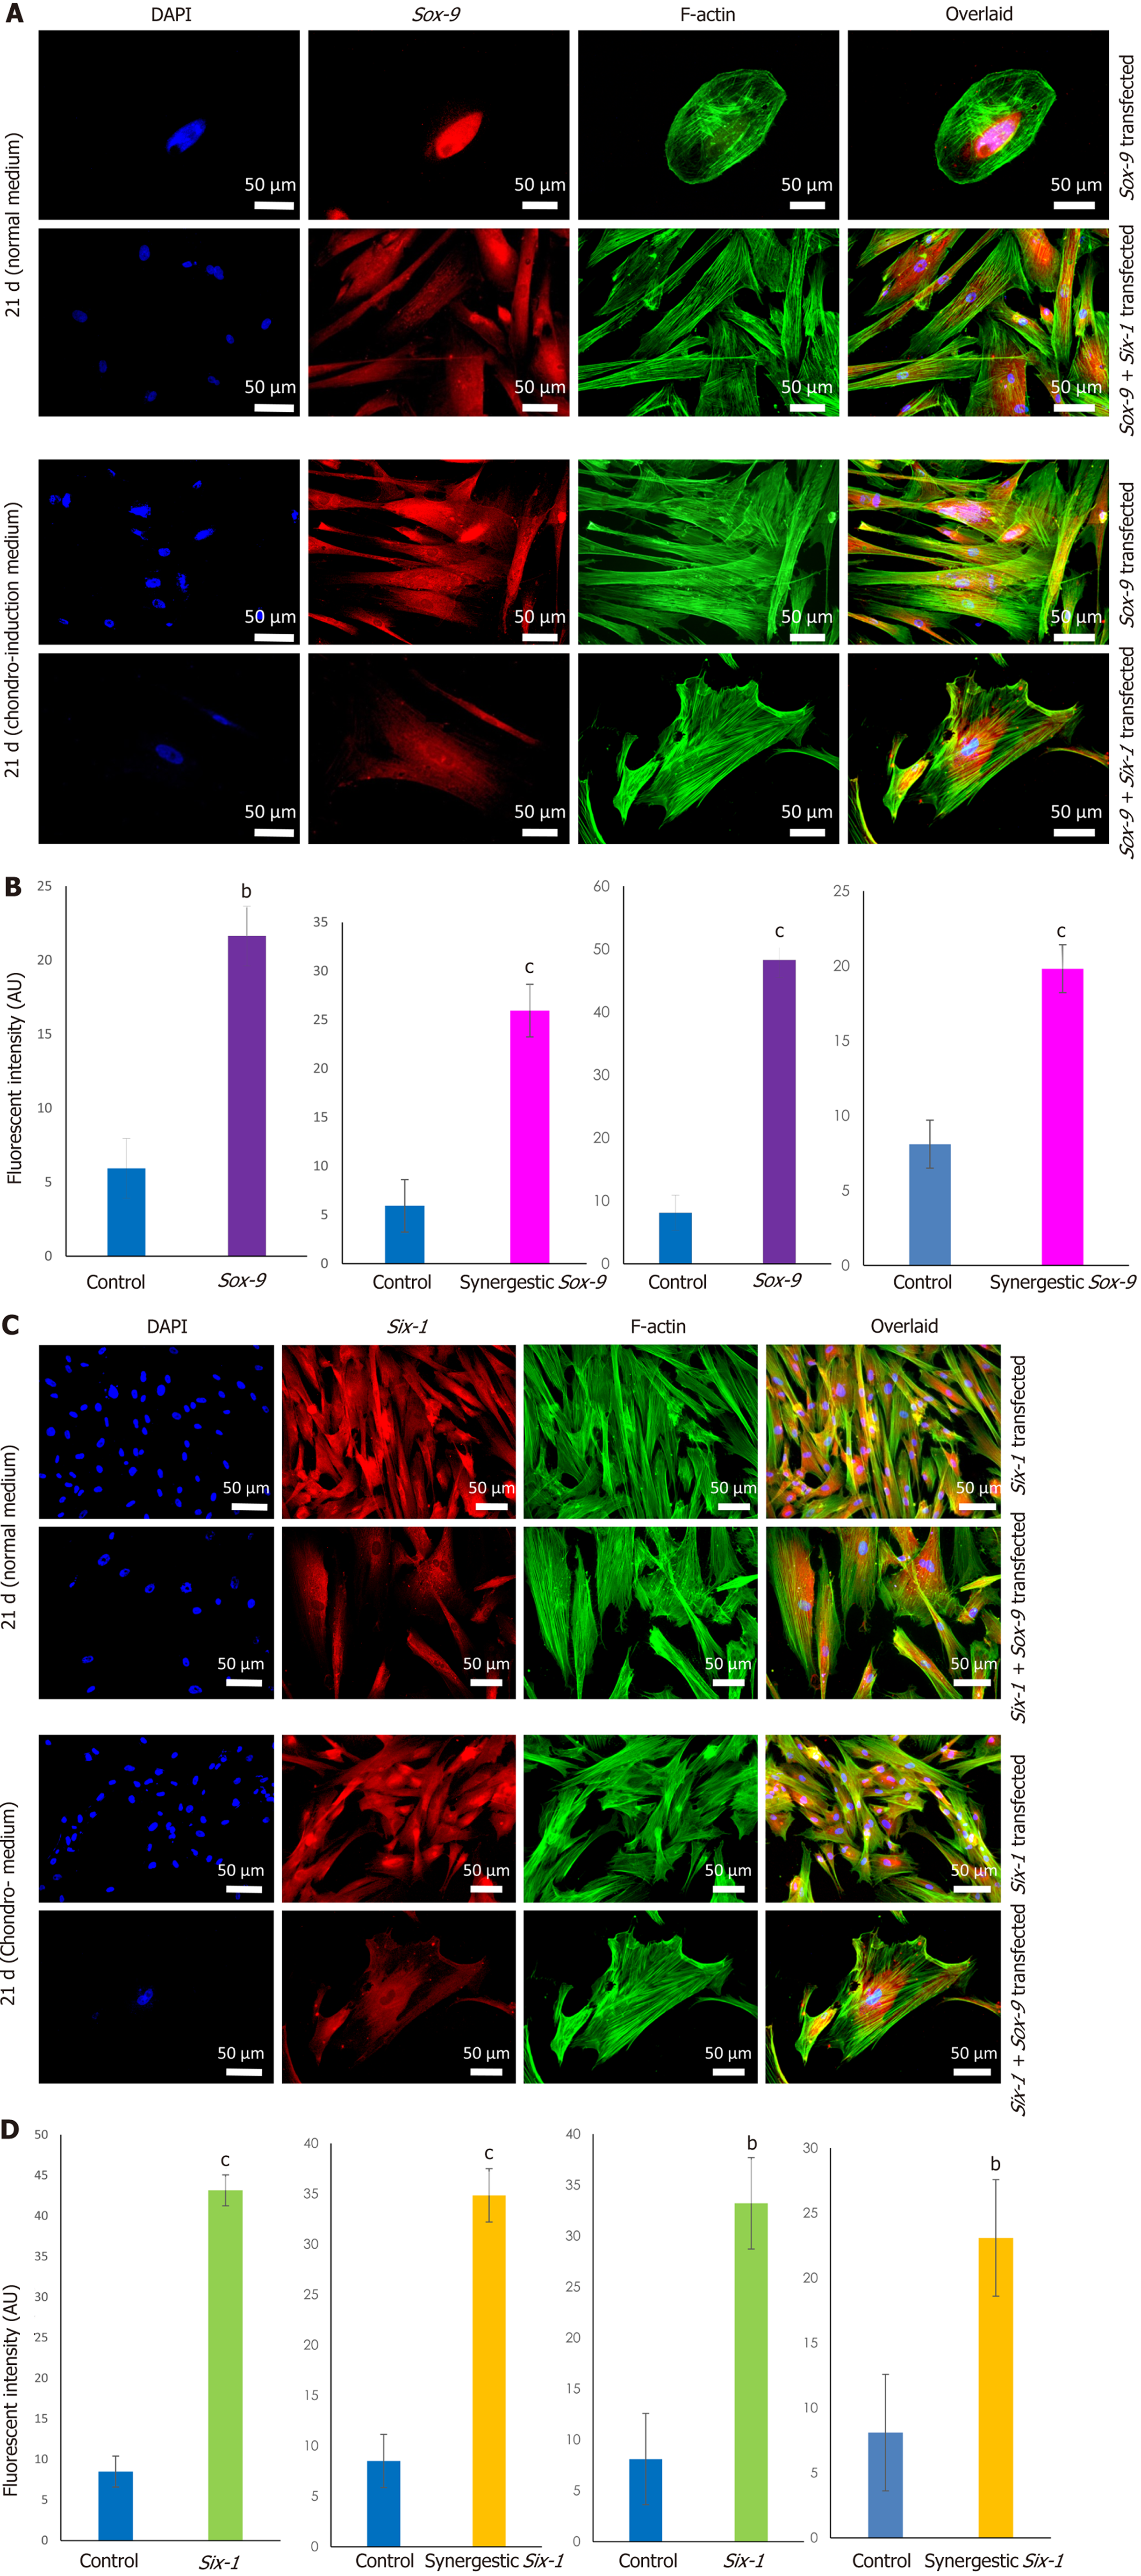
Figure 5 Expression of Sox-9 and Six-1 proteins in transfected human umbilical cord mesenchymal stem cells.
Human umbilical cord mesenchymal stem cells transfected with Sox-9, Six-1 or both in combination (Sox-9 + Six-1) were cultured in the normal and chondro-induction media for 21 d. Cells were stained for the expression of Sox-9 and Six-1 proteins by immunocytochemical staining. Alexa fluor 488 labeled phalloidin was used to visualize F-actin of the cellular cytoskeleton. A, B: The expression of Sox-9 in Sox-9 and synergistic transfected group in normal and chondro-induction media, and their fluorescent intensities, respectively; C, D: The expression of Six-1 in Six-1 and synergistic transfected group in normal and chondro-induction media, and their fluorescent intensities, respectively. bP < 0.01 vs control; cP < 0.001 vs control.
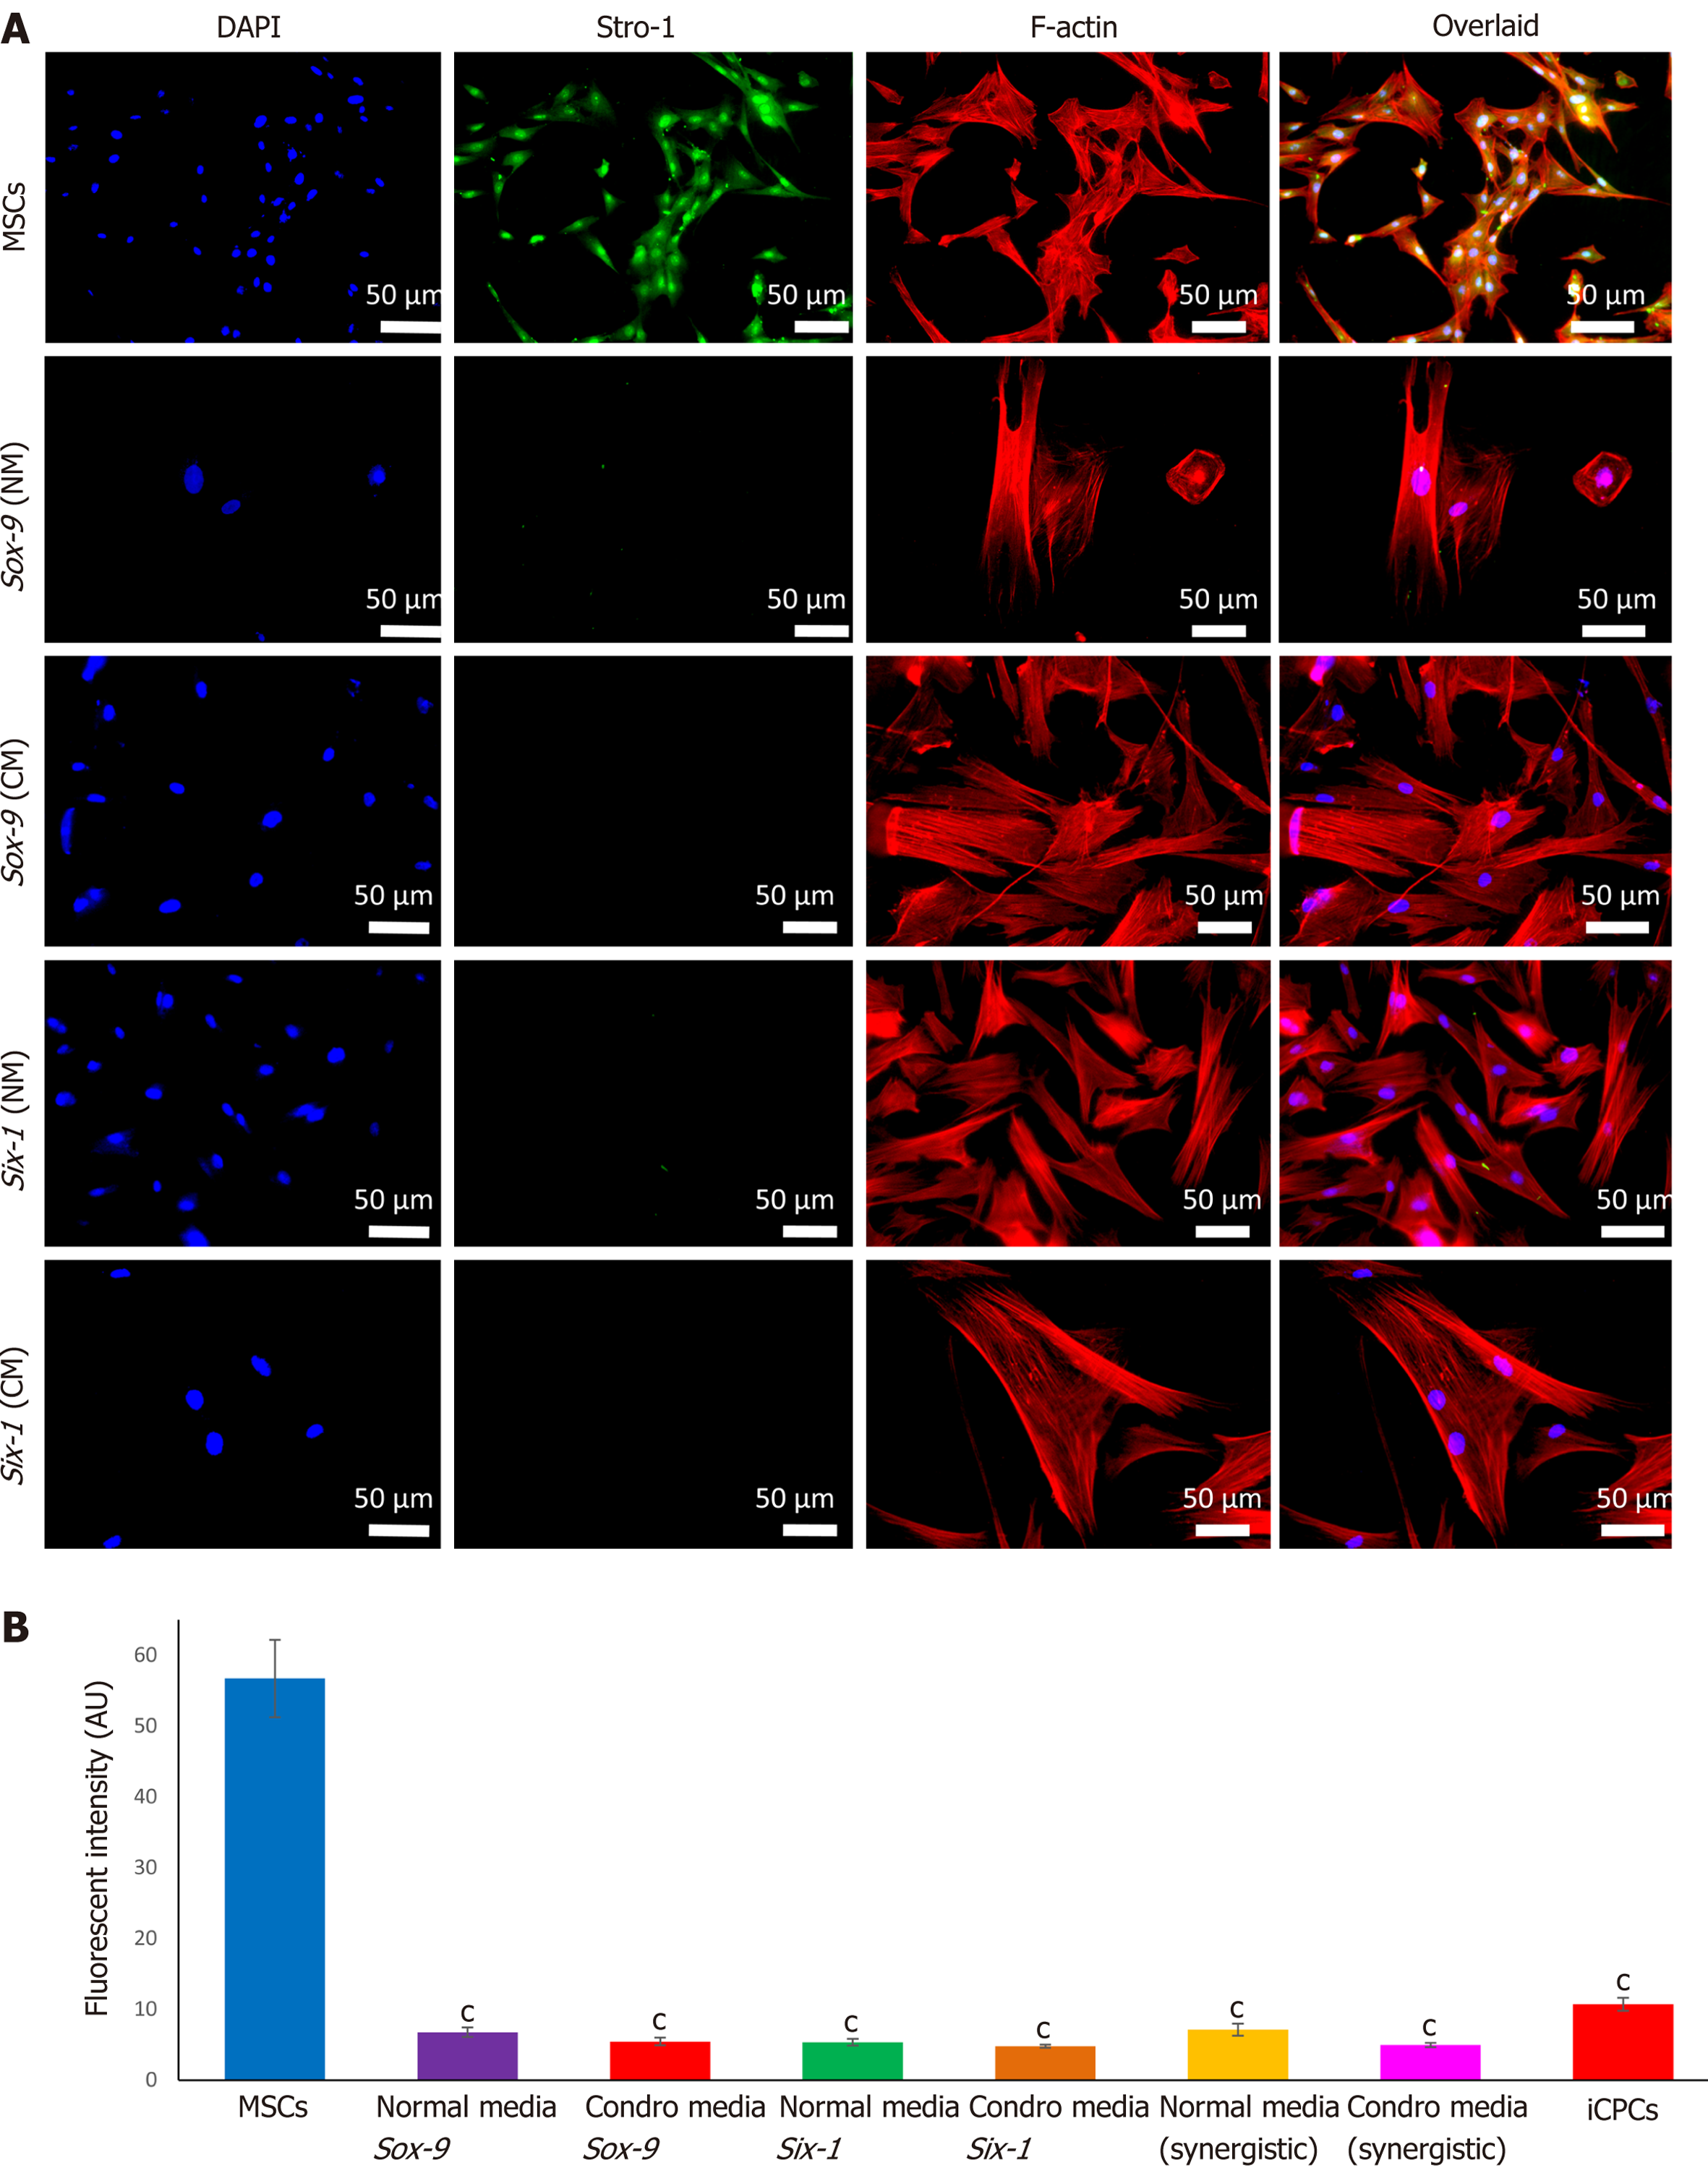
Figure 6 Stemness of transfected human umbilical cord mesenchymal stem cells.
A: After 21 d of in vitro culture in normal and chondro-induction media, transfected cells were immunocytochemically stained for the expression of mesenchymal stem cell (MSC) stemness marker Stro-1. Alexa fluor 546 labeled phalloidin was used to visualize F-actin of the cellular cytoskeleton. The nuclei were stained with DAPI; B: The fluorescent intensity of Stro-1 was quantified and showed the expression of Stro-1 protein. cP < 0.001 vs MSCs. iCPCs: Induced chondro-progenitor cells.
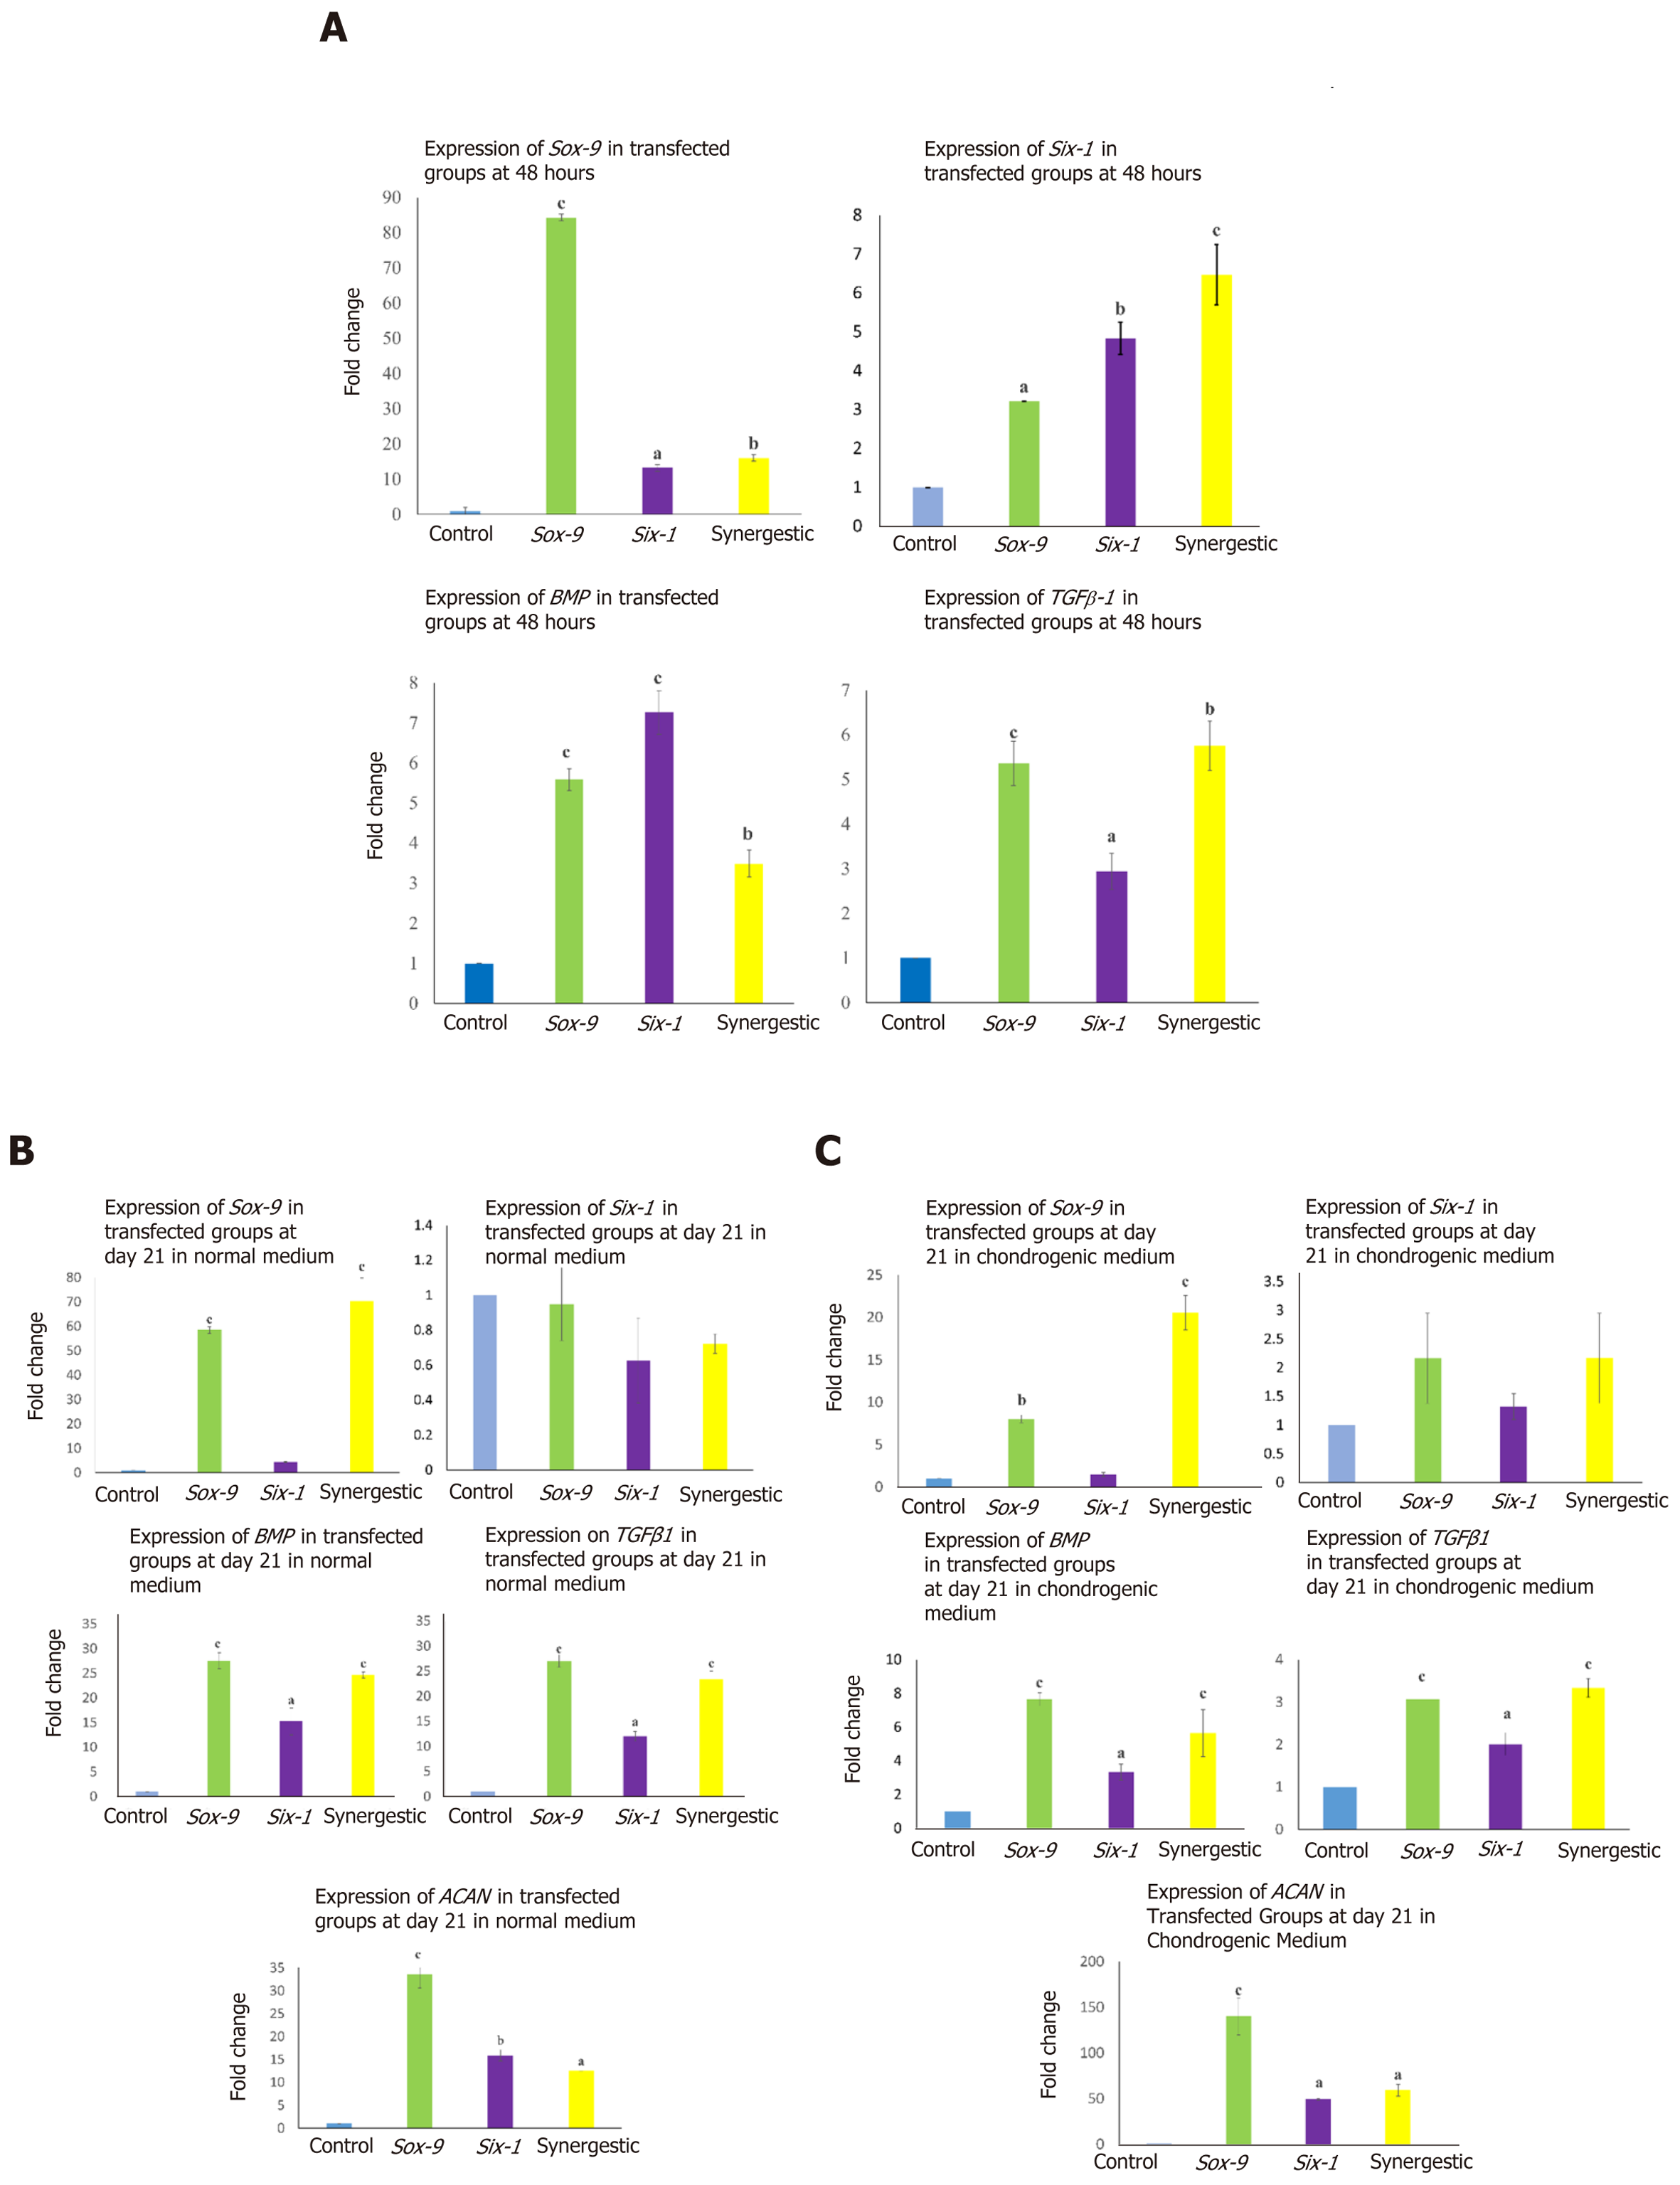
Figure 7 Gene expression analysis of transfected human umbilical cord mesenchymal stem cells via quantitative polymerase chain reaction.
A: Bar graphs with significant transcriptional expression of transforming growth factor beta-1 gene (TGFβ1), BMP, Sox-9, and Six-1 at 48 h post-transfection; B, C: Significant expression of TGFβ1, BMP, Sox-9, and aggrecan observed at 21 d post-transfection shows long term sustainability in the expression pattern. However, the expression was time-dependent, Six-1 was significantly downregulated in both normal and chondro-induction media at day 21. aP < 0.05 vs control; bP < 0.01 vs control; cP < 0.001 vs control.
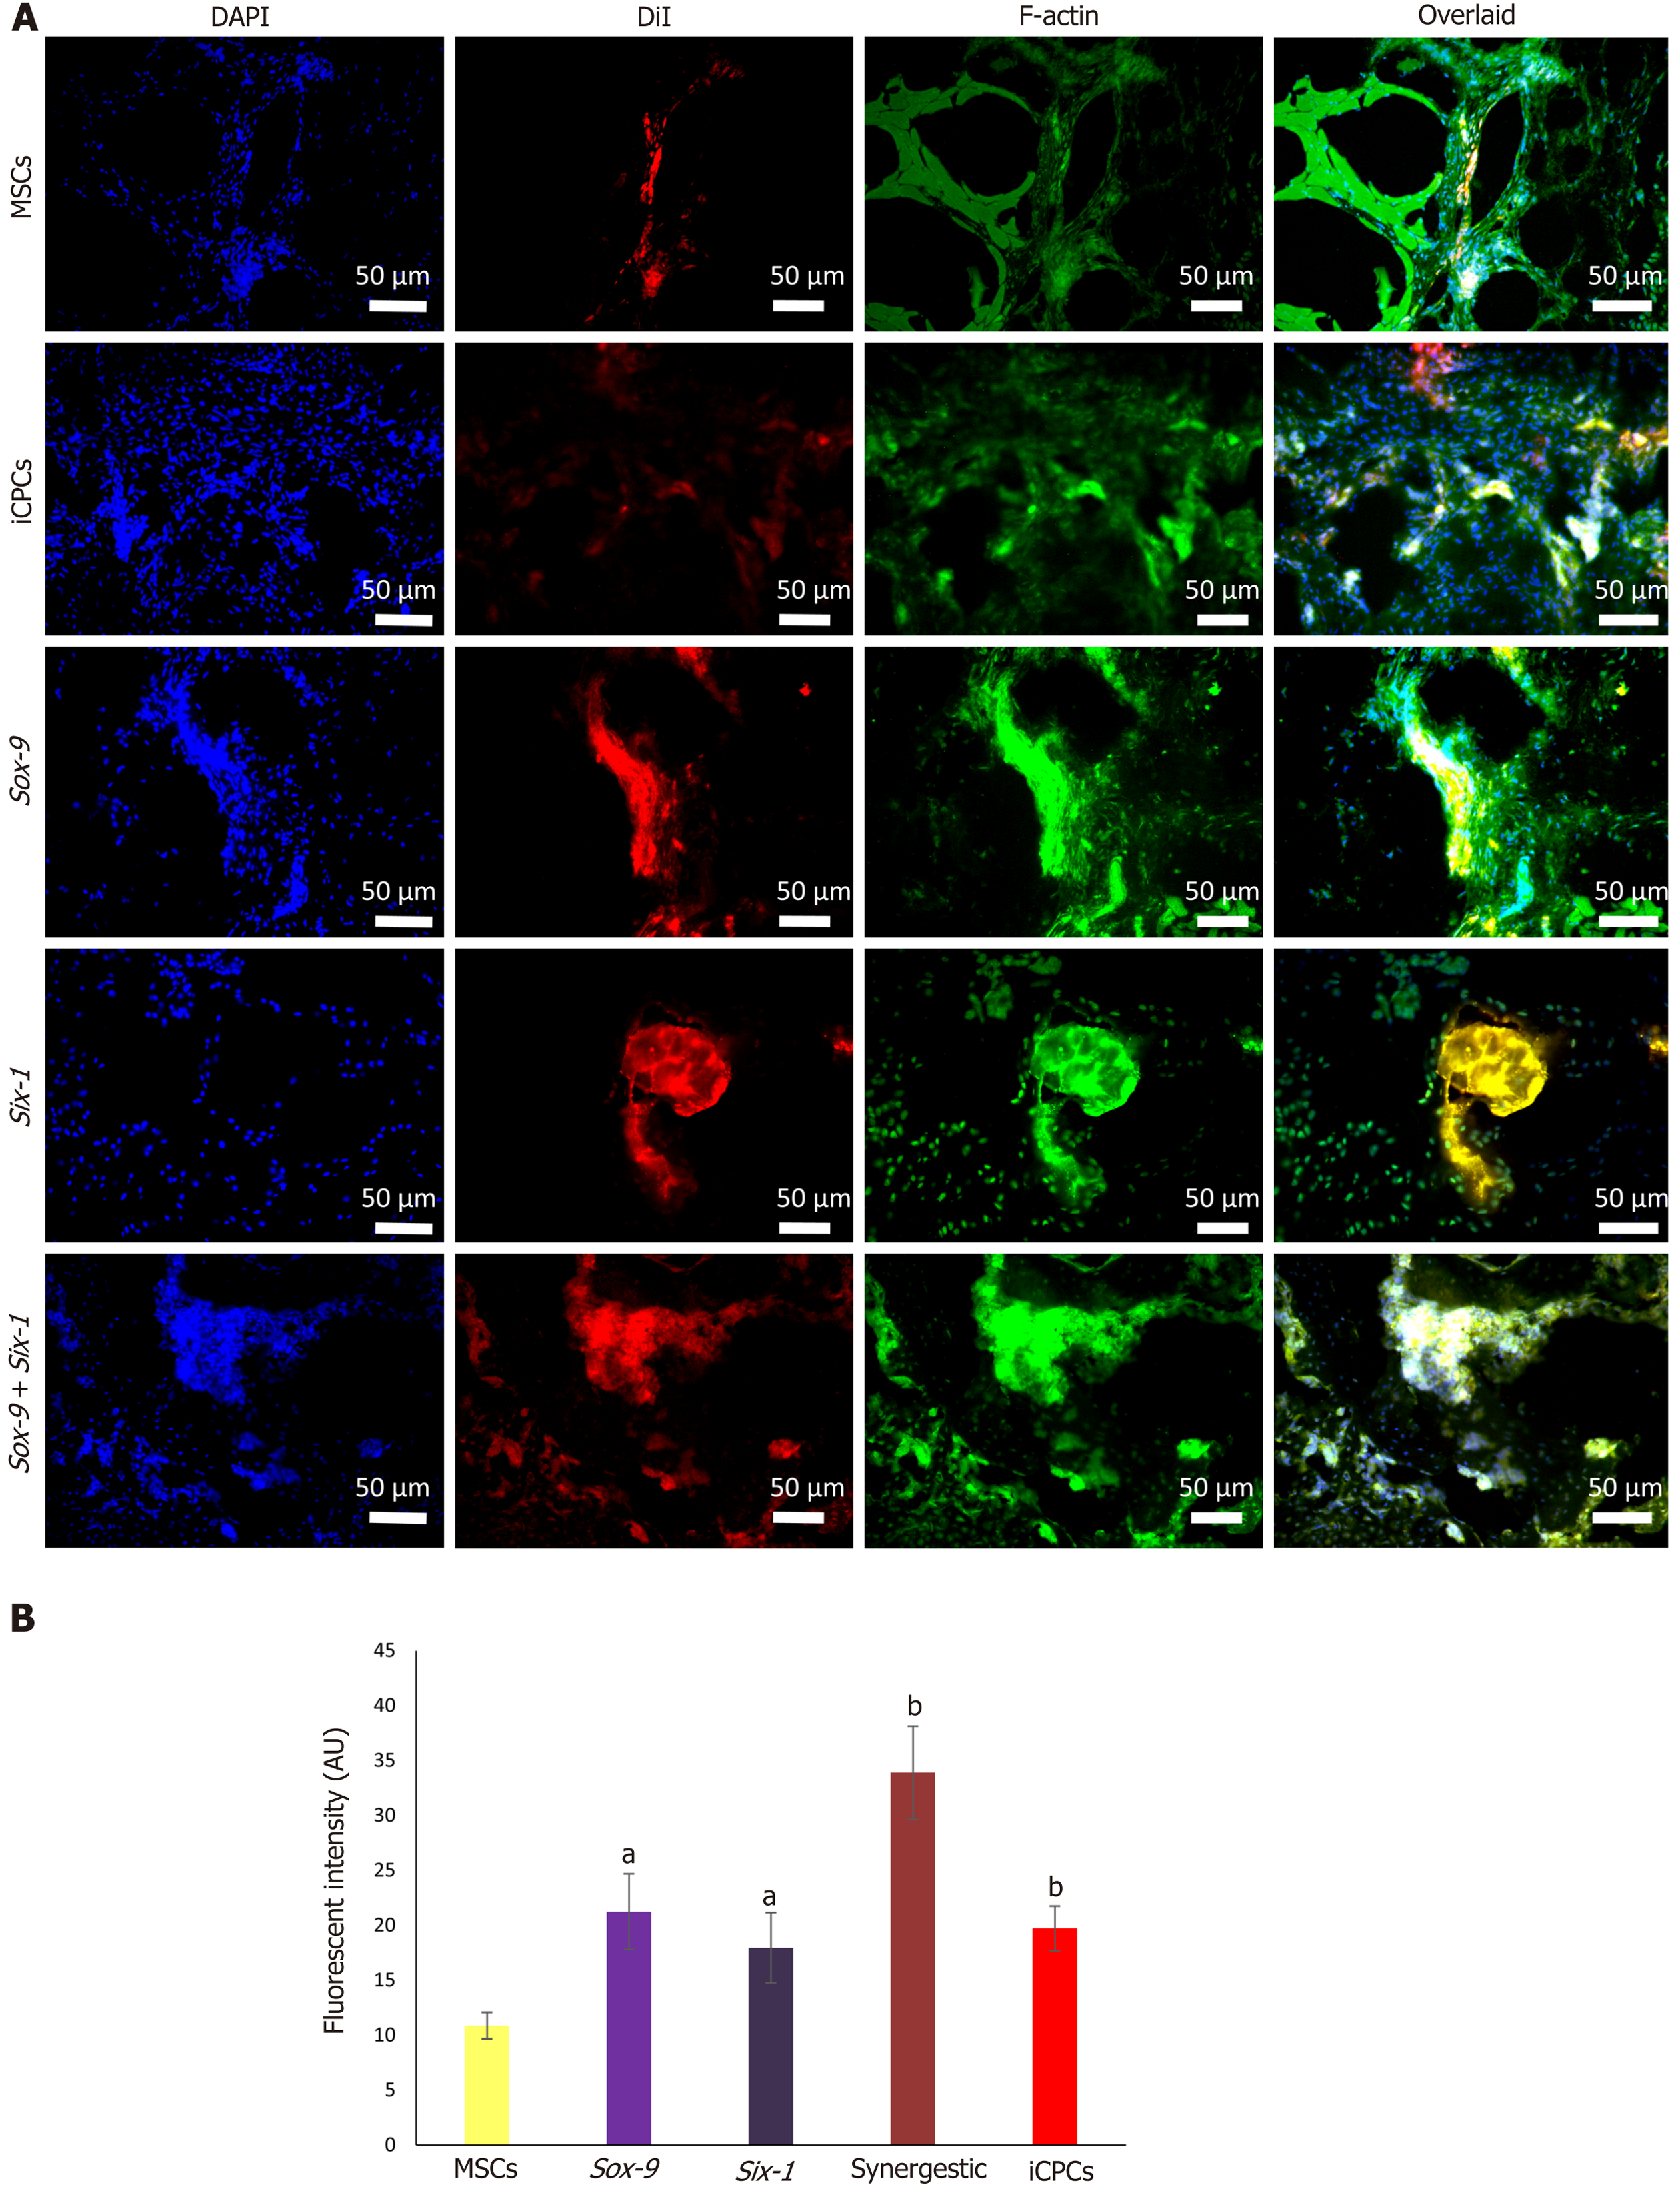
Figure 8 Tracking of transplanted cells in rat intervertebral disc degeneration model.
A: Tracking of the DiI-labeled normal and transfected mesenchymal stem cells (MSCs), and induced chondro-progenitor cells transplanted disc indicated the co-localization of red fluorescence originating from the DiI-labeled cells and green fluorescence from Alexa fluor 488 labeled phalloidin (F-actin), confirming their distribution, and homing in the intervertebral discs; B: Fluorescence intensities of the group transplanted with transfected cells showed significantly high fluorescence compared to normal MSCs. aP < 0.05 vs MSCs; bP < 0.01 vs MSCs. iCPCs: Induced chondro-progenitor cells.
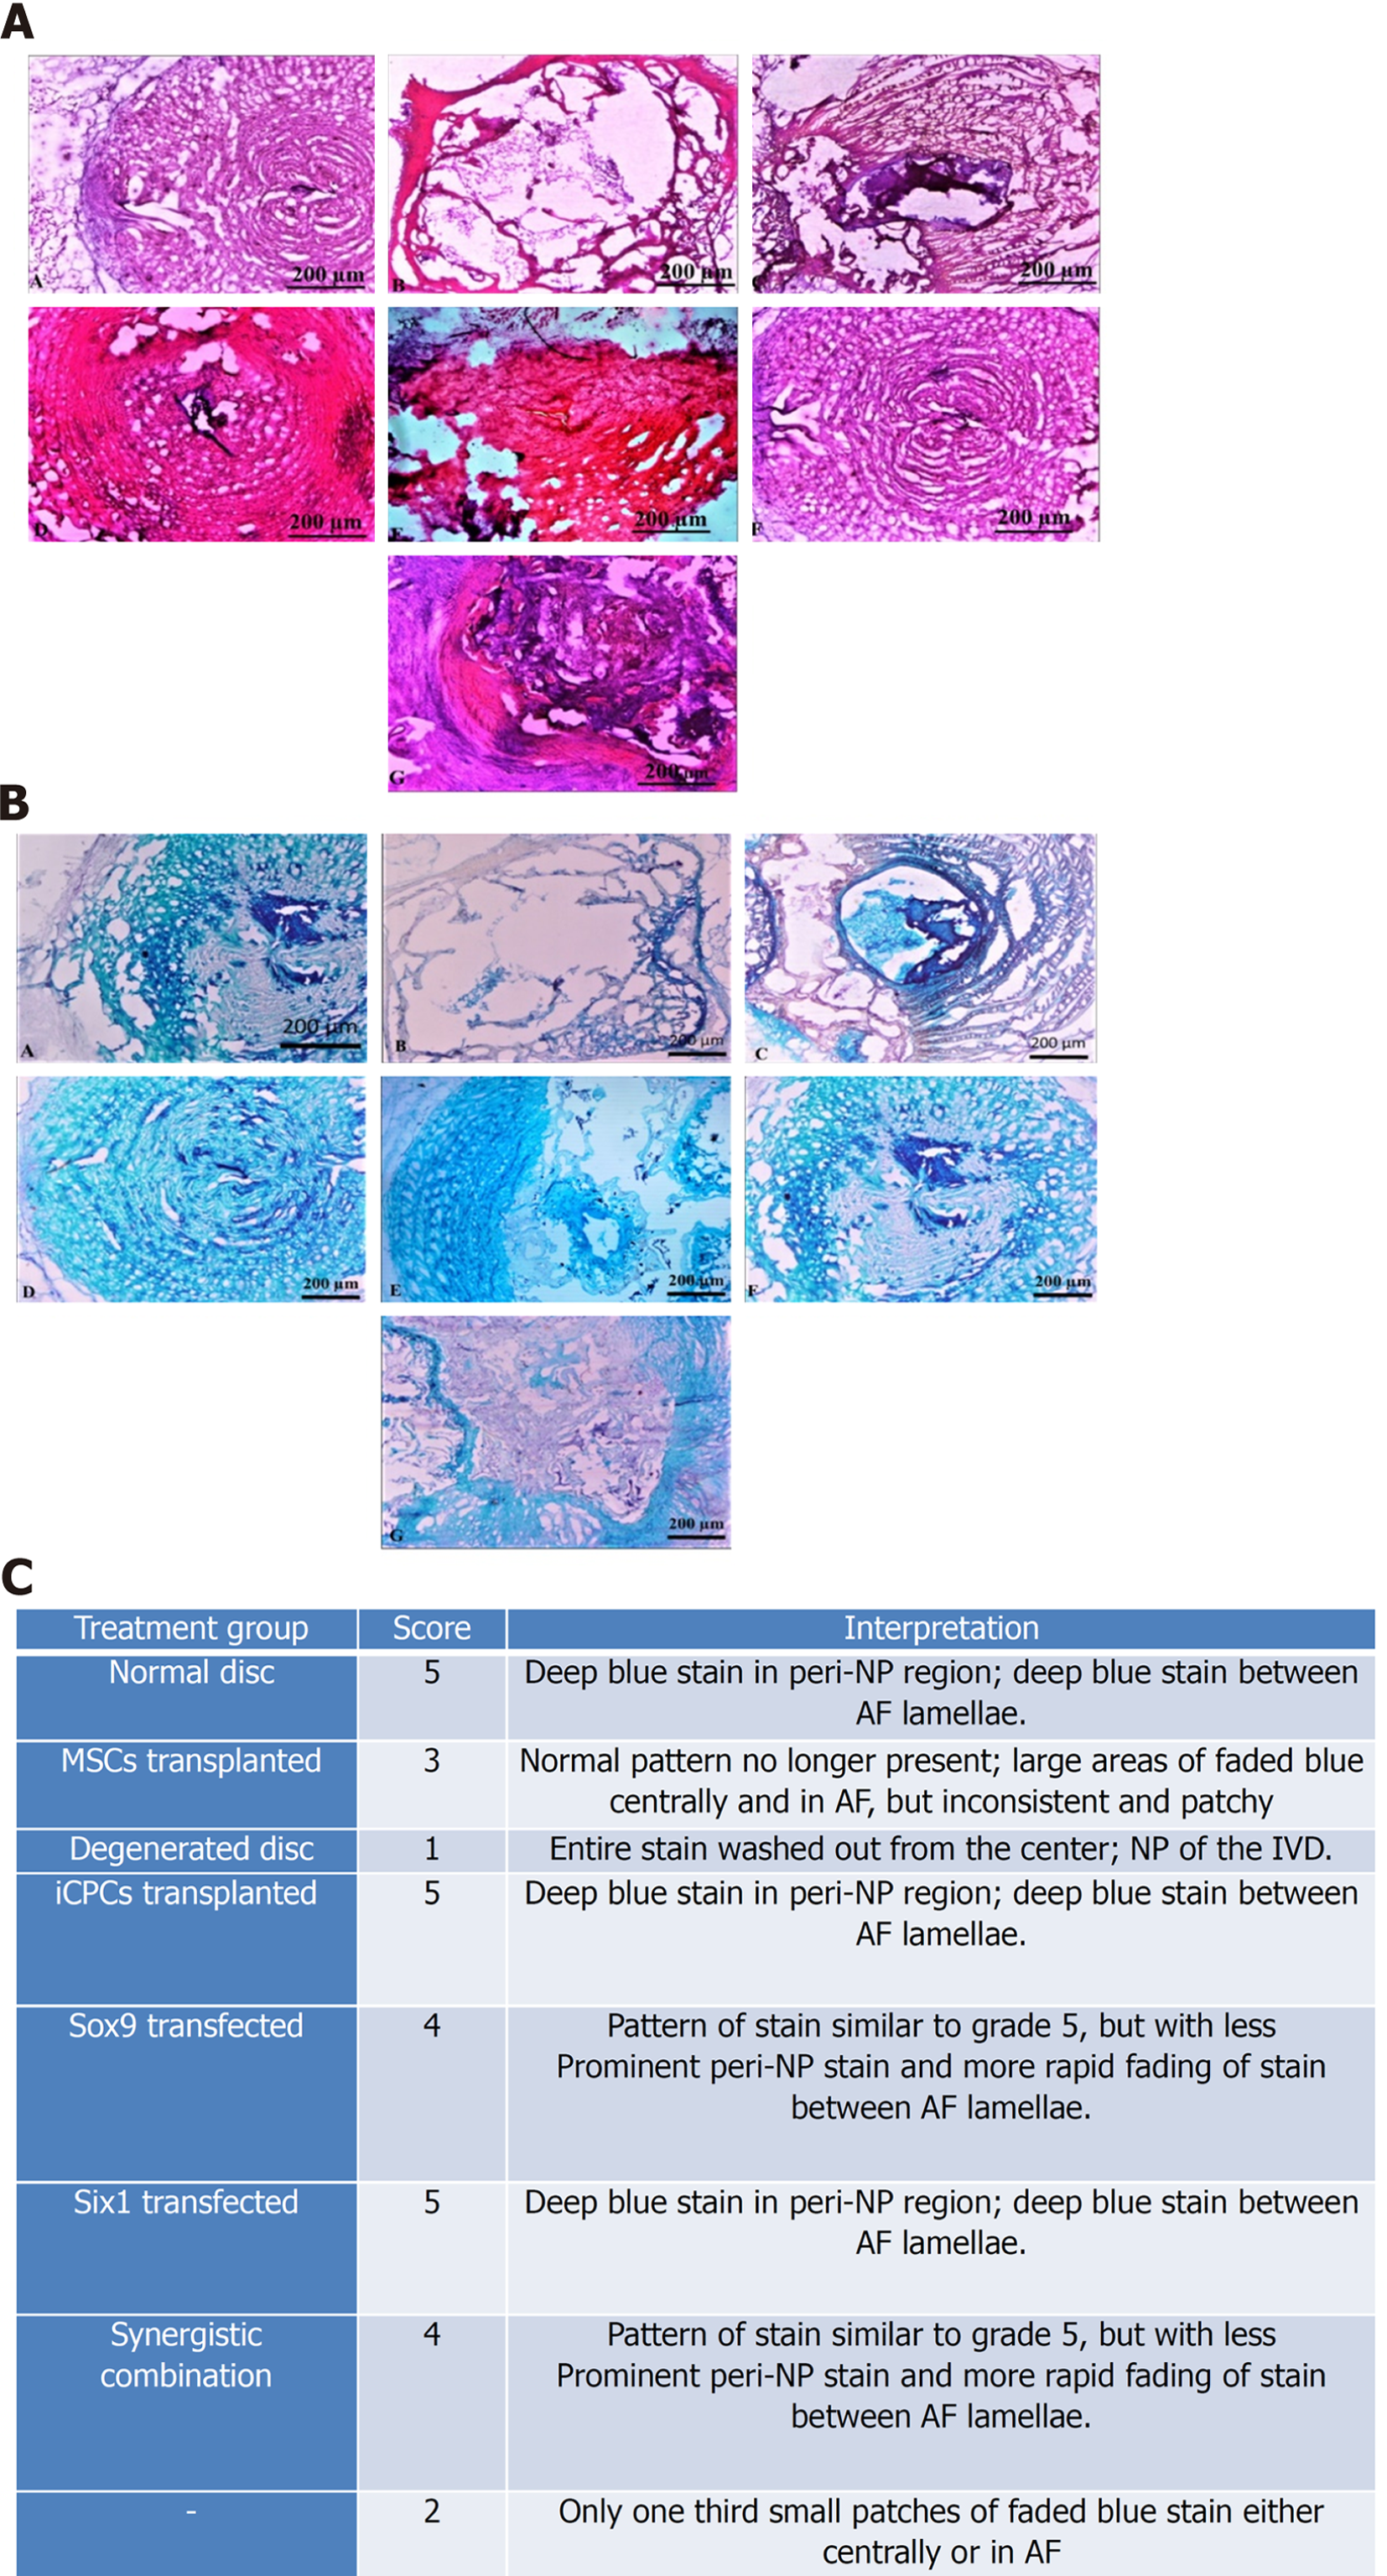
Figure 9 Histological examination of intervertebral disc.
A: (A-G) Bright field imaging of intervertebral discs (IVDs) showing nucleus pulposus (NP) content of the healthy (Co6/7), and degenerated disc (Co5/6) treated with normal mesenchymal stem cells (MSCs), transfected MSCs, and induced chondro-progenitor cells (iCPCs) (Co5/6) IVDs, in each group. Bright-field microscopic images of IVDs were captured from the cryosections stained by hematoxylin and eosin; normal healthy disc, degenerated disc, and degenerated disc transplanted with normal MSCs, Six-1 transfected MSCs, Sox-9 transfected MSCs, iCPCs, and Sox-9 + Six-1 transfected MSCs, respectively; B: (A-G) Bright-field microscopic images of IVDs were captured from the cryosections stained by Alcian blue displayed glycoproteins secreted by the transplanted cells compared to the degenerated disc; normal healthy disc, degenerated disc, and degenerated disc transplanted with normal MSCs, Six-1 transfected MSCs, Sox-9 transfected MSCs, iCPCs, and Sox-9 + Six-1 transfected MSCs, respectively; C: Histological grading with a score for regeneration. AF: Annular fibrosus.
- Citation: Khalid S, Ekram S, Salim A, Chaudhry GR, Khan I. Transcription regulators differentiate mesenchymal stem cells into chondroprogenitors, and their in vivo implantation regenerated the intervertebral disc degeneration. World J Stem Cells 2022; 14(2): 163-182
- URL: https://www.wjgnet.com/1948-0210/full/v14/i2/163.htm
- DOI: https://dx.doi.org/10.4252/wjsc.v14.i2.163


