Copyright
©The Author(s) 2022.
World J Stem Cells. Oct 26, 2022; 14(10): 756-776
Published online Oct 26, 2022. doi: 10.4252/wjsc.v14.i10.756
Published online Oct 26, 2022. doi: 10.4252/wjsc.v14.i10.756
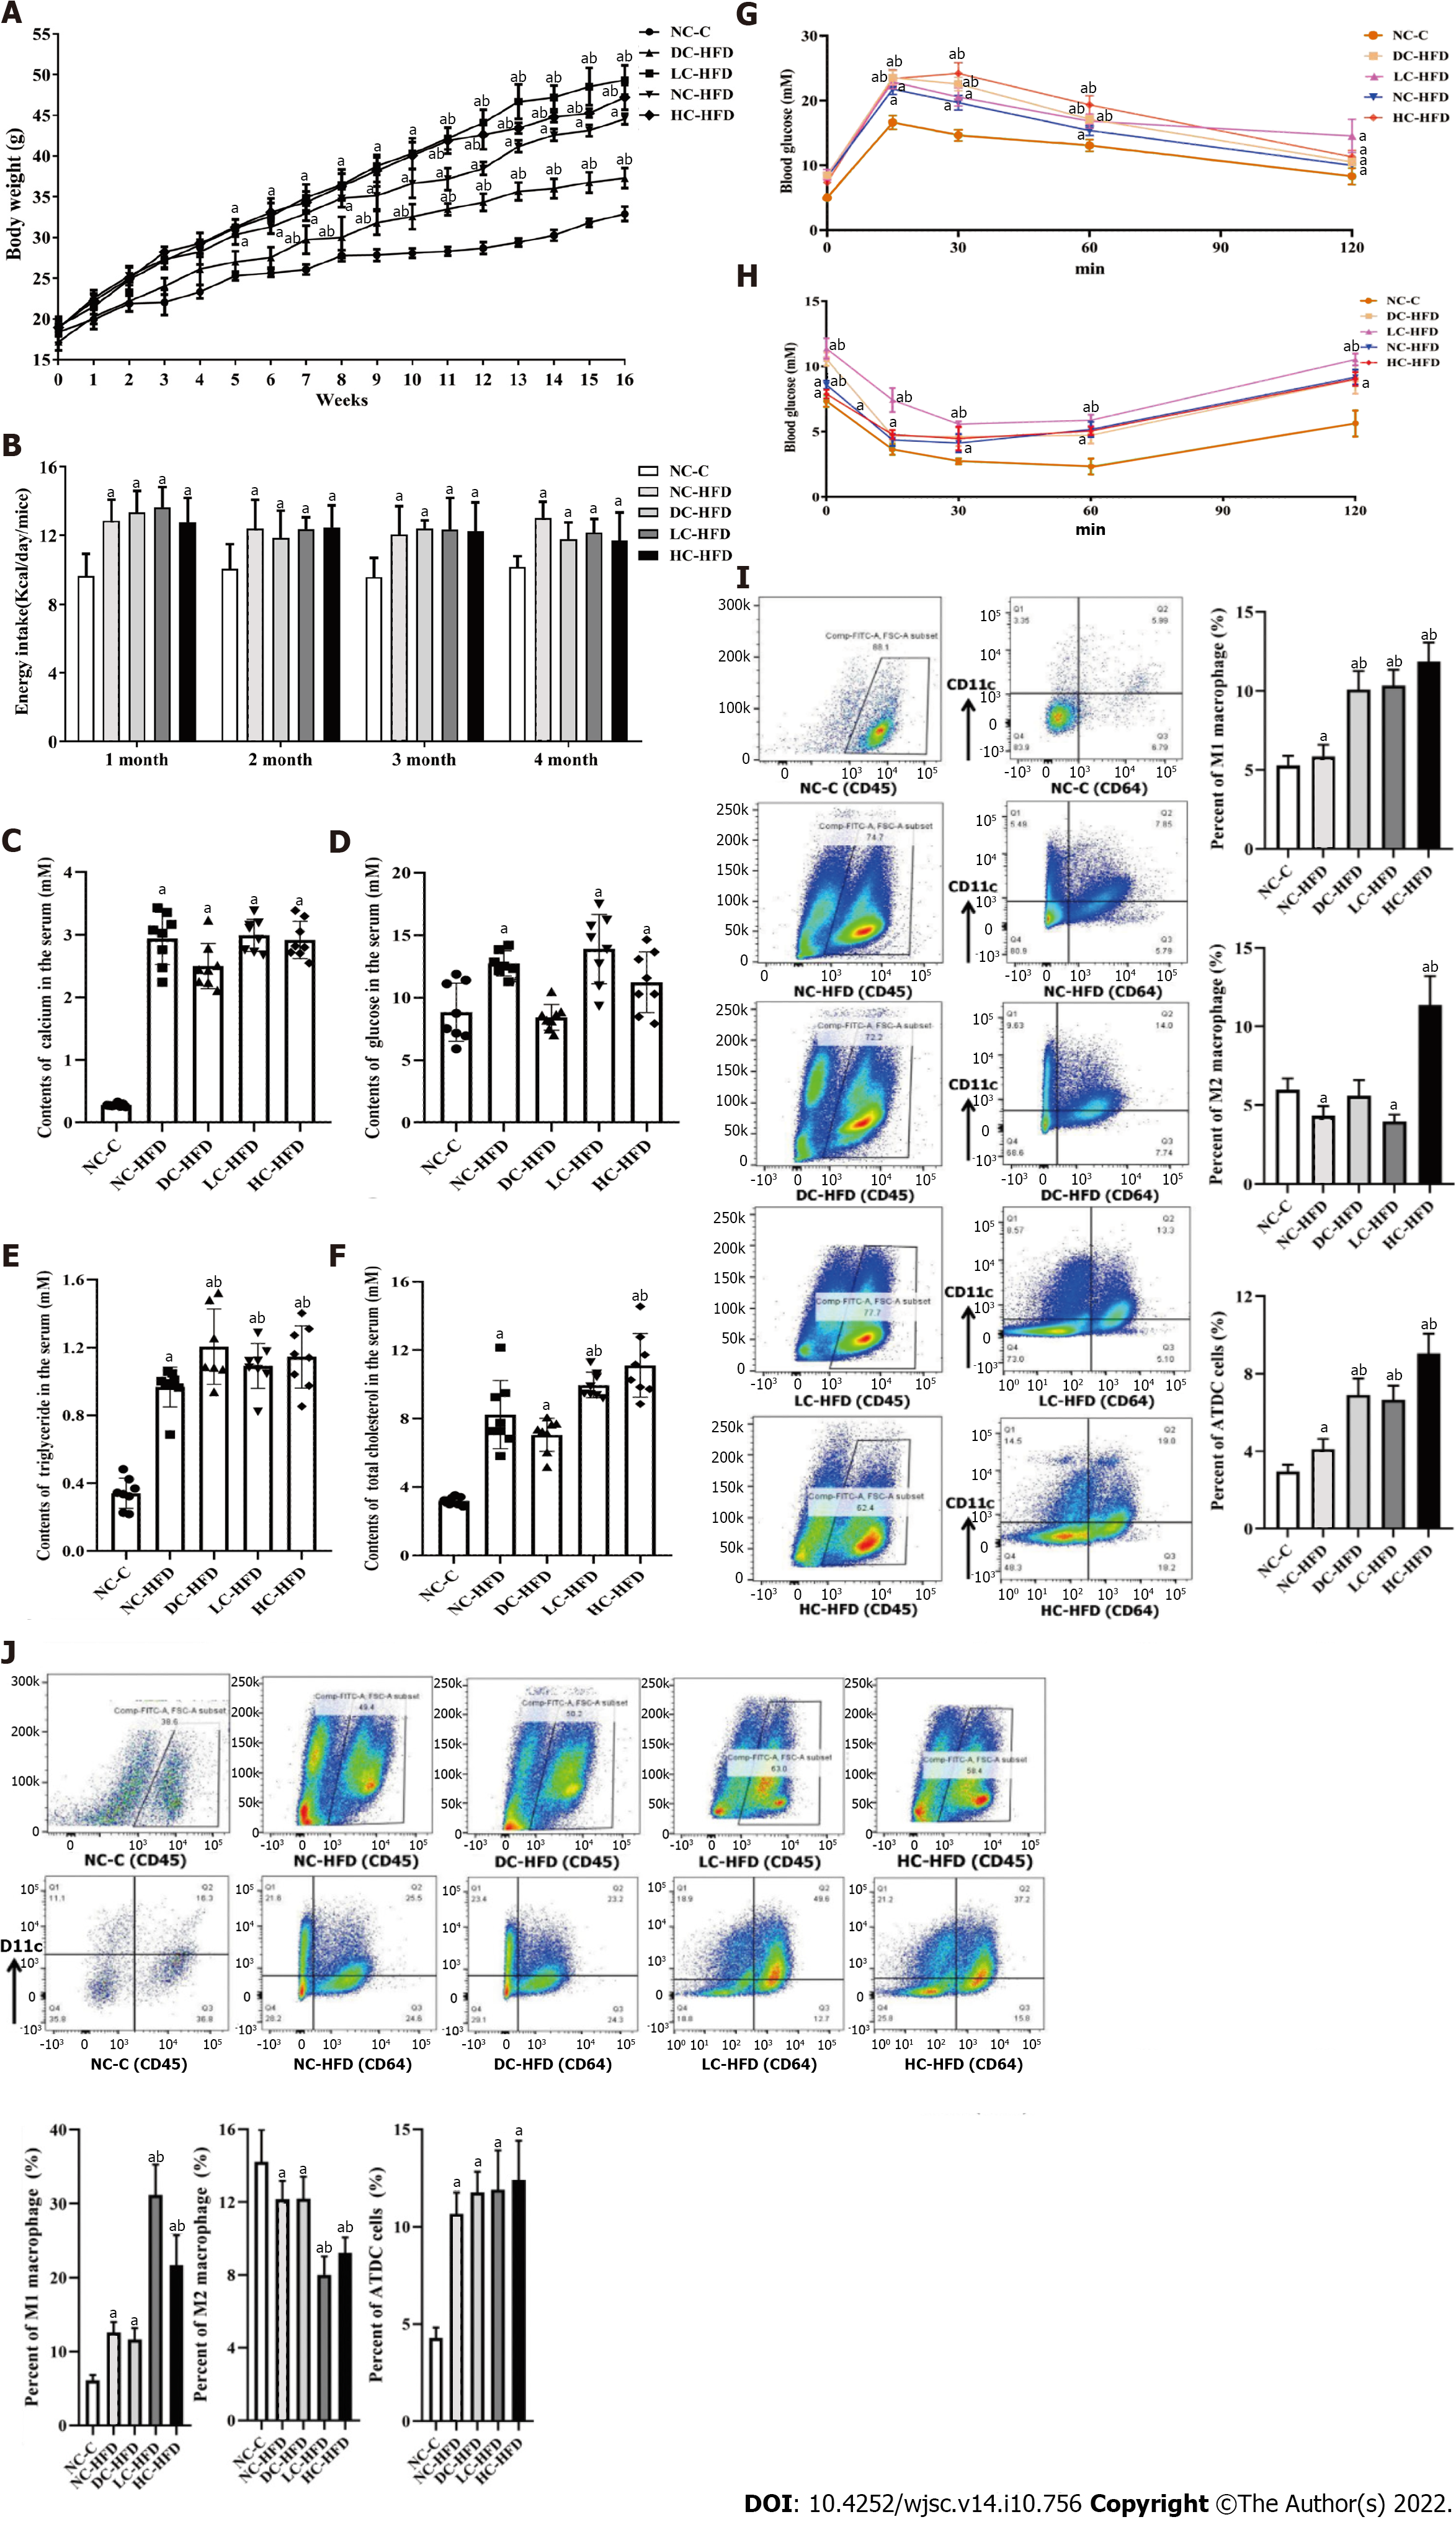
Figure 1 Abnormal dietary calcium intake during pregnancy and lactation aggravated development of obesity among male offspring.
A: Body weight; B: Energy intake; C: Contents of serum calcium; D: Contents of serum glucose; E: Contents of serum triglyceride; F: Contents of serum total cholesterol; G: Oral glucose tolerance test; H: Insulin glucose tolerance test; I and J: The infiltration and percentages of M1 macrophages, M2 macrophages and ATDC cells in the epididymal white adipose tissue and inguinal white adipose tissue. All pooled data was represented as mean ± standard error (n = 10/group). One-way analysis of variance was performed to compare the differences among the above four groups, and then Student–Newman–Keuls test was used to determine the differences between each two groups. Compared to the NC-C group, aP < 0.05. Compared to the NC-HFD group, bP < 0.05. NC-C: Normal-calcium reproductive diet and normal-fat diet after weaning; NC-HFD: Normal-calcium reproductive diet and high-fat-diet (HFD) after weaning; DC-HFD: Deficient-calcium reproductive diet and HFD after weaning; LC-HFD: Low-calcium reproductive diet and HFD after weaning; HC-HFD: High-calcium diet and HFD after weaning; eWAT: Epididymal white adipose tissue; iWAT: Inguinal white adipose tissue.
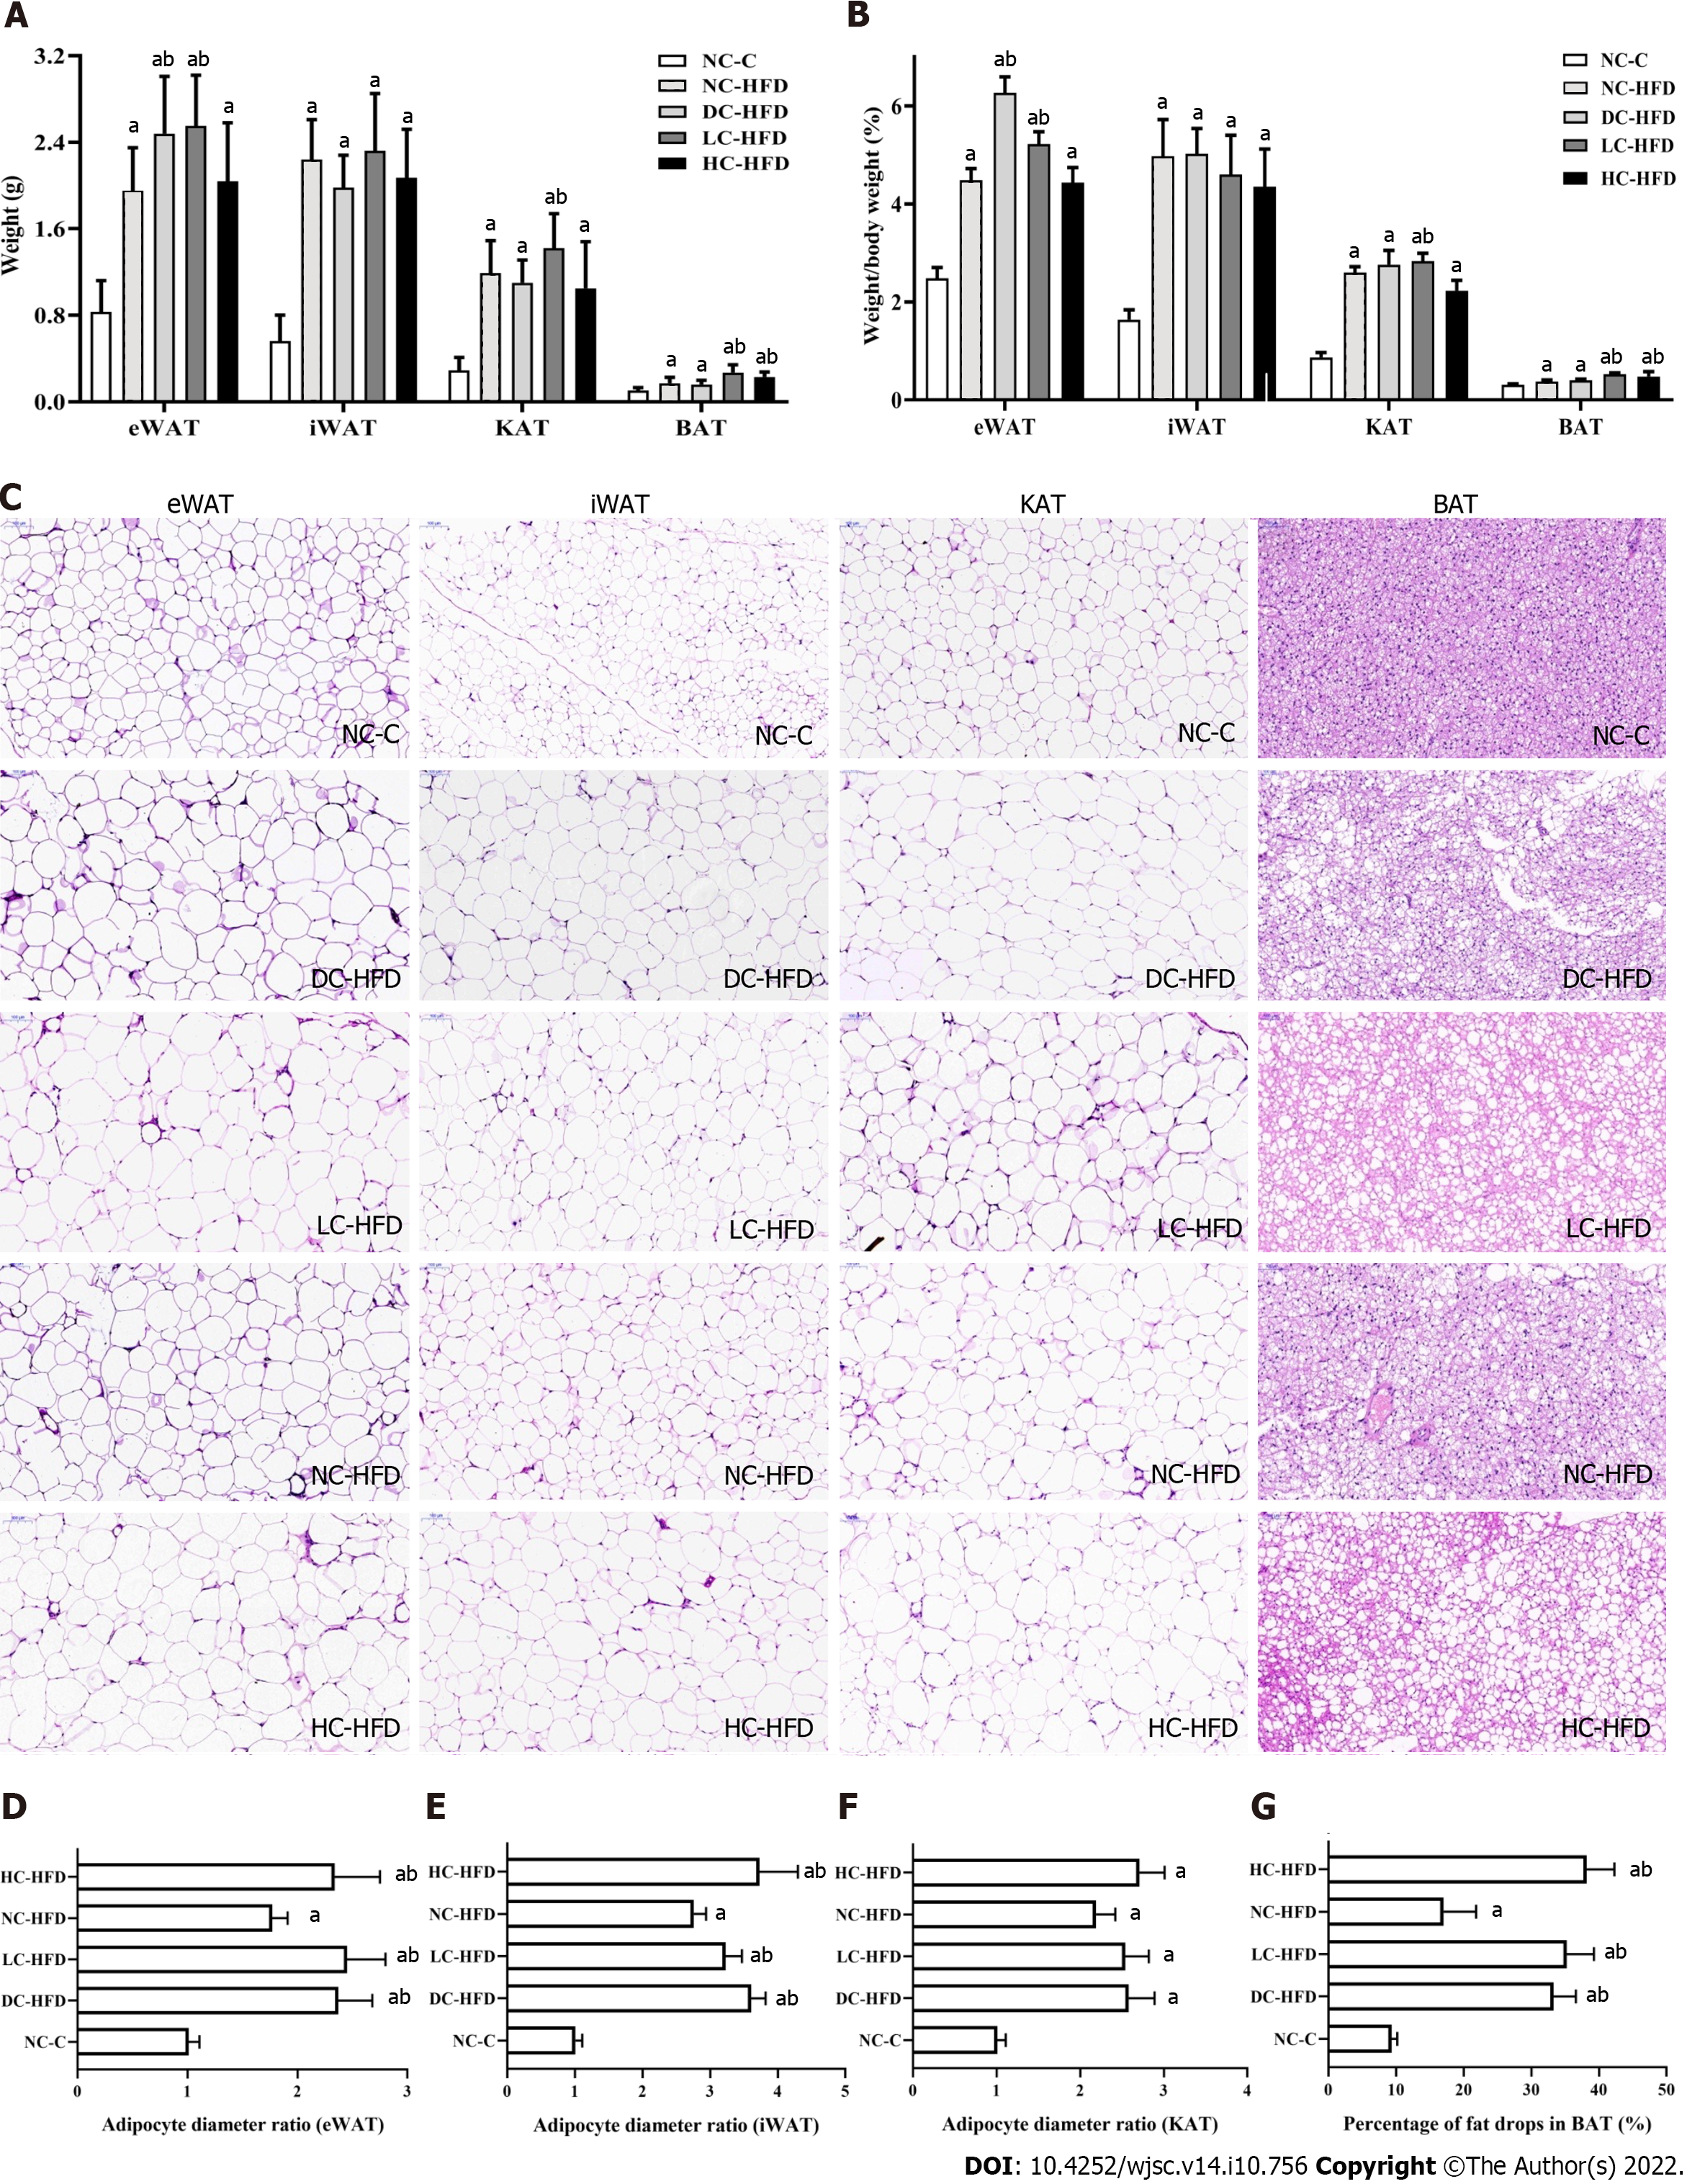
Figure 2 Abnormal dietary calcium intake during pregnancy and lactation affected the weight and morphology of adipose tissues among male offspring.
A: Weights of the eWAT, iWAT, KAT and BAT; B: Percentage of eWAT, iWAT, KAT and BAT in body weight; C–G: Morphology of adipocytes in eWAT, iWAT, KAT and BAT by hematoxylin and eosin staining. All pooled data was represented as mean ± standard error (n = 10/group). One-way analysis of variance (ANOVA) was performed to compare the differences among the above four groups, and then Student–Newman–Keuls was involved to determine the differences between each two groups. Compared to the NC-C group, aP < 0.05. Compared to the NC-HFD group, bP < 0.05. NC-C: Normal-calcium reproductive diet and normal-fat diet after weaning; NC-HFD: Normal-calcium reproductive diet and high-fat-diet (HFD) after weaning; DC-HFD: Deficient-calcium reproductive diet and HFD after weaning; LC-HFD: Low-calcium reproductive diet and HFD after weaning; HC-HFD: High-calcium reproductive diet and HFD after weaning; eWAT: Epididymal white adipose tissue; iWAT: Inguinal white adipose tissue; KAT: Kidney adipose tissue; BAT: Brown adipose tissue.
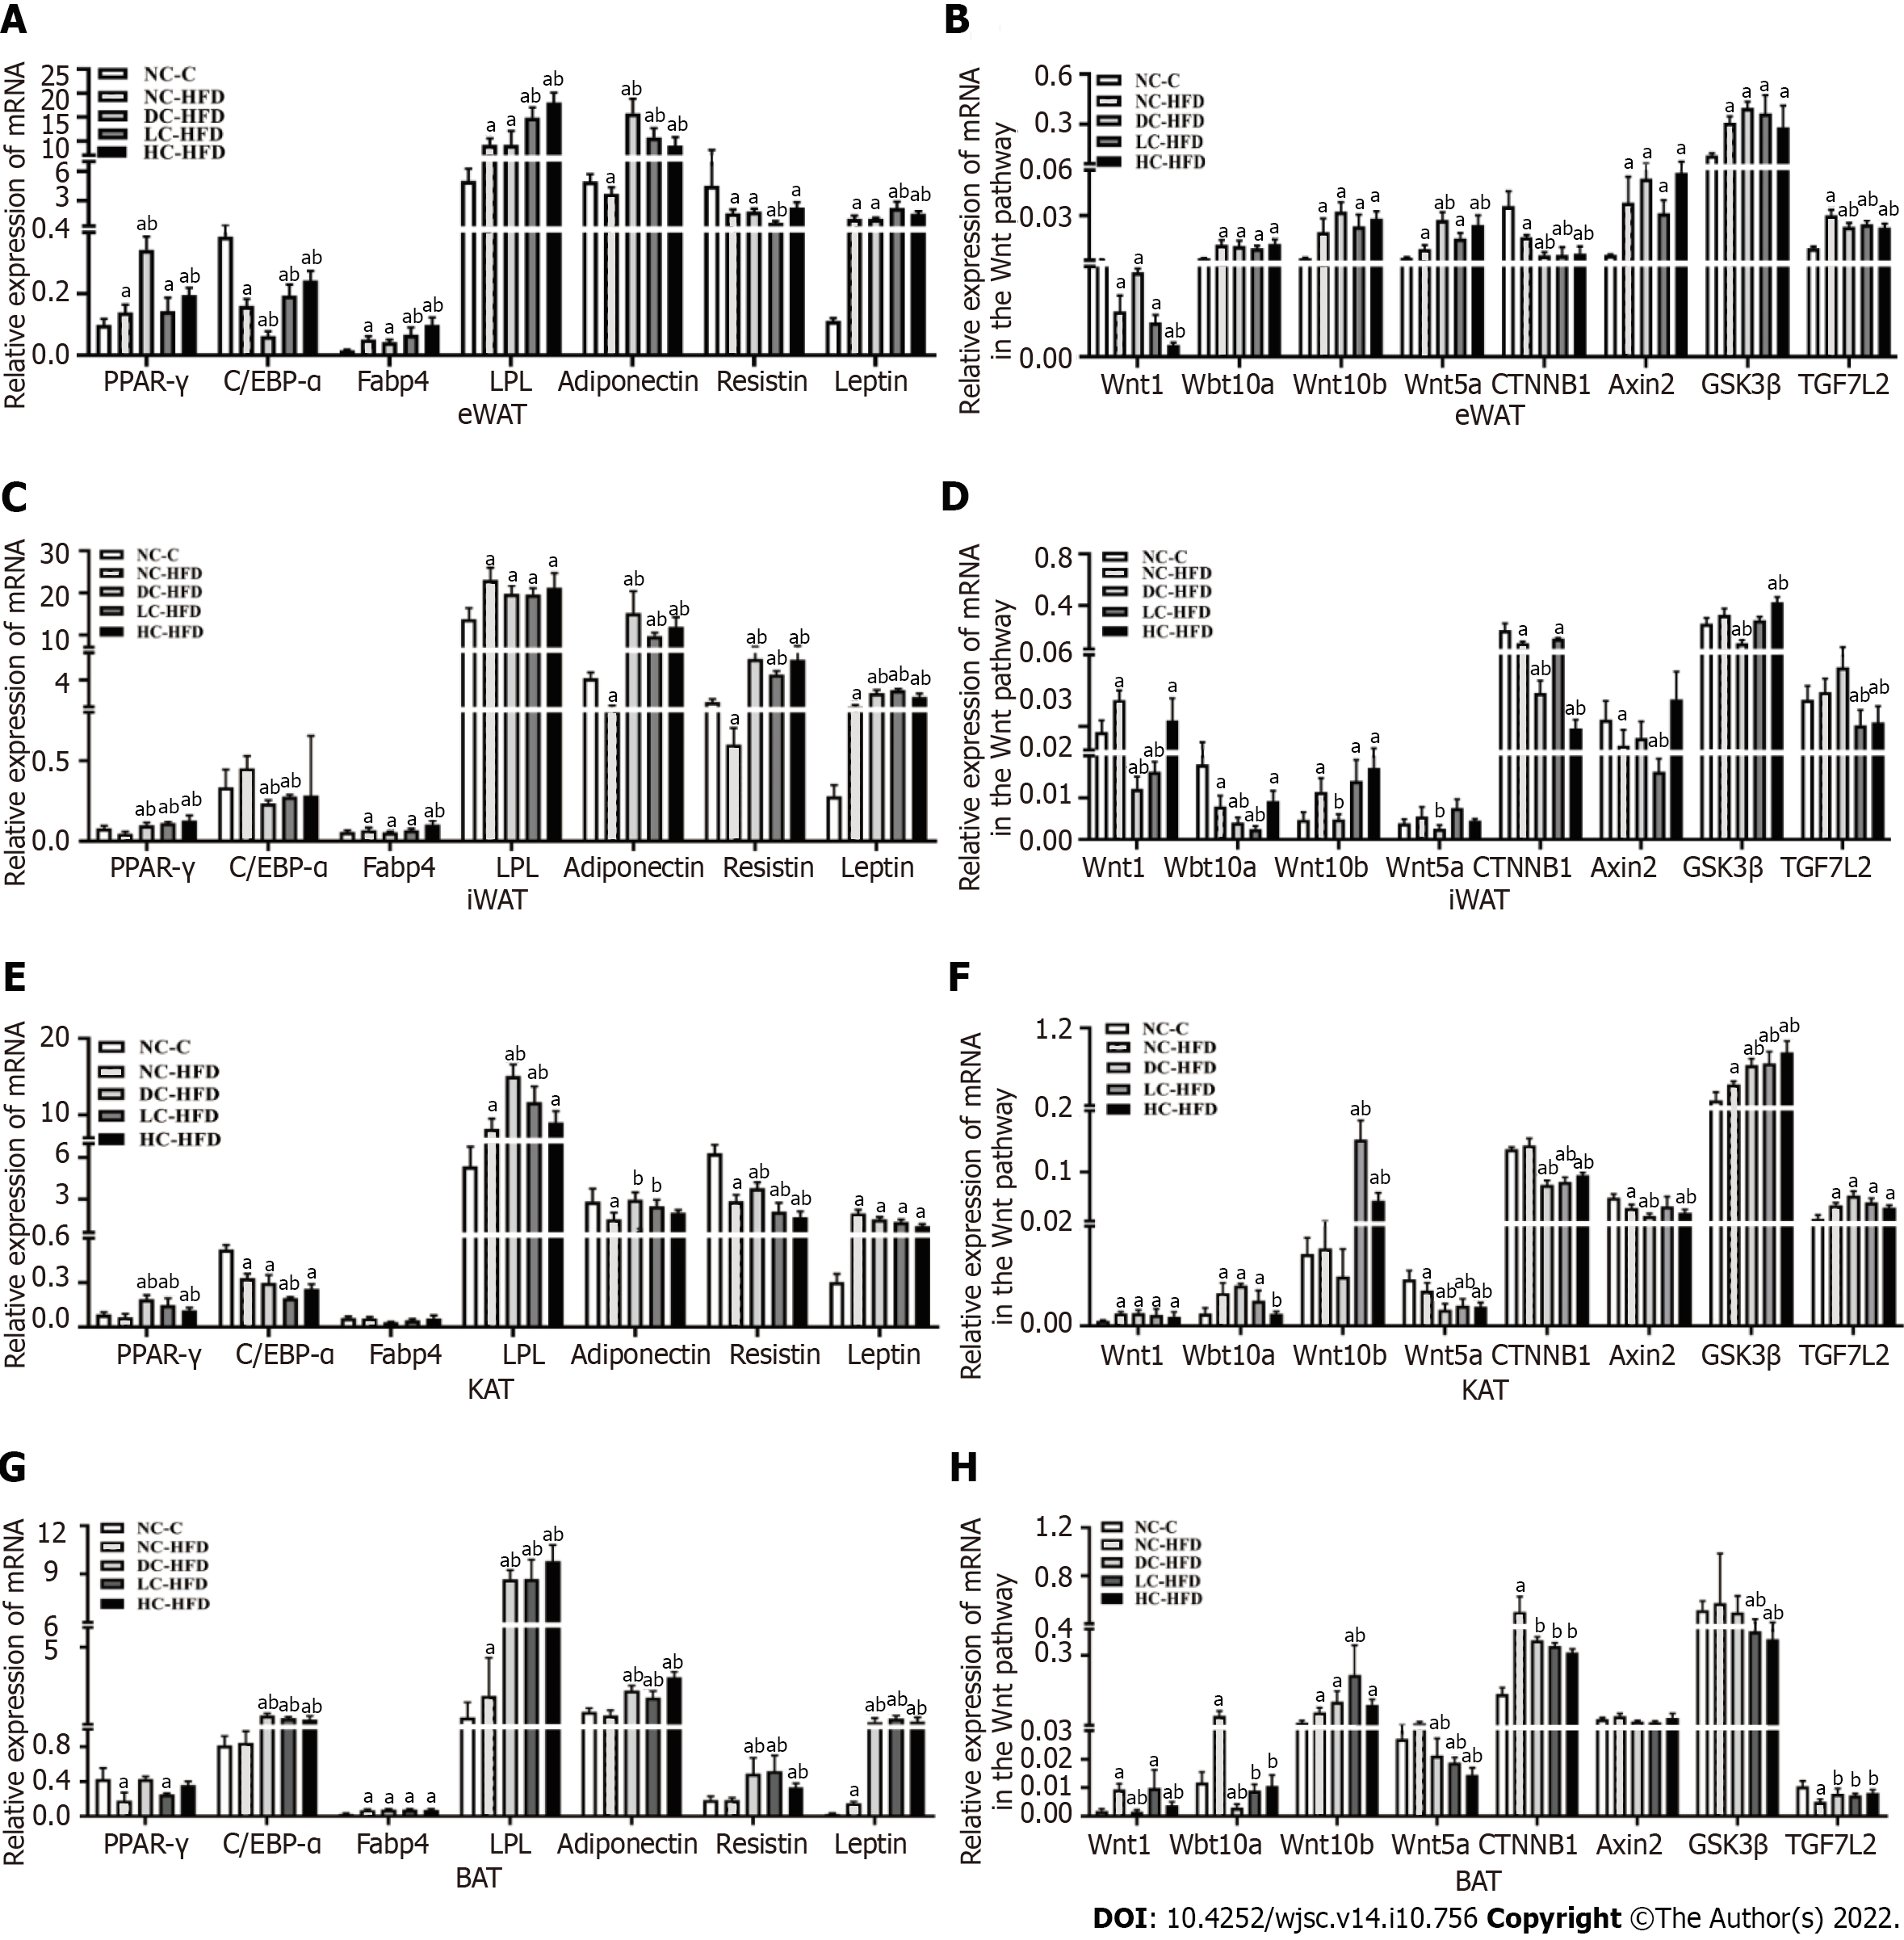
Figure 3 Effects of different dietary calcium intake during pregnancy and lactation on expression of target genes for adipogenic differentiation and Wnt/β-catenin signaling pathway in adipose tissues among male offspring.
A, C, E and G: Expression of genes related to adipogenic differentiation in eWAT, iWAT, KAT and BAT; B, D, F and H: Expression of genes related to the Wnt/β-catenin signaling pathway in eWAT, iWAT, KAT and BAT. All data presented as mean ± standard error (n = 10/group). One-way analysis of variance was performed to compare the differences among the above four groups, and then Student–Newman–Keuls test was used to determine the differences between each two groups. Compared to the NC-C group, aP < 0.05. Compared to the NC-HFD group, bP < 0.05. NC-C: Normal-calcium reproductive diet and normal-fat diet after weaning; NC-HFD: Normal-calcium reproductive diet and high-fat-diet (HFD) after weaning; DC-HFD: Deficient-calcium reproductive diet and HFD after weaning; LC-HFD: Low-calcium reproductive diet and HFD after weaning; HC-HFD: High-calcium reproductive diet and HFD after weaning; eWAT: Epididymal white adipose tissue; iWAT: Inguinal white adipose tissue; KAT: Kidney adipose tissue; BAT: Brown adipose tissue.
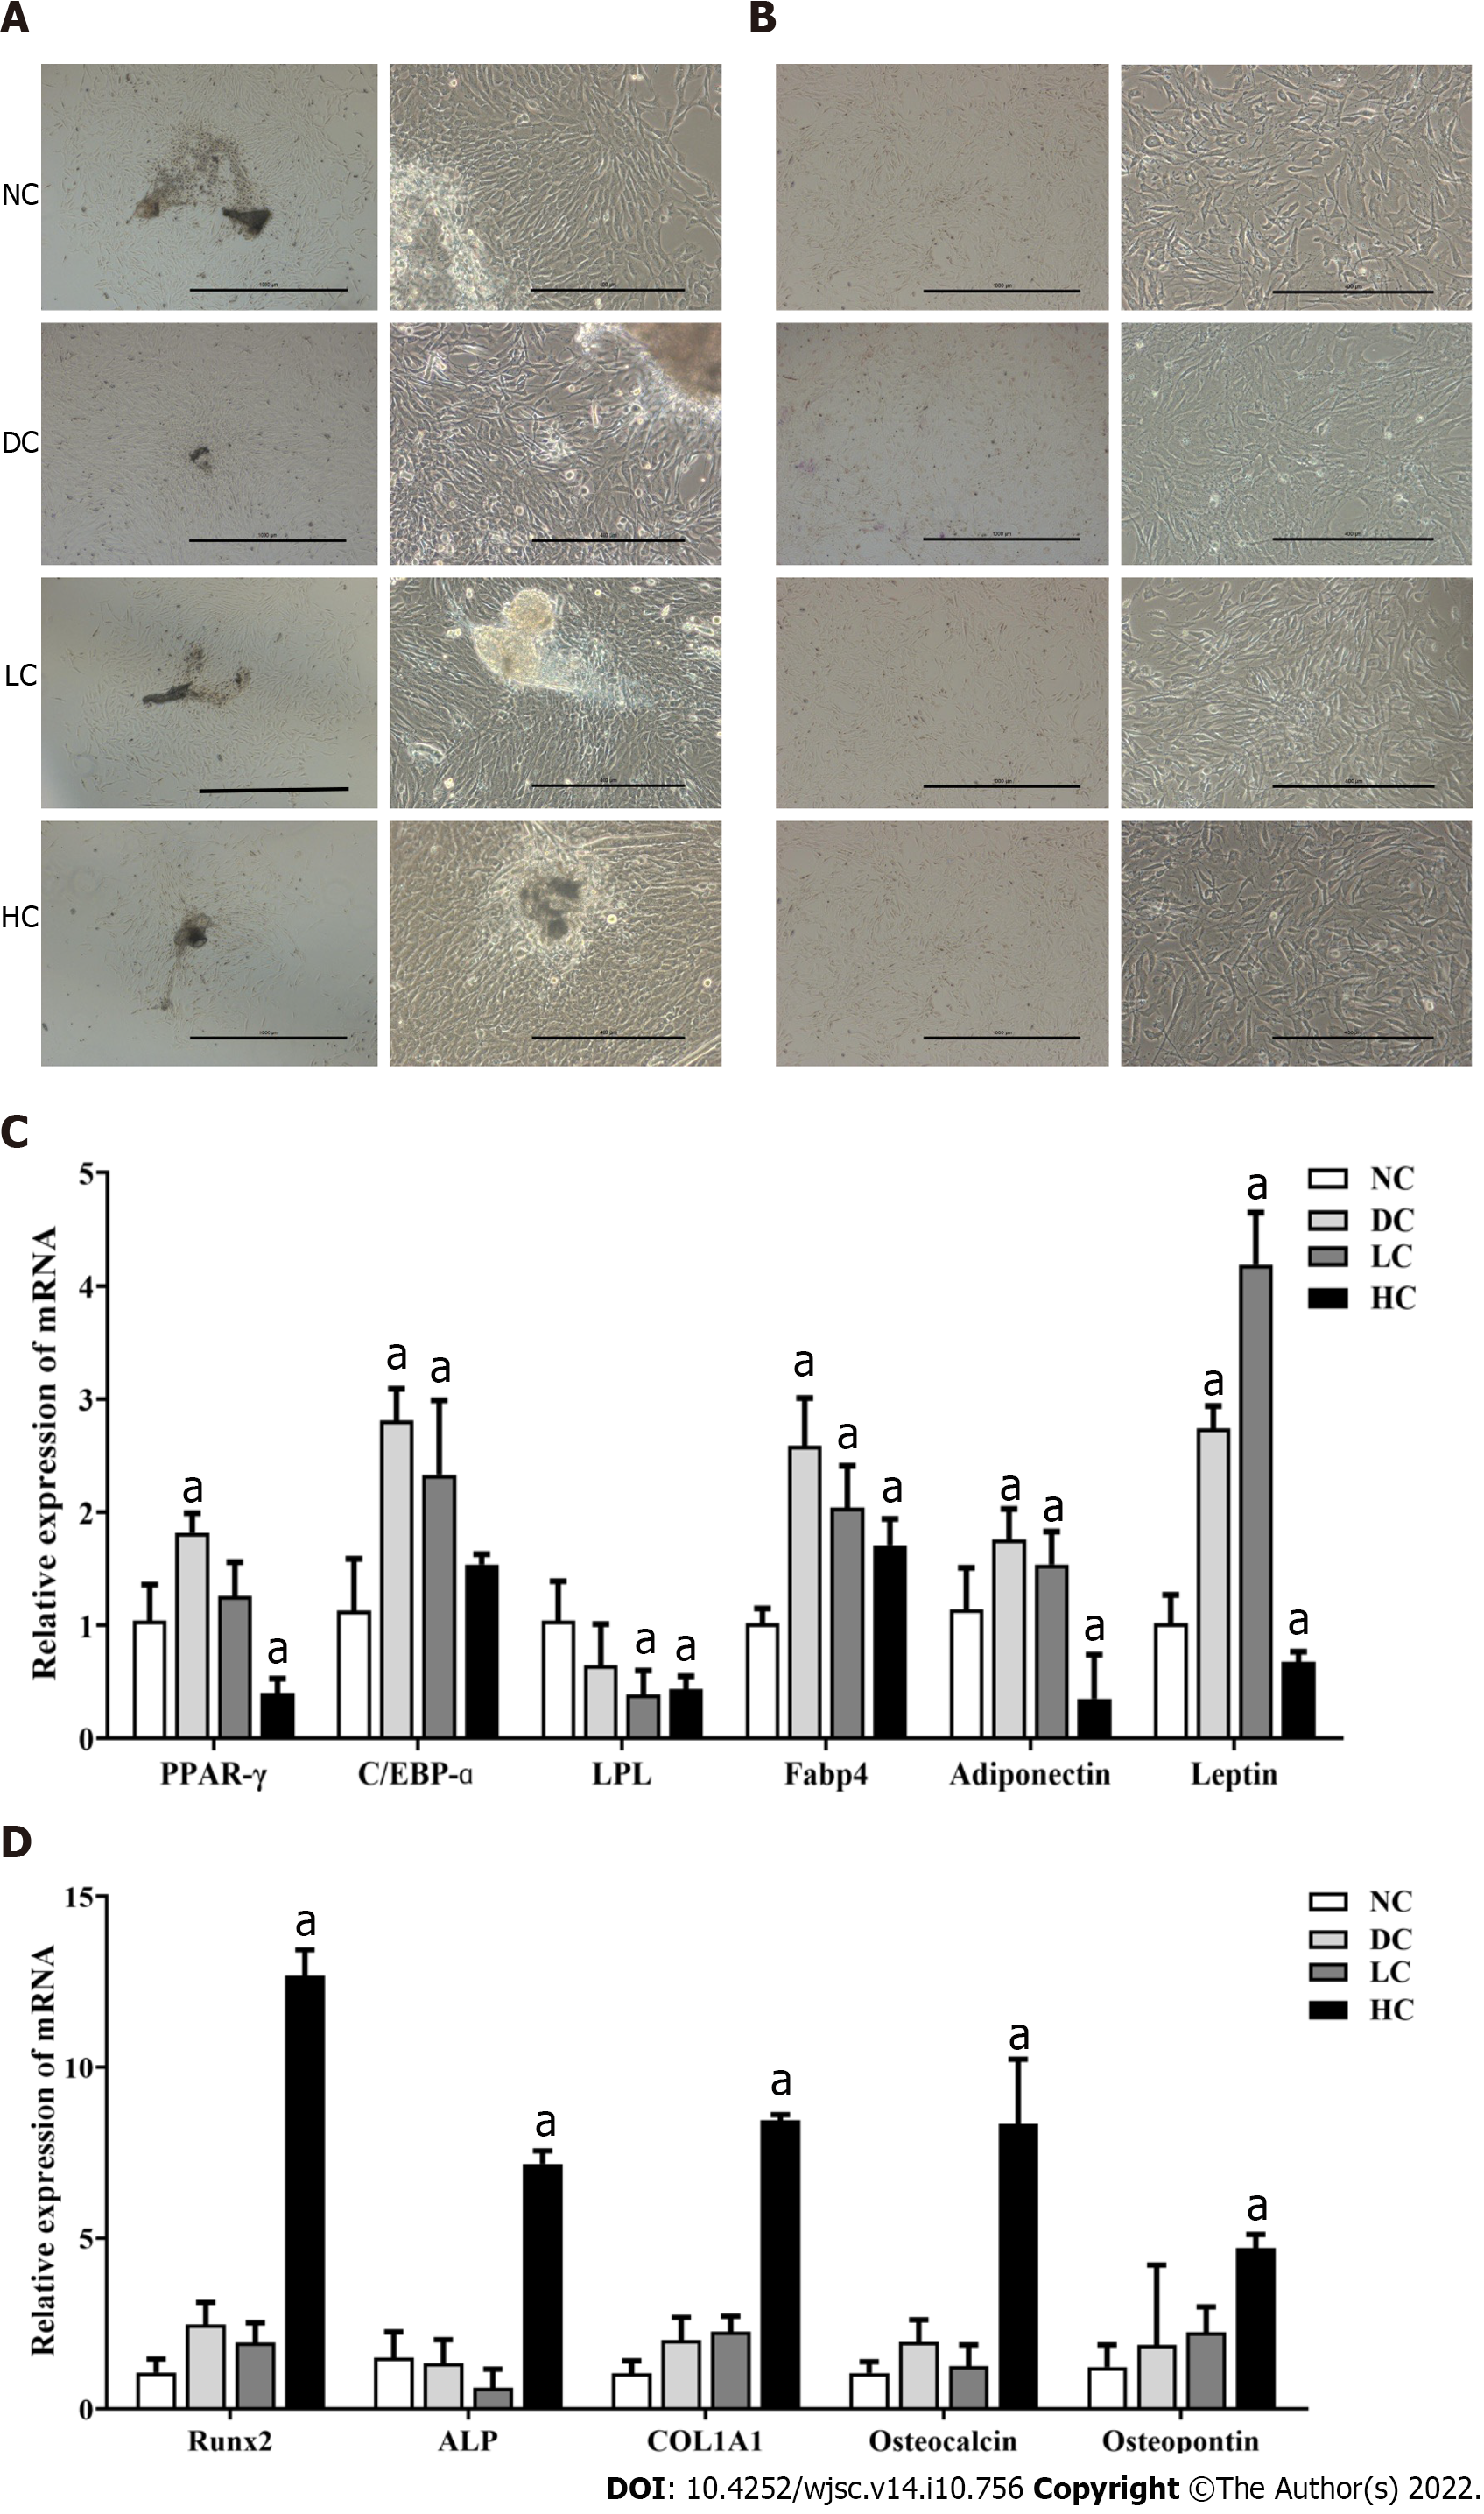
Figure 4 Effects of maternal dietary calcium intake during pregnancy and lactation on multi-differentiation potential of bone marrow mesenchymal stem cells among male offspring.
A: Morphology of P0 BMSCs; B: Morphology of P3 BMSCs; C: Expression of genes related to adipogenic differentiation; D: Expression of genes related to osteogenic differentiation. All data presented as mean ± standard error (n = 9/ group). One-way analysis of variance was performed to compare the differences among the above four groups, and then Student–Newman–Keuls test was used to determine the differences between each two groups. Compared to the NC group, aP < 0.05. NC: Normal-calcium reproductive diet; DC: Deficient-calcium reproductive diet; LC: Low-calcium reproductive diet; HC: High-calcium reproductive diet; BMSCs: Bone marrow mesenchymal stem cells.
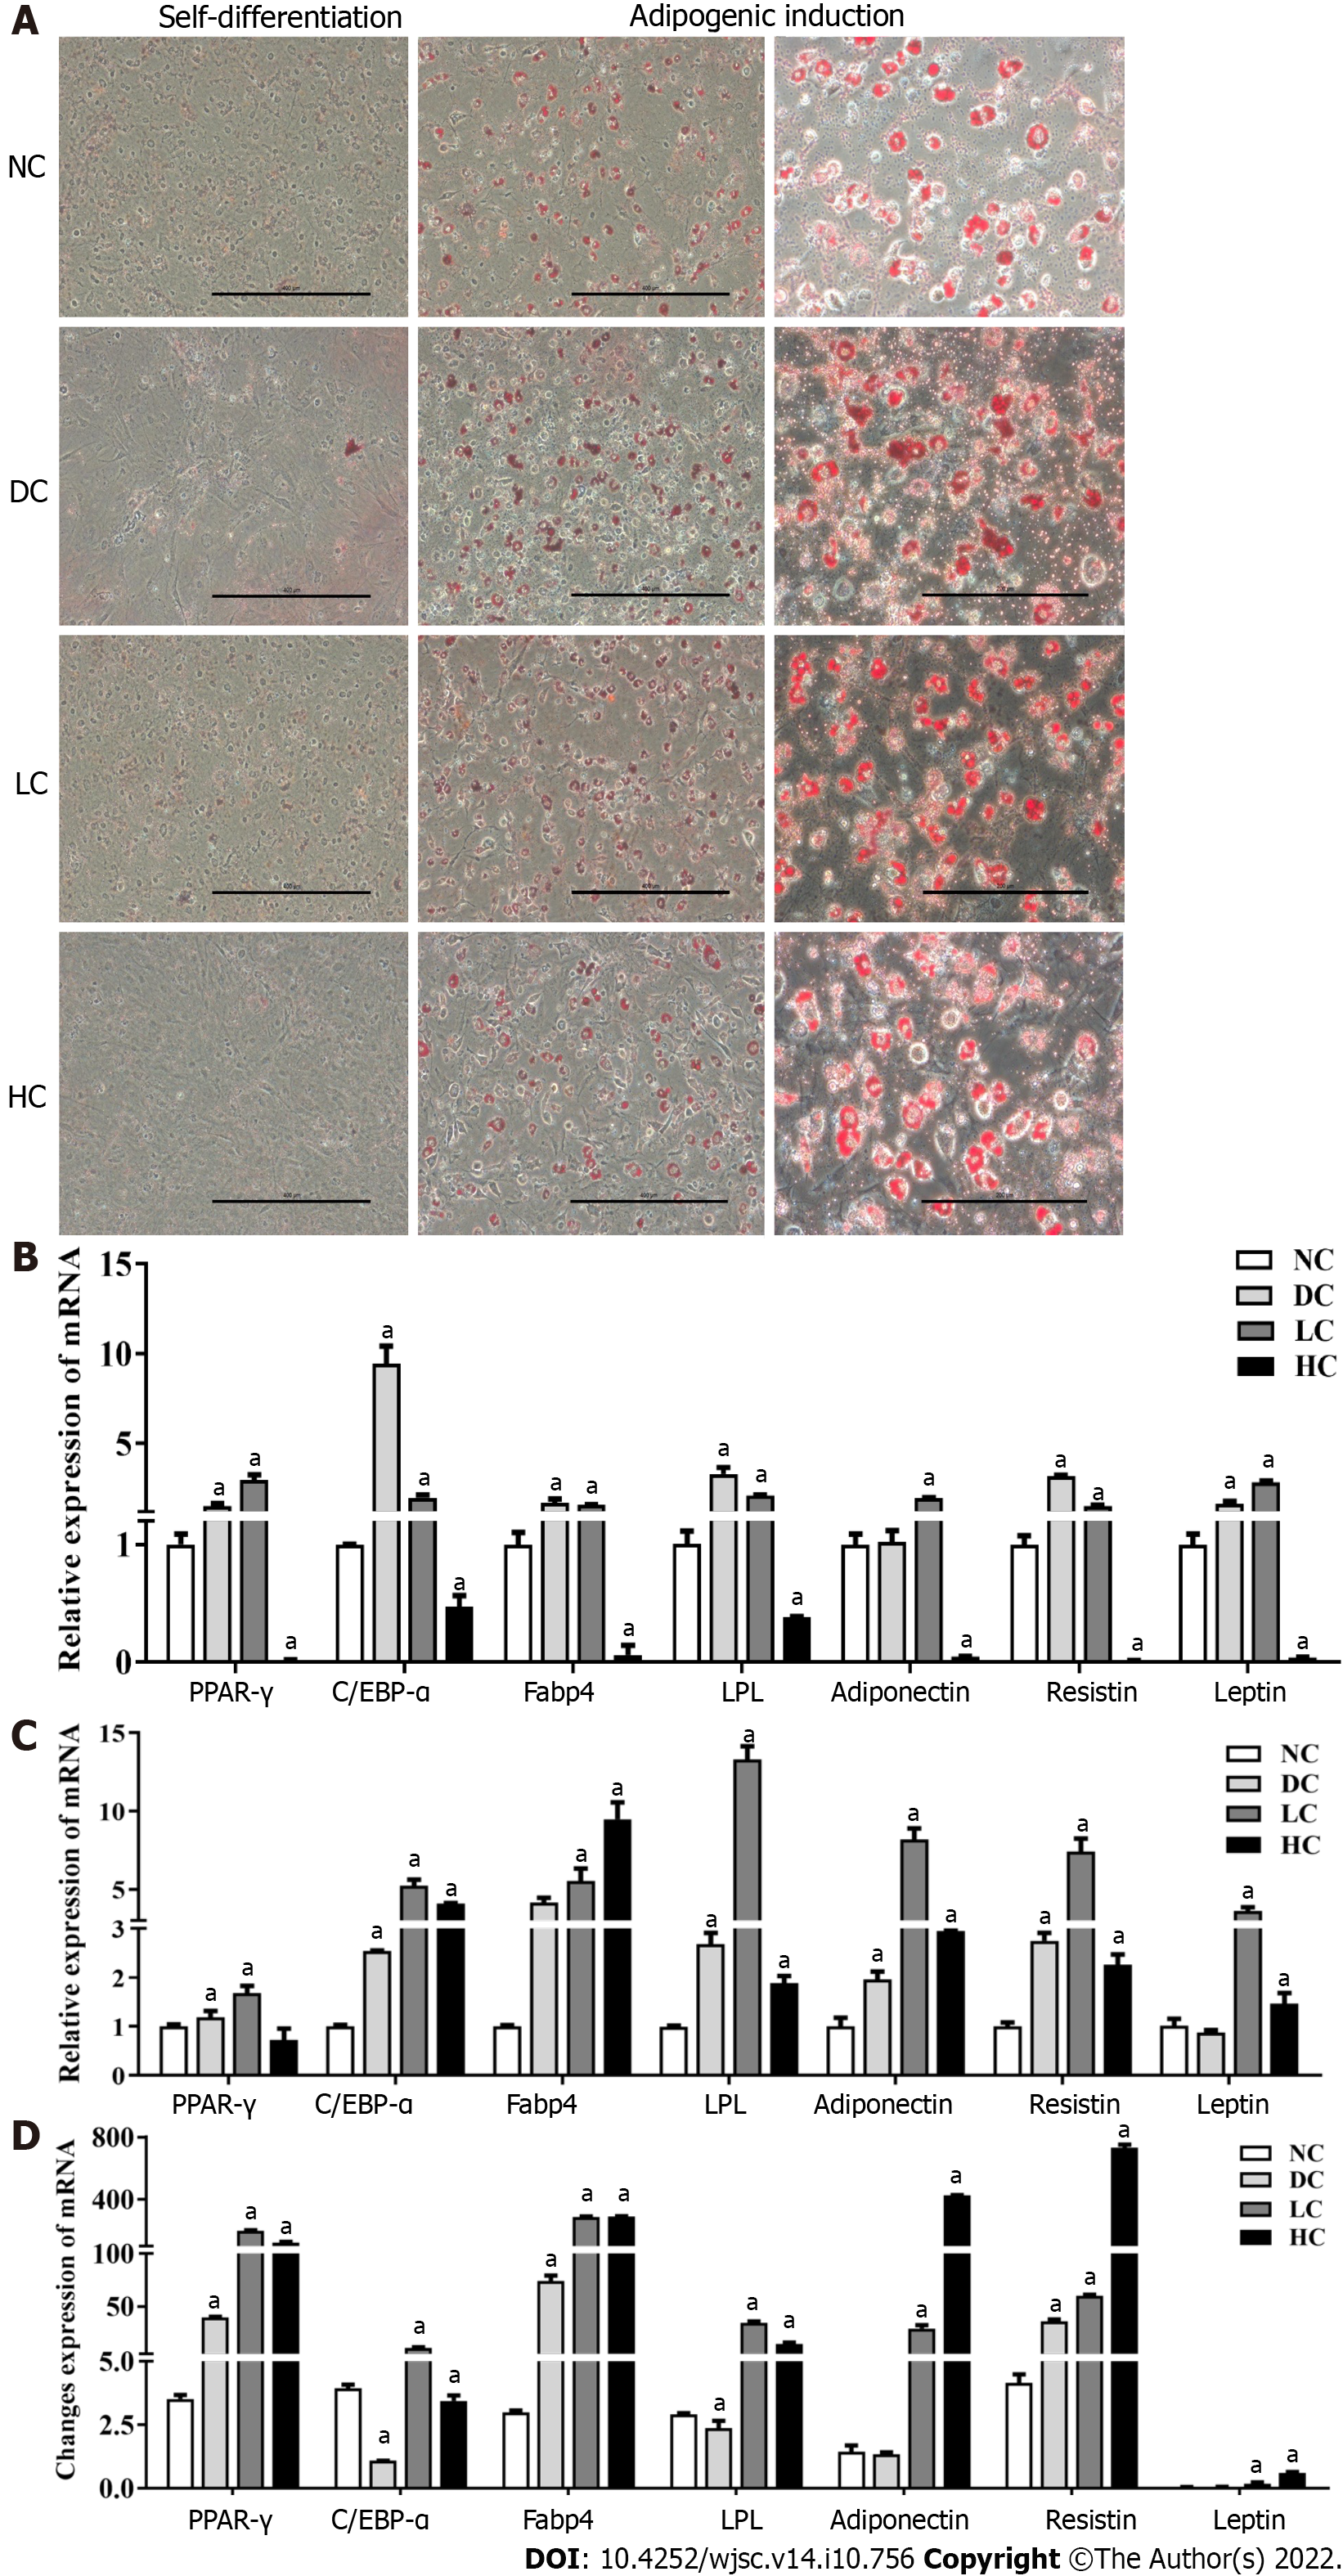
Figure 5 Effects of maternal dietary calcium intake during pregnancy and lactation on adipogenic differentiation potential of bone marrow mesenchymal stem cells among male offspring under agent induction.
A: Morphology of BMSCs under adipogenic differentiation; B and C: Expression of target genes related to adipogenic differentiation under adipogenic induction and self-differentiation status; D: Ratio of gene expressions between adipogenic differentiation and self-differentiation. All data presented as mean ± standard error (n = 9/group). One-way analysis of variance was performed to compare the differences among the above four groups, and then Student–Newman–Keuls test was used to determine the differences between each two groups. Compared to the NC group, aP < 0.05. NC: Normal-calcium reproductive diet; DC: Deficient-calcium reproductive diet; LC: Low-calcium reproductive diet; HC: High-calcium reproductive diet; BMSCs: Bone marrow mesenchymal stem cells.
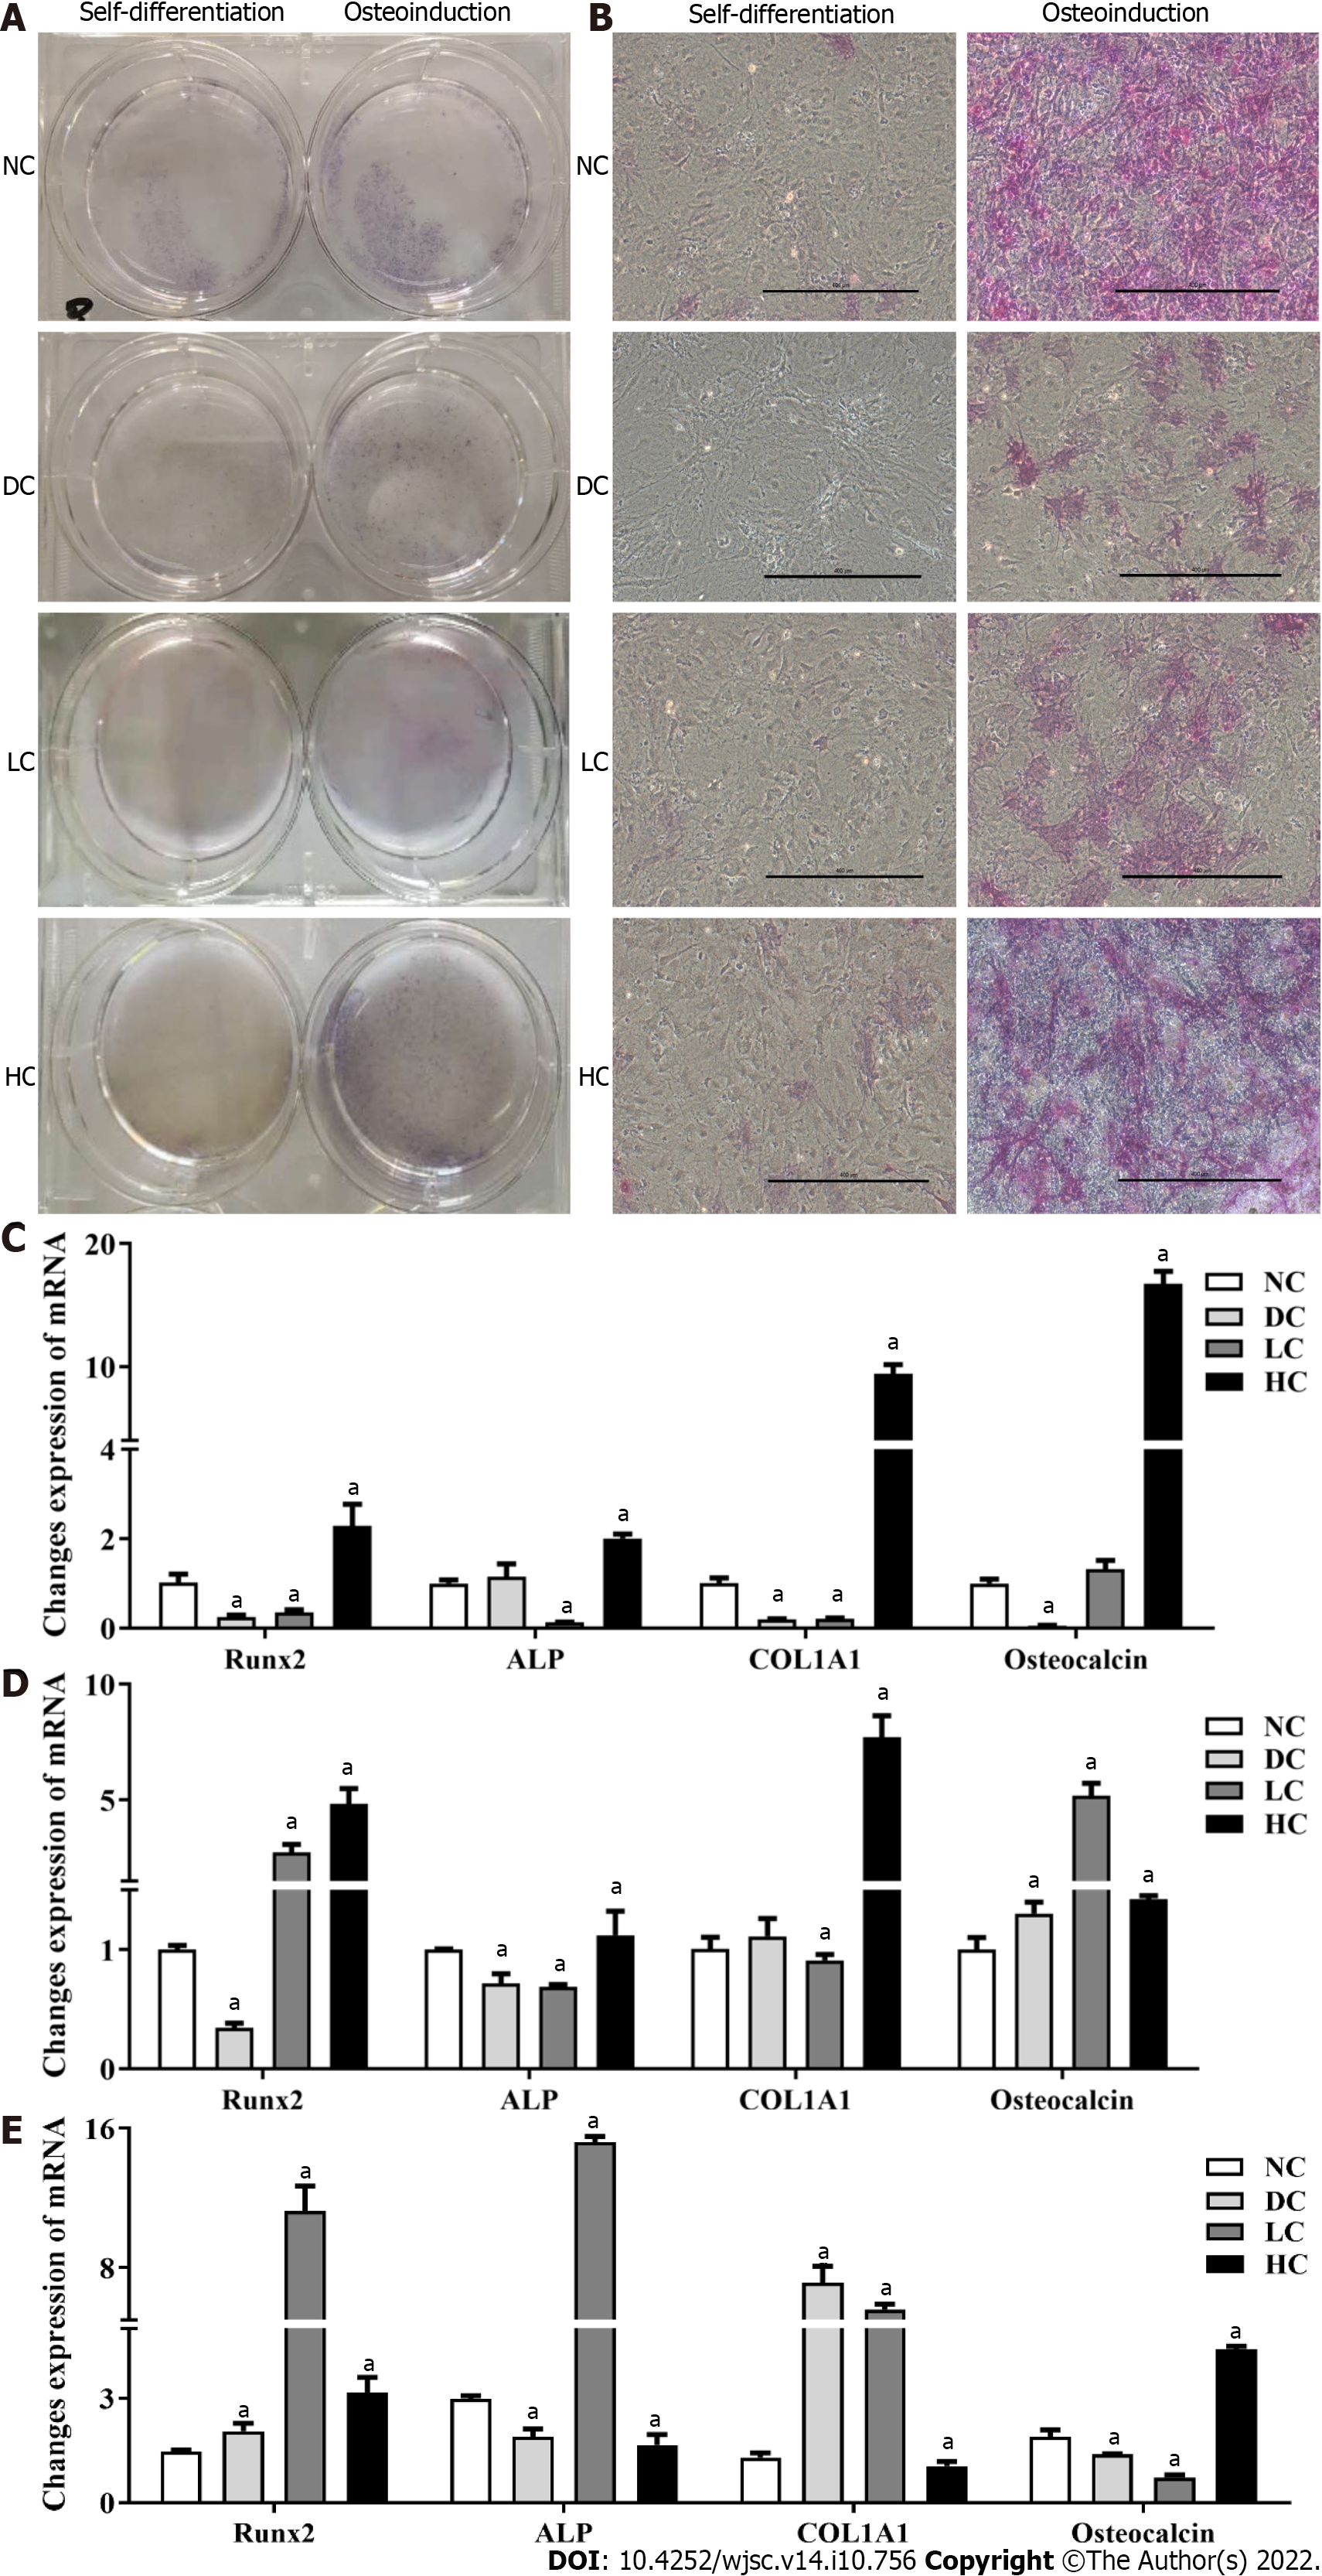
Figure 6 Effects of maternal dietary calcium intake during pregnancy and lactation on osteogenic differentiation potential of bone marrow mesenchymal stem cells among male offspring under agent induction.
A and B: Morphology of BMSCs under osteogenic differentiation; C and D: Expression of target genes on osteogenic differentiation under osteogenic induction and self-differentiation status; E: Ratio of gene expressions between osteogenic differentiation and self-differentiation. All data presented as mean ± standard error (n = 9/group). One-way analysis of variance was performed to compare the differences among the above four groups, and then Student–Newman–Keuls test was used to determine the differences between each two groups. Compared to the NC group, aP < 0.05. NC: Normal-calcium reproductive diet; DC: Deficient-calcium reproductive diet; LC: Low-calcium reproductive diet; HC: High-calcium reproductive diet; BMSCs: Bone marrow mesenchymal stem cells.
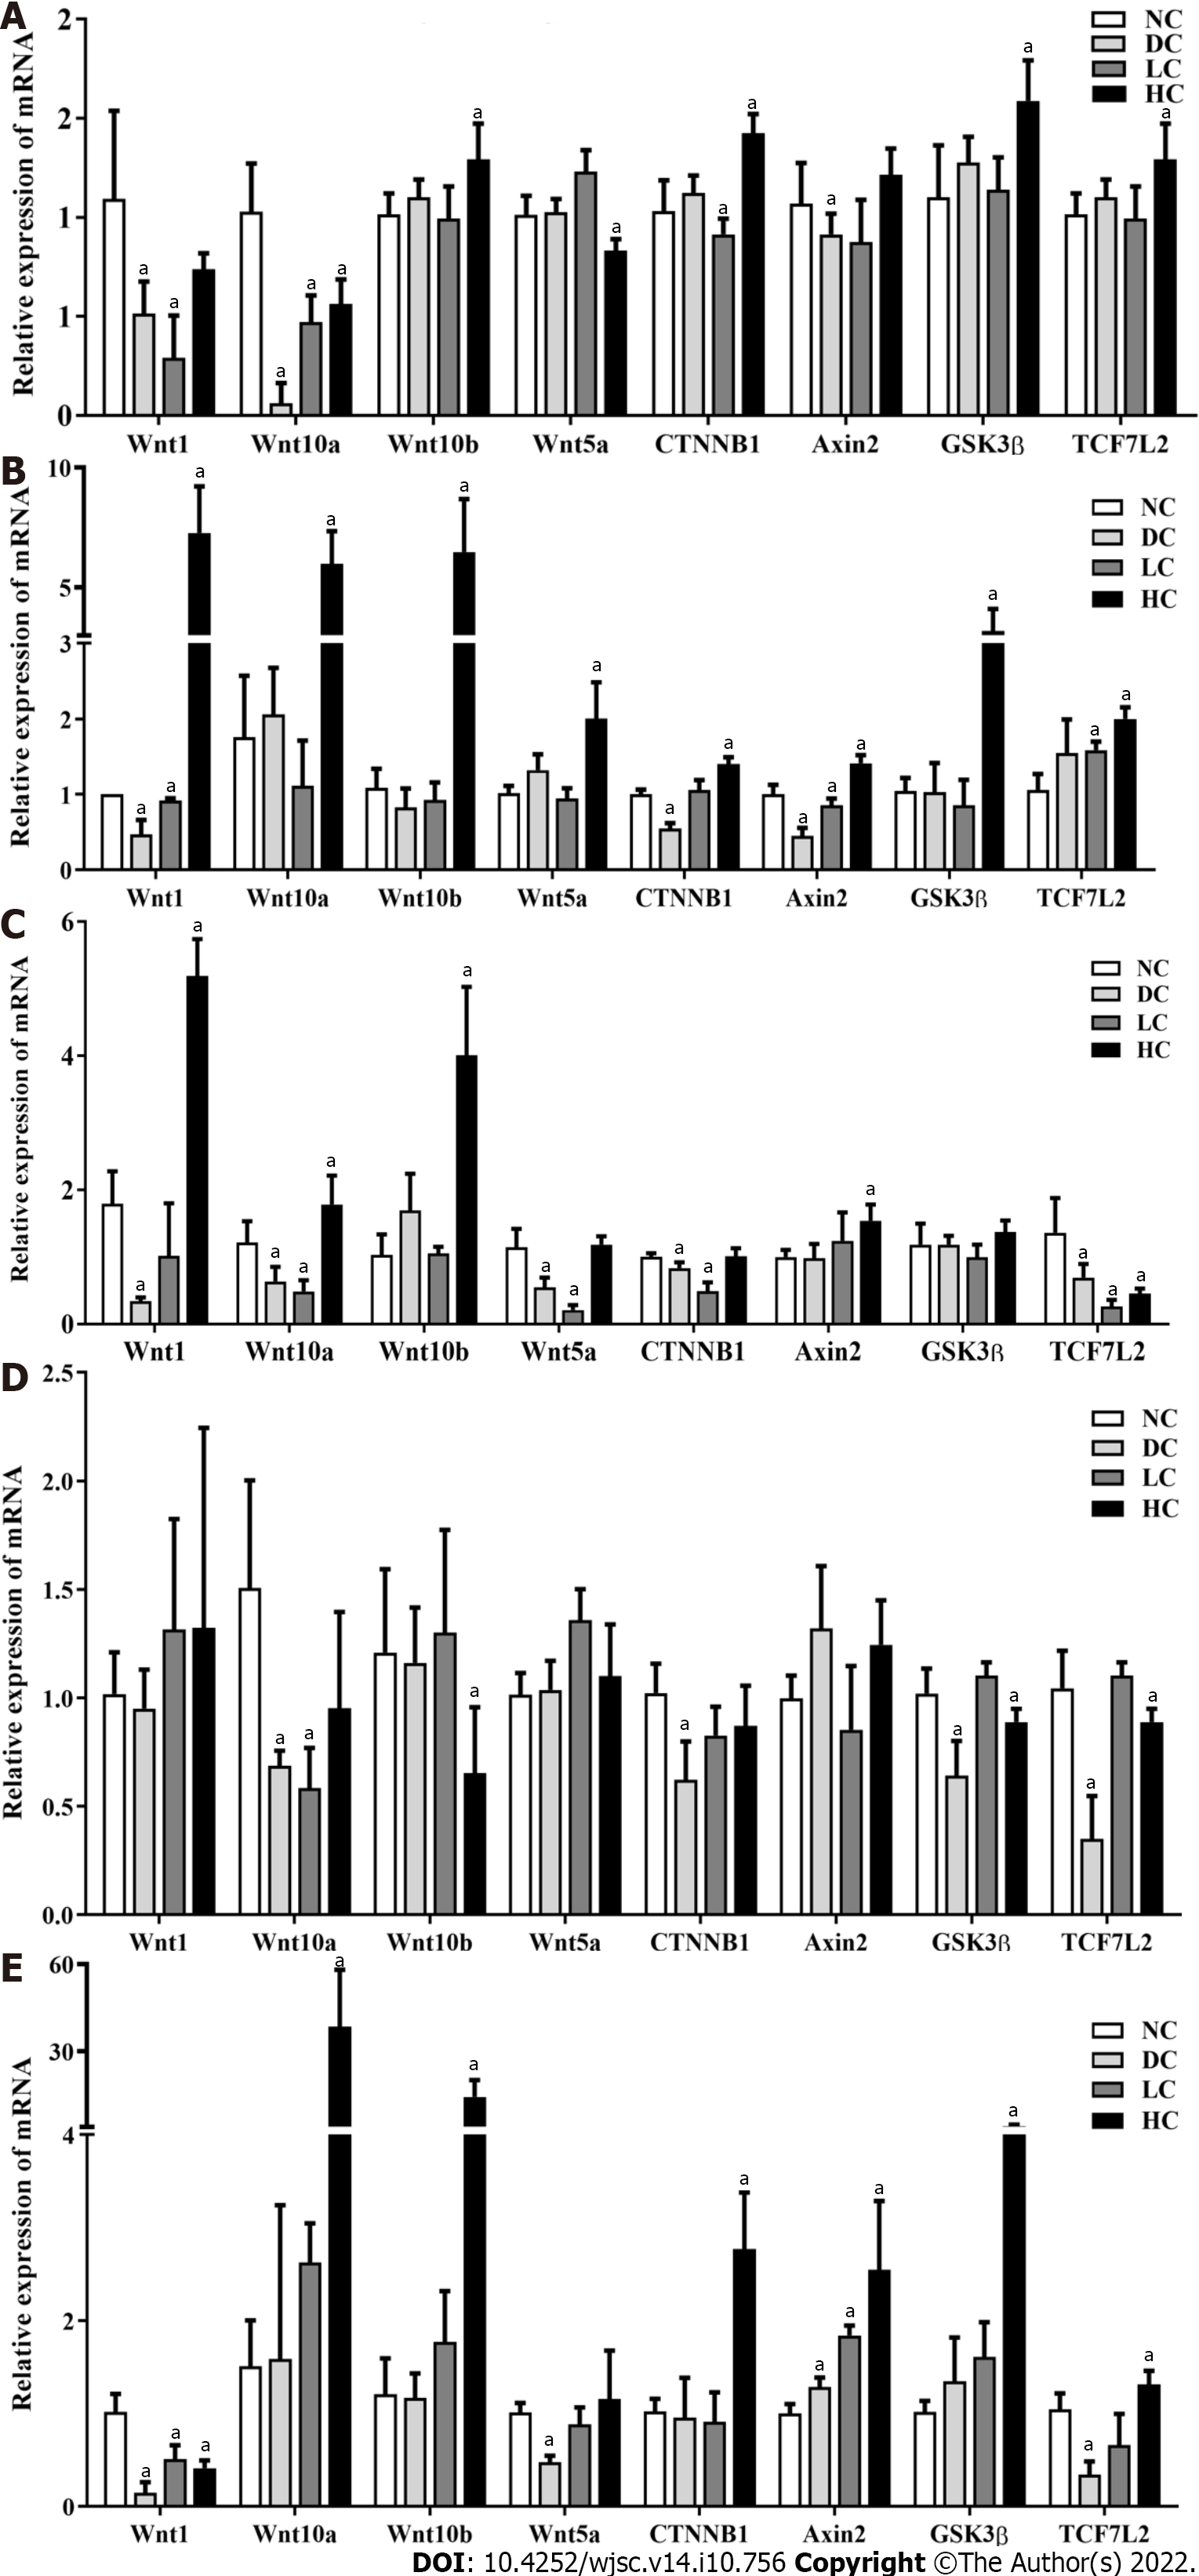
Figure 7 Effects of maternal different dietary calcium intake on gene expressions of bone marrow mesenchymal stem cells at the Wnt/β-catenin signaling pathway under different interventions among male offspring.
A: P3 BMSCs; B and D: Adipogenic induction and self-differentiation status of BMSCs; C and E: Osteogenic induction and self-differentiation status of BMSCs. All data presented as mean ± standard error (n = 9/group). One-way analysis of variance was performed to compare the differences among the above four groups, and then Student–Newman–Keuls test was used to determine the differences between each two groups. Compared to the NC group, aP < 0.05. NC: Normal-calcium reproductive diet; DC: Deficient-calcium reproductive diet; LC: Low-calcium reproductive diet; HC: High-calcium reproductive diet; BMSCs: Bone marrow mesenchymal stem cells.
- Citation: Li P, Wang Y, Li P, Liu YL, Liu WJ, Chen XY, Tang TT, Qi KM, Zhang Y. Maternal inappropriate calcium intake aggravates dietary-induced obesity in male offspring by affecting the differentiation potential of mesenchymal stem cells. World J Stem Cells 2022; 14(10): 756-776
- URL: https://www.wjgnet.com/1948-0210/full/v14/i10/756.htm
- DOI: https://dx.doi.org/10.4252/wjsc.v14.i10.756


