Copyright
©The Author(s) 2021.
World J Stem Cells. Jul 26, 2021; 13(7): 944-970
Published online Jul 26, 2021. doi: 10.4252/wjsc.v13.i7.944
Published online Jul 26, 2021. doi: 10.4252/wjsc.v13.i7.944
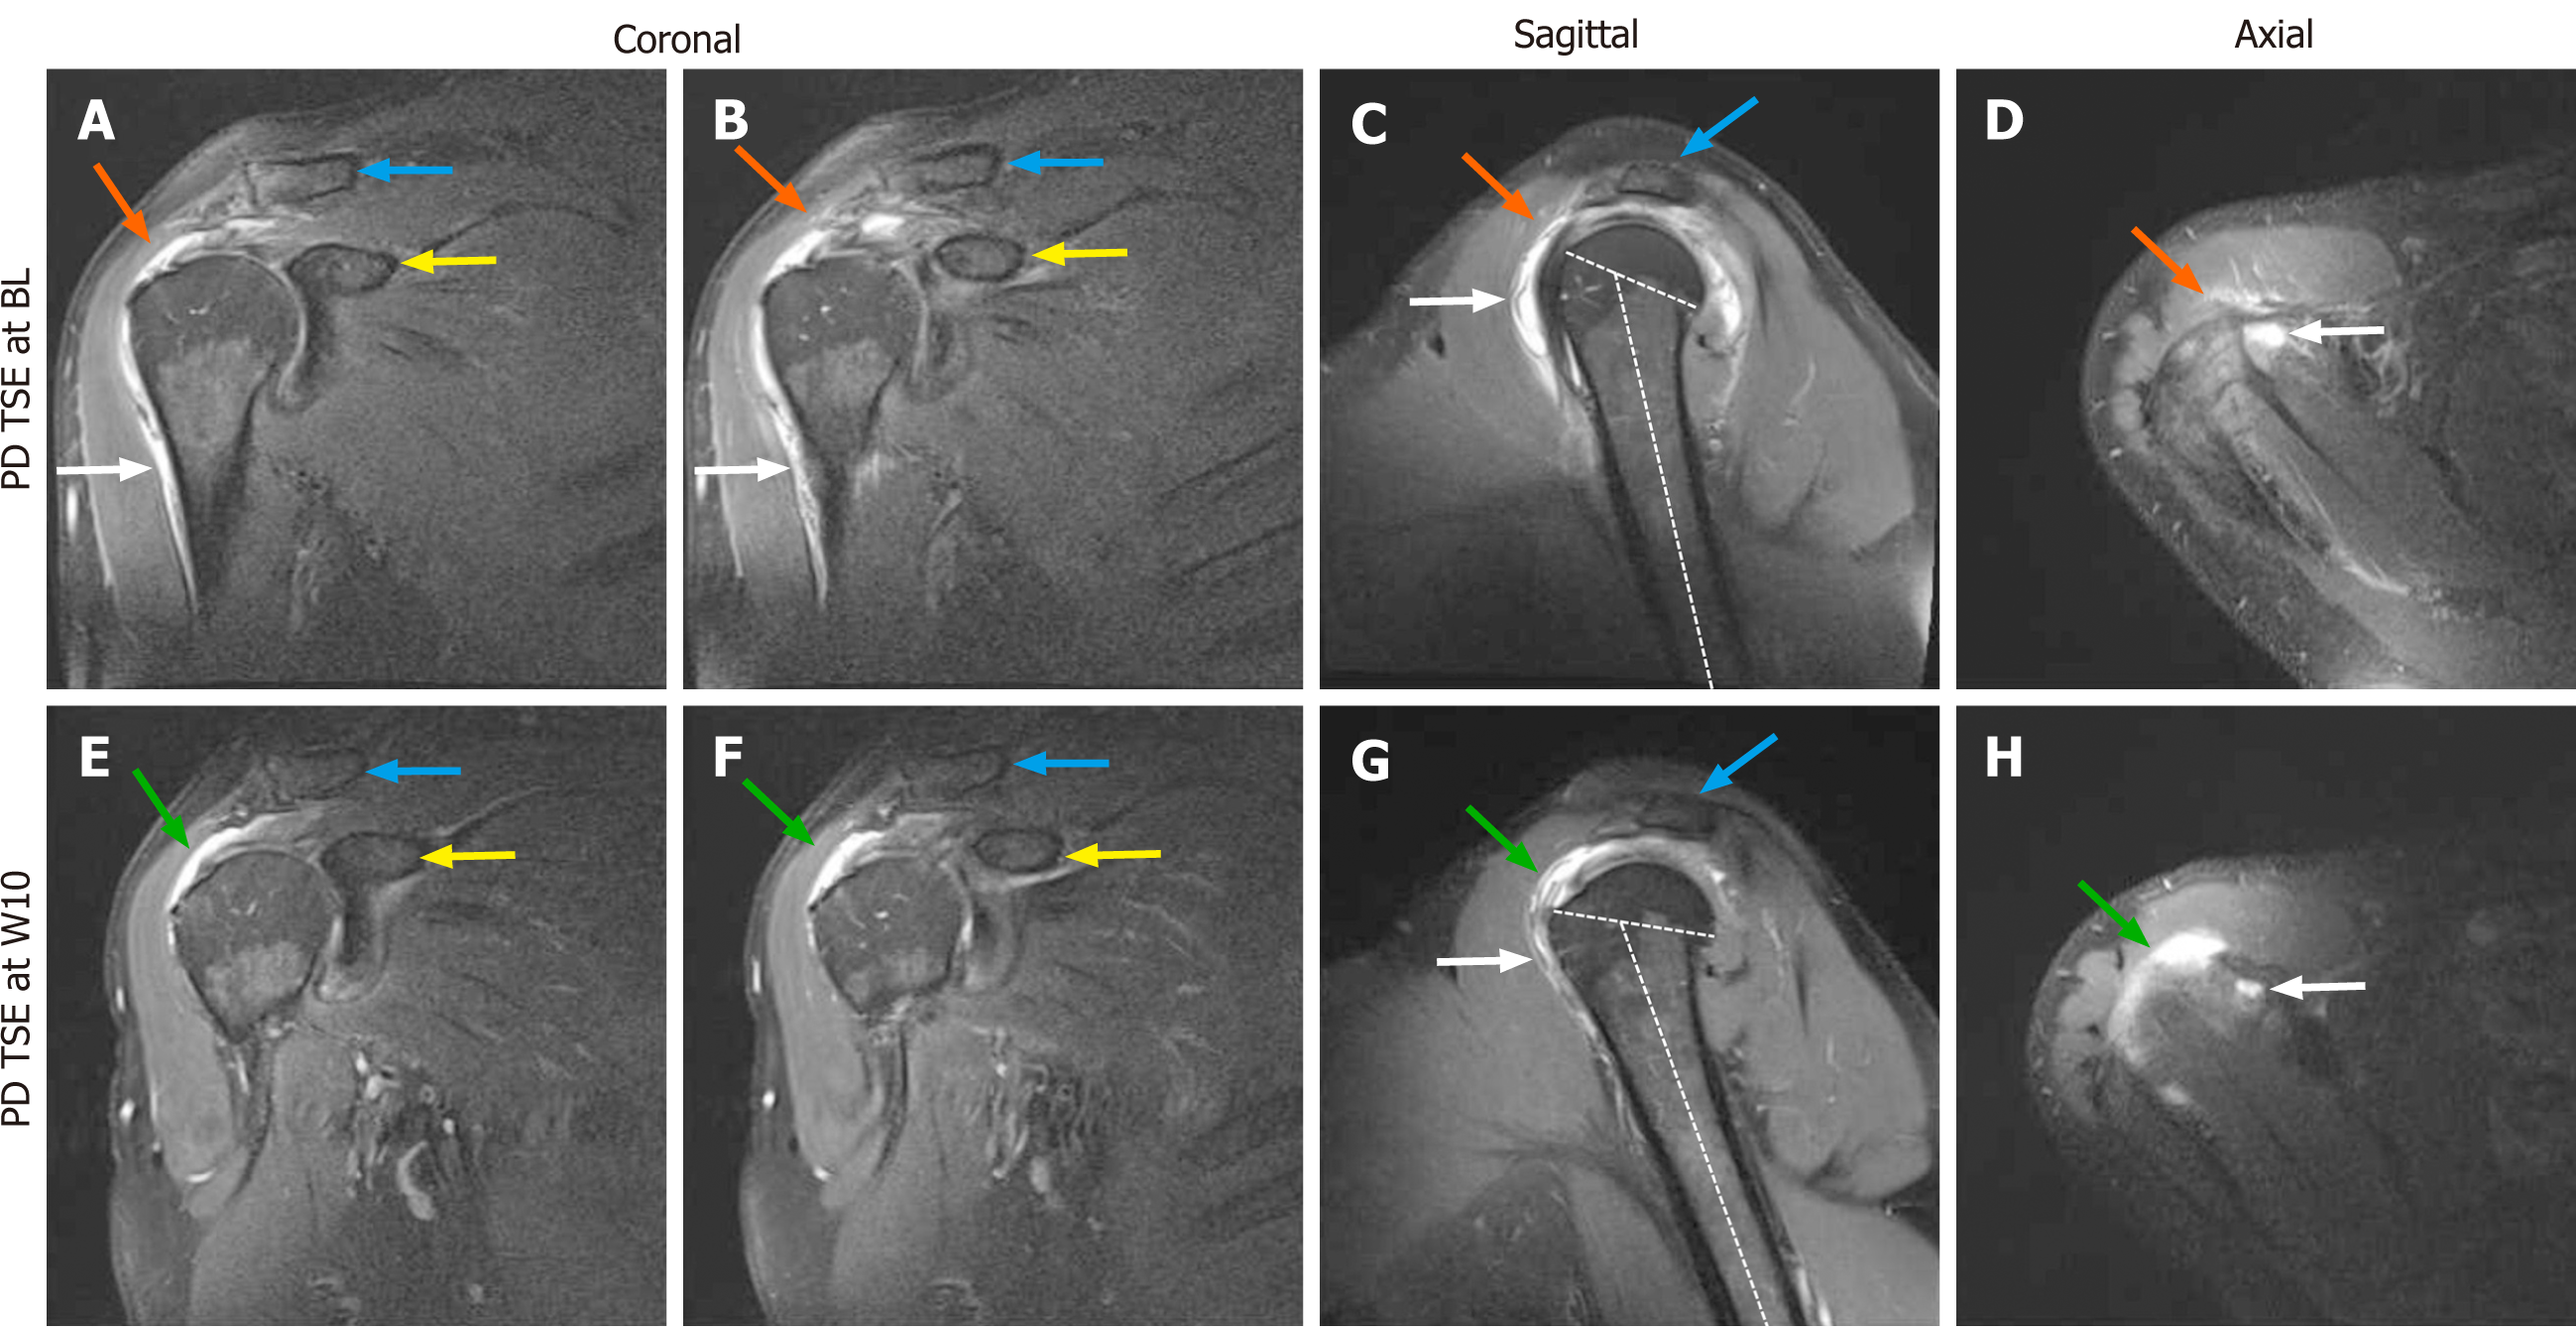
Figure 1 Proton density weighted, fat saturated, Turbo Spin Echo, 1.
5 T magnetic resonance imaging scans of the right shoulder of the investigated patient (matrix 320 × 320; slice thickness 3 mm; inter-slice gap 0.3 mm; echo time 37 ms; repetition time 2450 ms at baseline and 3480 ms at 10 wk post injection). A and B: Coronal scans at baseline (BL) (white arrows, trauma-related bruising; orange arrows, position of the supraspinatus tendon at which a hyperintense structure was found at 10 wk post injection (W10) but not at BL; blue arrows, clavicle; yellow arrows, coracoid process of the scapula); C: Sagittal scan at BL (white arrow, trauma-related bruising; orange arrow, position of the supraspinatus tendon at which a hyperintense structure was found at W10 but not at BL; blue arrow, acromion; dotted lines, long axis of the humeral shaft and delineation of the humeral head, with same angle between the lines as in Panel G); D: Axial scan at BL (white arrow, trauma-related bruising; orange arrow, position of the supraspinatus tendon at which a hyperintense structure was found at W10 but not at BL); E and F: Coronal scans at W10 (green arrows, hyperintense structure at the position of the supraspinatus tendon that was found at W10 but not at BL; blue arrows, clavicle; yellow arrows, coracoid process of the scapula); G: Sagittal scan at W10 (white arrow, trauma-related bruising; green arrow, hyperintense structure at the position of the supraspinatus tendon that was found at W10 but not at BL; blue arrow, acromion; dotted lines, long axis of the humerus and delineation of the humeral head, with same angle between the lines as in Panel C); H: Axial scan at W10 (white arrow, trauma-related bruising; green arrow, hyperintense structure at the position of the supraspinatus tendon that was found at W10 but not at BL). BL: Baseline; PD TSE: Proton density weighted turbo spin echo; W10: 10 wk post injection.
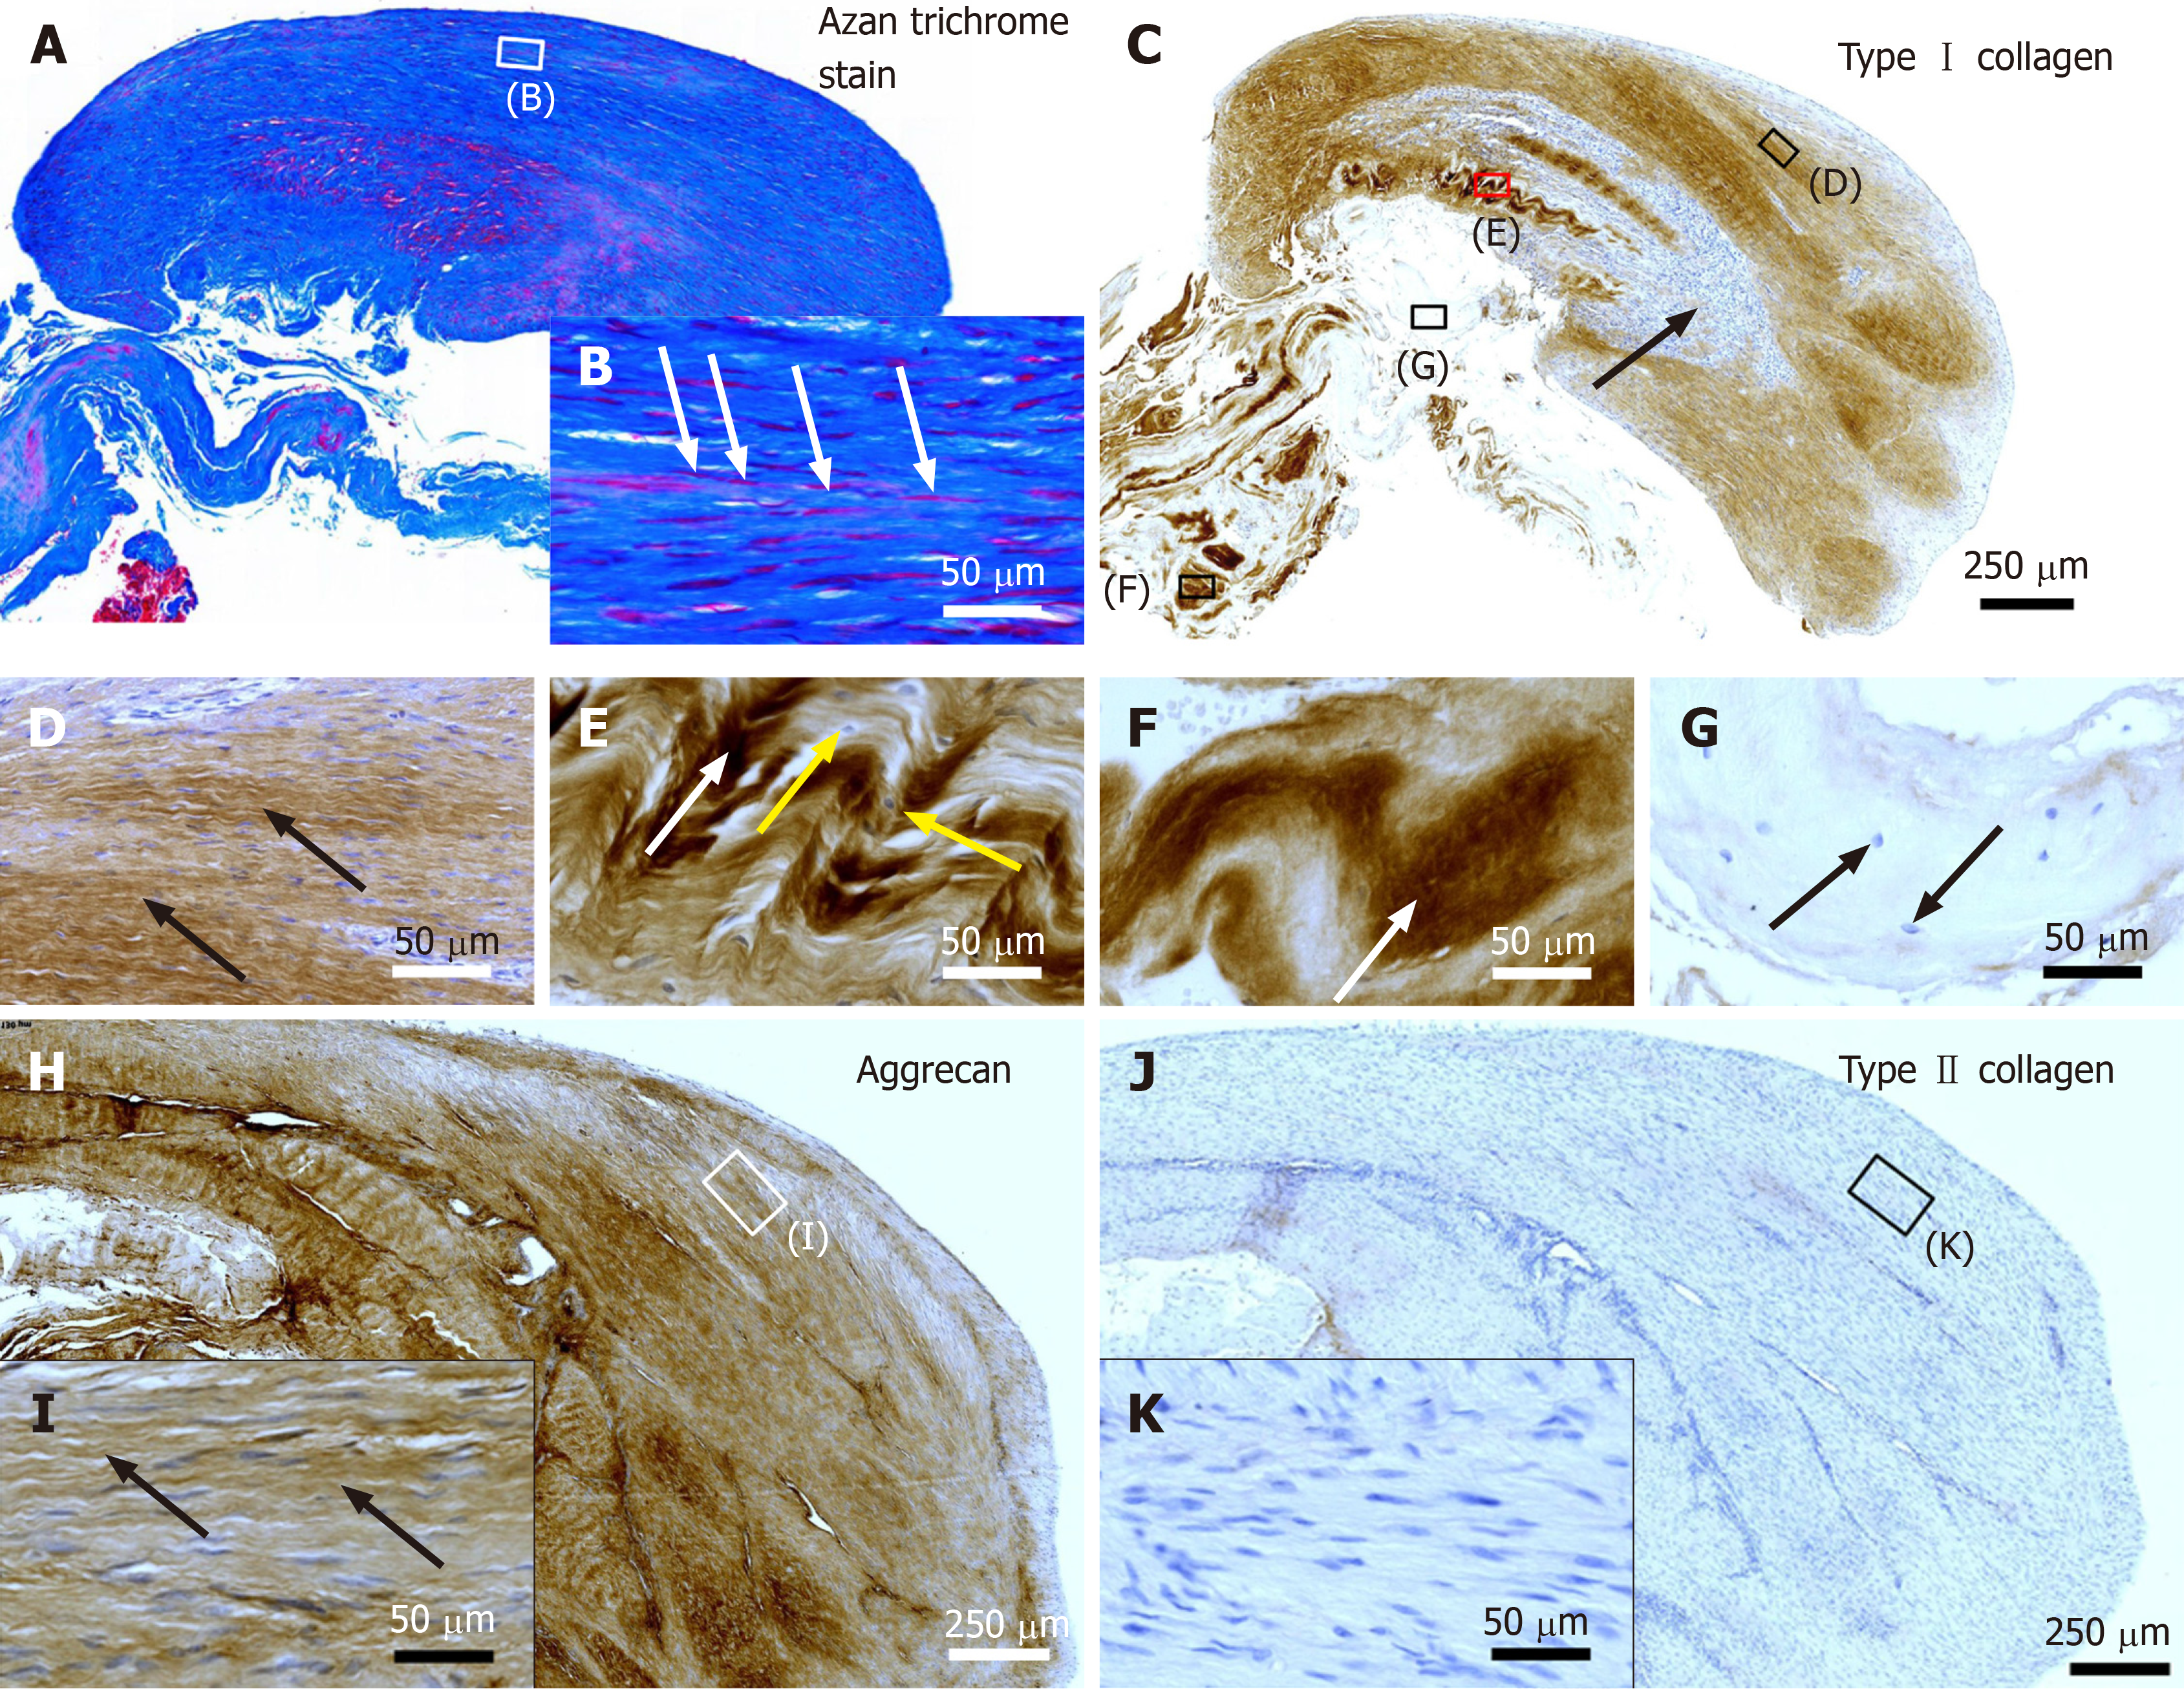
Figure 2 Histological and immunohistochemical analysis of representative sections from the first part of the biopsy that was investigated in this study.
A and B: Section stained with Azan trichrome stain; cells are in red and collagen is in blue (inset in Panel A, position of the high-power photomicrograph displayed in Panel B; white arrows in Panel B, elongated, fibroblast-like cells (tenocytes) arranged in long and parallel chains between collagen fibers); C-G: Immunohistochemical detection of type I collagen in a section adjacent to the one shown in Panel A; counterstaining was performed with Mayer's hematoxylin (black arrow in Panel C, region with almost complete absence of immunolabeling for type I collagen but a high cell density; insets in Panel C, position of the high-power photomicrographs displayed in Panels D-G, showing the following four different regions: D: Immunolabeling for organized, slightly undulating type I collagen (black arrows in Panel D) and high cell density; E: Immunolabeling for organized type I collagen with discernible crimp arrangement (white arrow in Panel E) and a few cells (yellow arrows in Panel E); F: Immunolabeling for organized type I collagen with discernible crimp arrangement (white arrow in Panel F) and absence of cells; G: Absence of immunolabeling for type I collagen and a few, rounded cells (black arrows in Panel G); H and I: Immunohistochemical detection of aggrecan in a section adjacent to the ones shown in Panels A and C of the same biopsy; counterstaining was performed with Mayer's hematoxylin (inset in Panel H, position of the high-power photomicrograph displayed in Panel I; black arrows in Panel I, immunolabeling for aggrecan); J and K: Immunohistochemical detection of type II collagen in another section adjacent to the ones shown in Panels A, C and H of the same biopsy; counterstaining was also performed with Mayer's hematoxylin (inset in Panel J, position of the high-power photomicrograph displayed in Panel K).
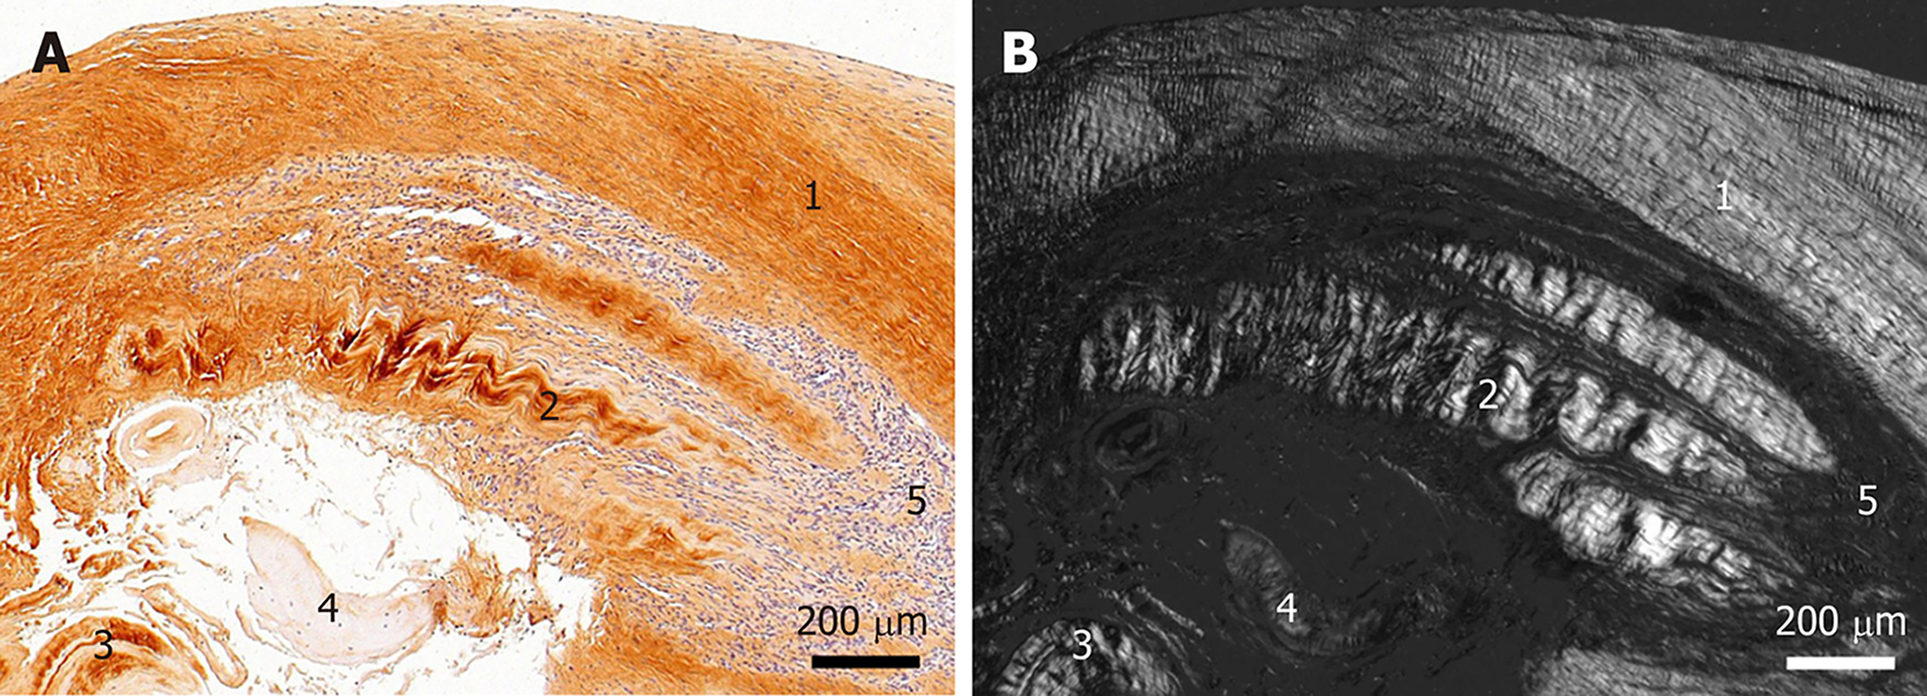
Figure 3 Histological and immunohistochemical analysis of a representative section from the first part of the biopsy that was investigated in this study.
A: Immunohistochemical detection of type I collagen, showing the following 5 different regions (high-power photomicrographs are provided in Figure 2): 1Organized, slightly undulating type I collagen and high cell density; 2Organized type I collagen with discernible crimp arrangement and a few cells; 3Organized type I collagen with discernible crimp arrangement and almost complete absence of cells; 4Almost complete absence of immunolabeling for type I collagen and a few, rounded cells; and 5Almost complete absence of immunolabeling for type I collagen but a high cell density; B: Corresponding polarized light microscopic image of the same field of view. Note the clear difference in collagen fiber birefringence between regions 1 and 2, and the absence of collagen fiber birefringence in regions 4 and 5.
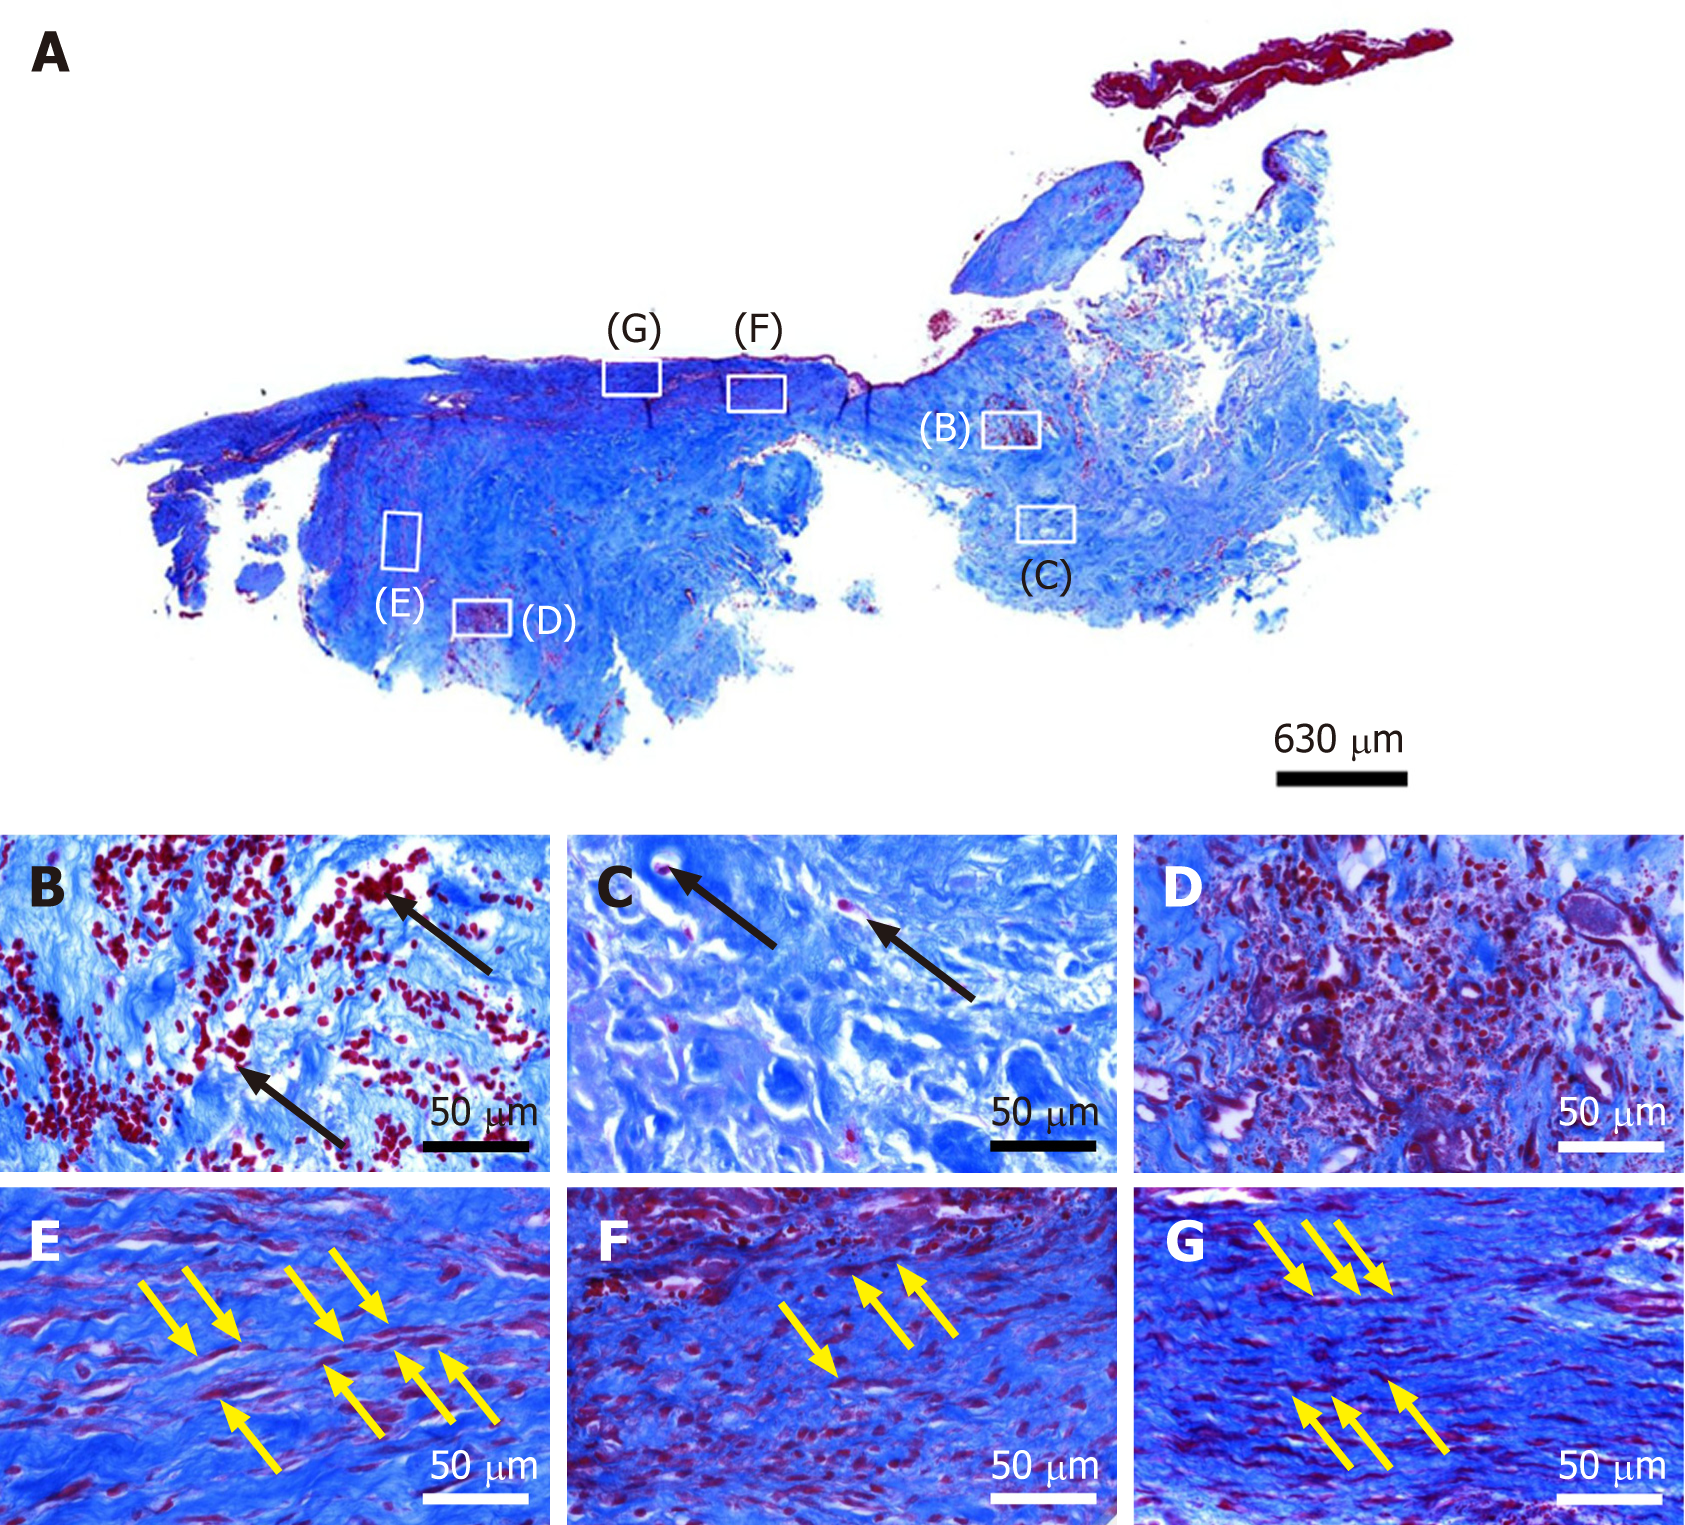
Figure 4 Histological analysis of a representative section of the second part of the biopsy that was investigated in this study (section stained with Azan trichrome stain; cells are in red and collagen is in blue).
A: Low-power overview (insets, position of the high-power photo
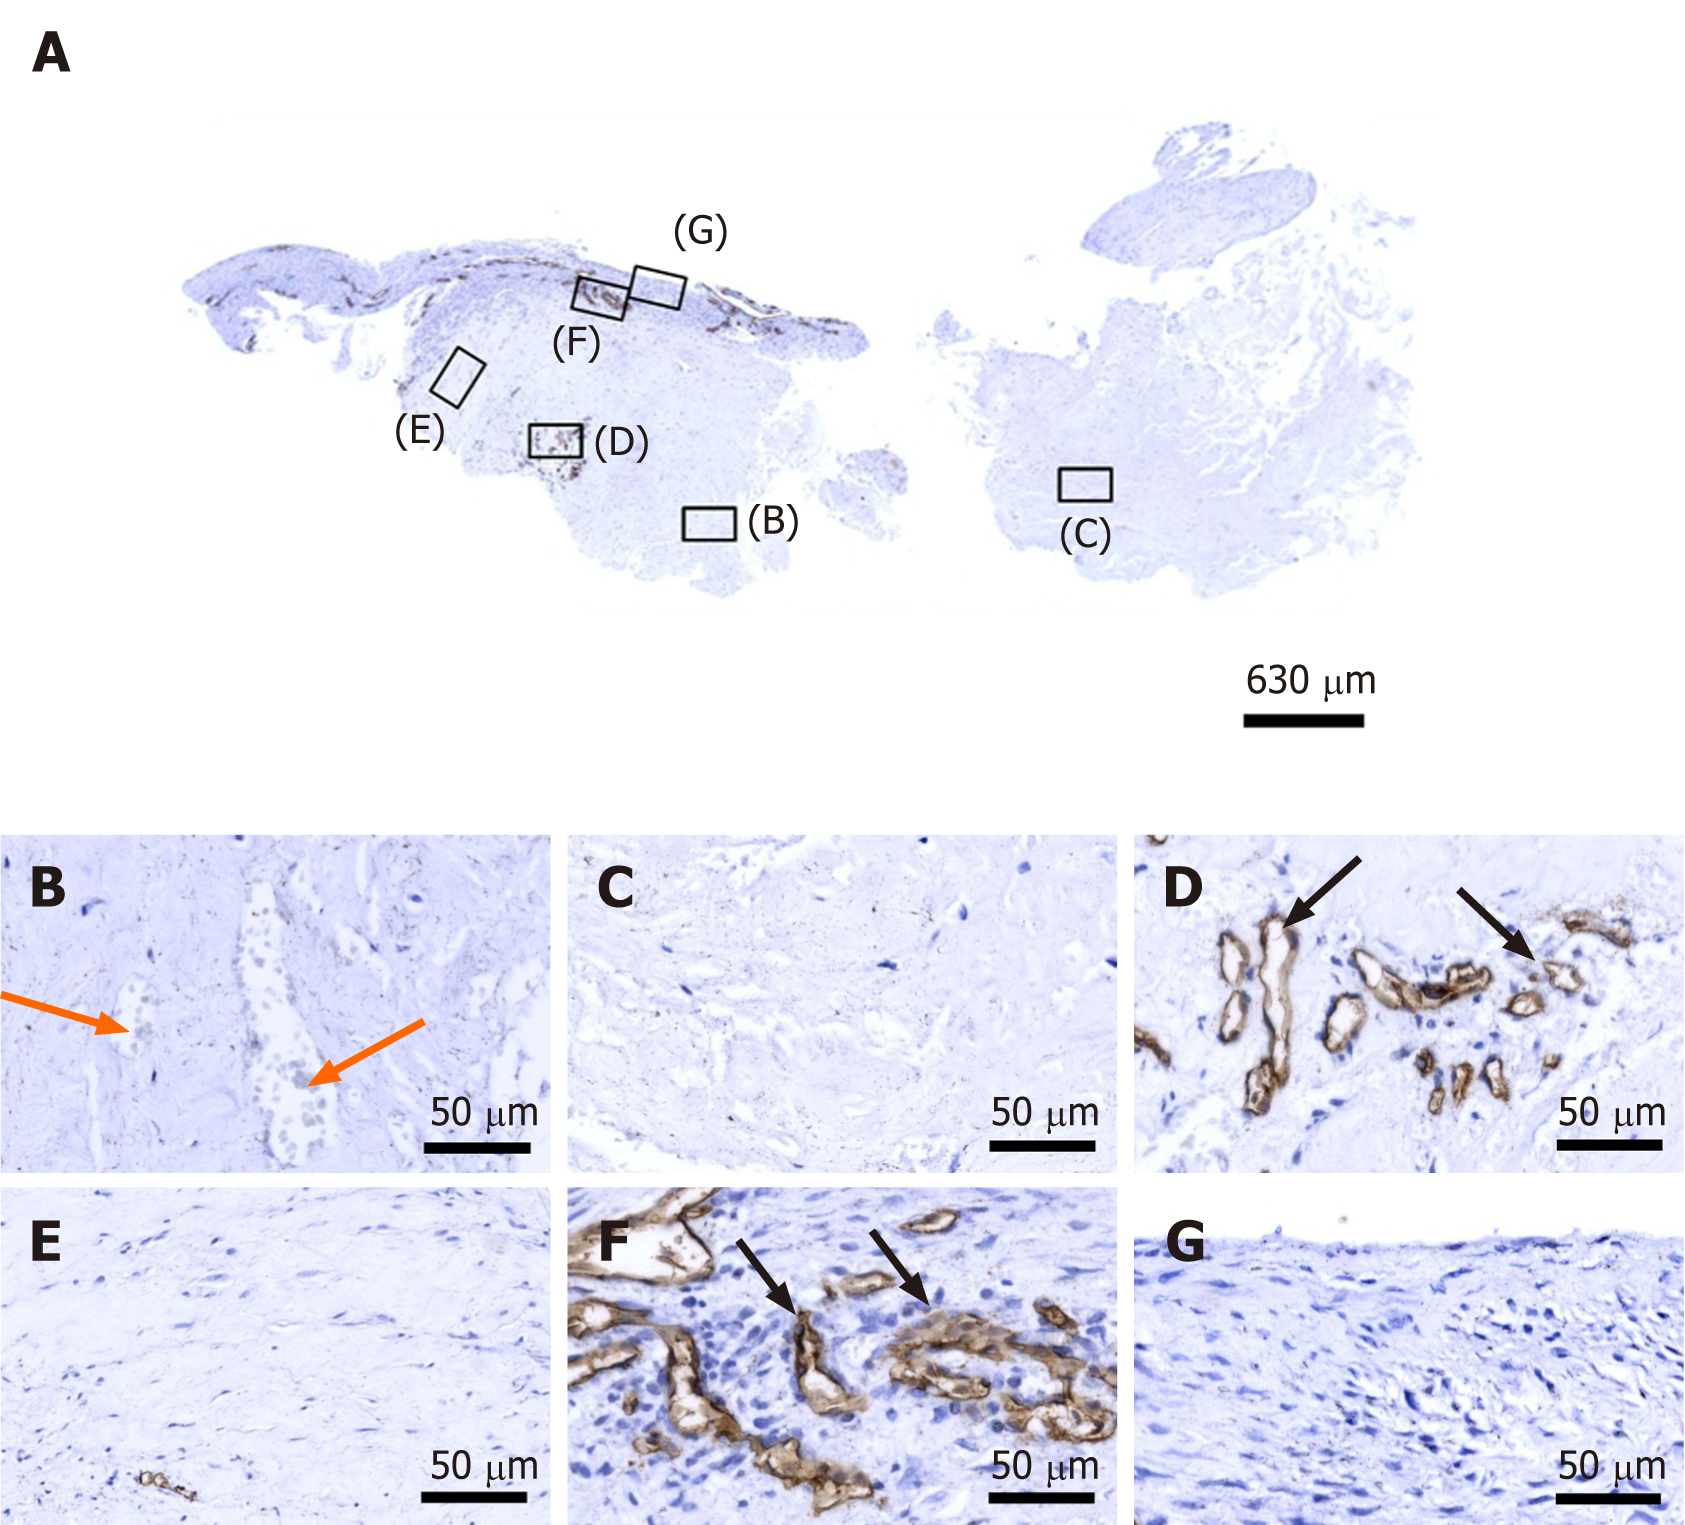
Figure 5 Immunohistochemical detection of cluster of differentiation 34 in a section of the second part of the biopsy that was investigated in this study (section adjacent to the one shown in Figure 4; counterstaining was performed with Mayer's hematoxylin).
A: Low-power overview (insets, position of the high-power photomicrographs displayed in Panels B-G); B: Position of degenerative tendon tissue with formation of microvessels (orange arrows, cells inside a microvessel); C: Position of degenerative tendon tissue without formation of microvessels; D: Position of a spot with very high density of cells and microvessels (black arrows, immunolabeling for cluster of differentiation (CD) 34 in endothelial cells of microvessels); E: Position of tendon tissue in the depth of the biopsy; F: Position of tendon tissue below an outer surface of the biopsy (black arrows, immunolabeling for CD34 in endothelial cells of microvessels); G: Position of tendon tissue at an outer surface of the biopsy.
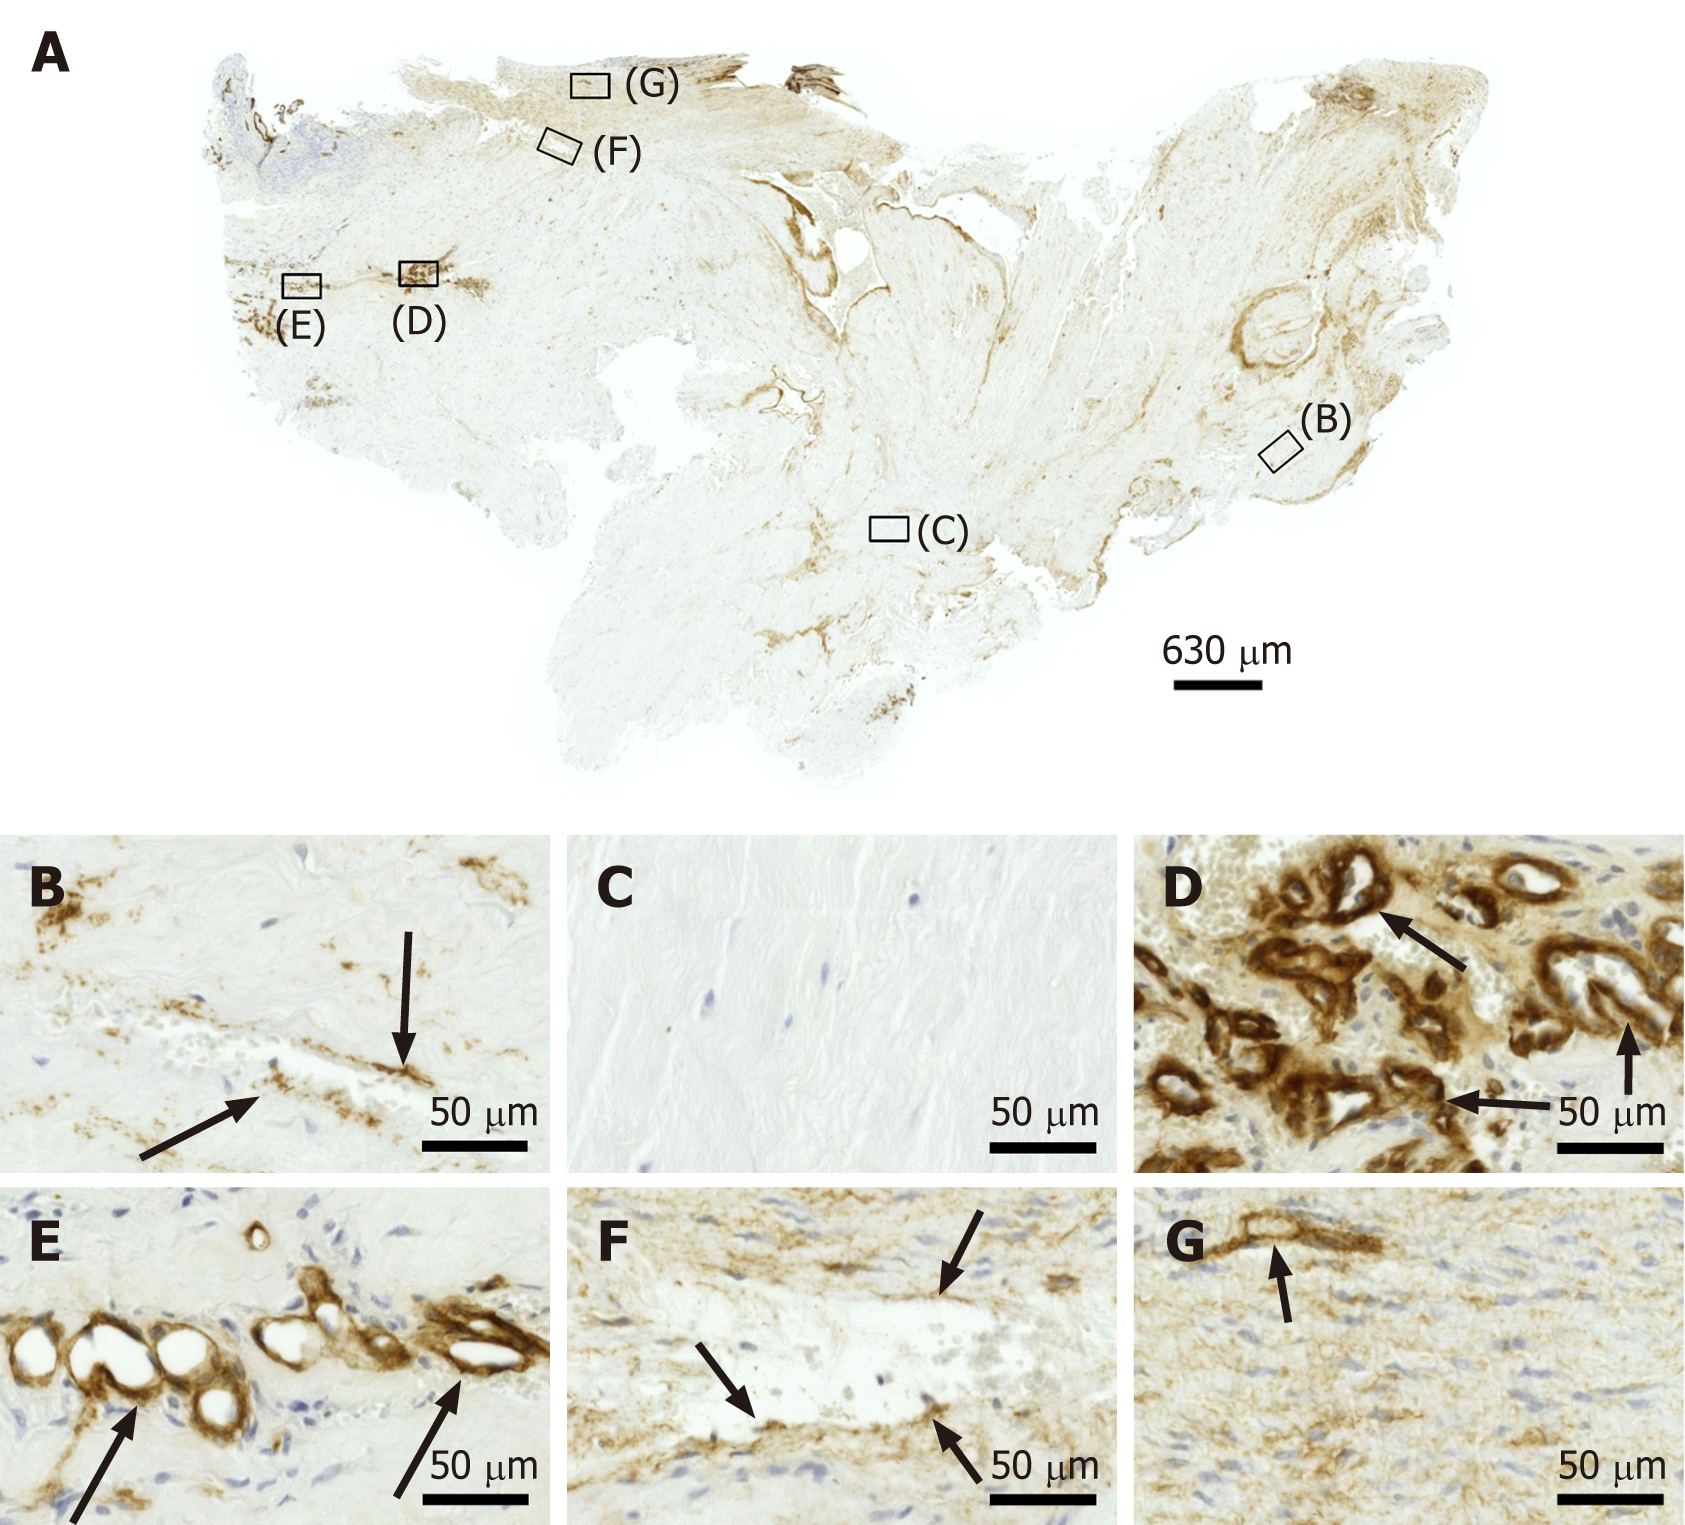
Figure 6 Immunohistochemical detection of type IV collagen in a section of the second part of the biopsy that was investigated in this study (section adjacent to the one shown in Figure 4; counterstaining was performed with Mayer's hematoxylin).
A: Low-power overview (insets, position of the high-power photomicrographs displayed in Panels B-G); B: Position of degenerative tendon tissue with formation of microvessels (black arrows, immunolabeling for type IV collagen in the basement membrane of microvessels); C: position of degenerative tendon tissue without formation of microvessels; D: Position of a spot with very high density of cells and microvessels (black arrows, immunolabeling for type IV collagen in the basement membrane of microvessels); E: Position of tendon tissue in the depth of the biopsy (black arrows, immunolabeling for type IV collagen in the basement membrane of microvessels); F: Position of tendon tissue below an outer surface of the biopsy (black arrows, immunolabeling for type IV collagen in the basement membrane of microvessels); G: Position of tendon tissue at an outer surface of the biopsy (black arrow, immunolabeling for type IV collagen in the basement membrane of microvessels).
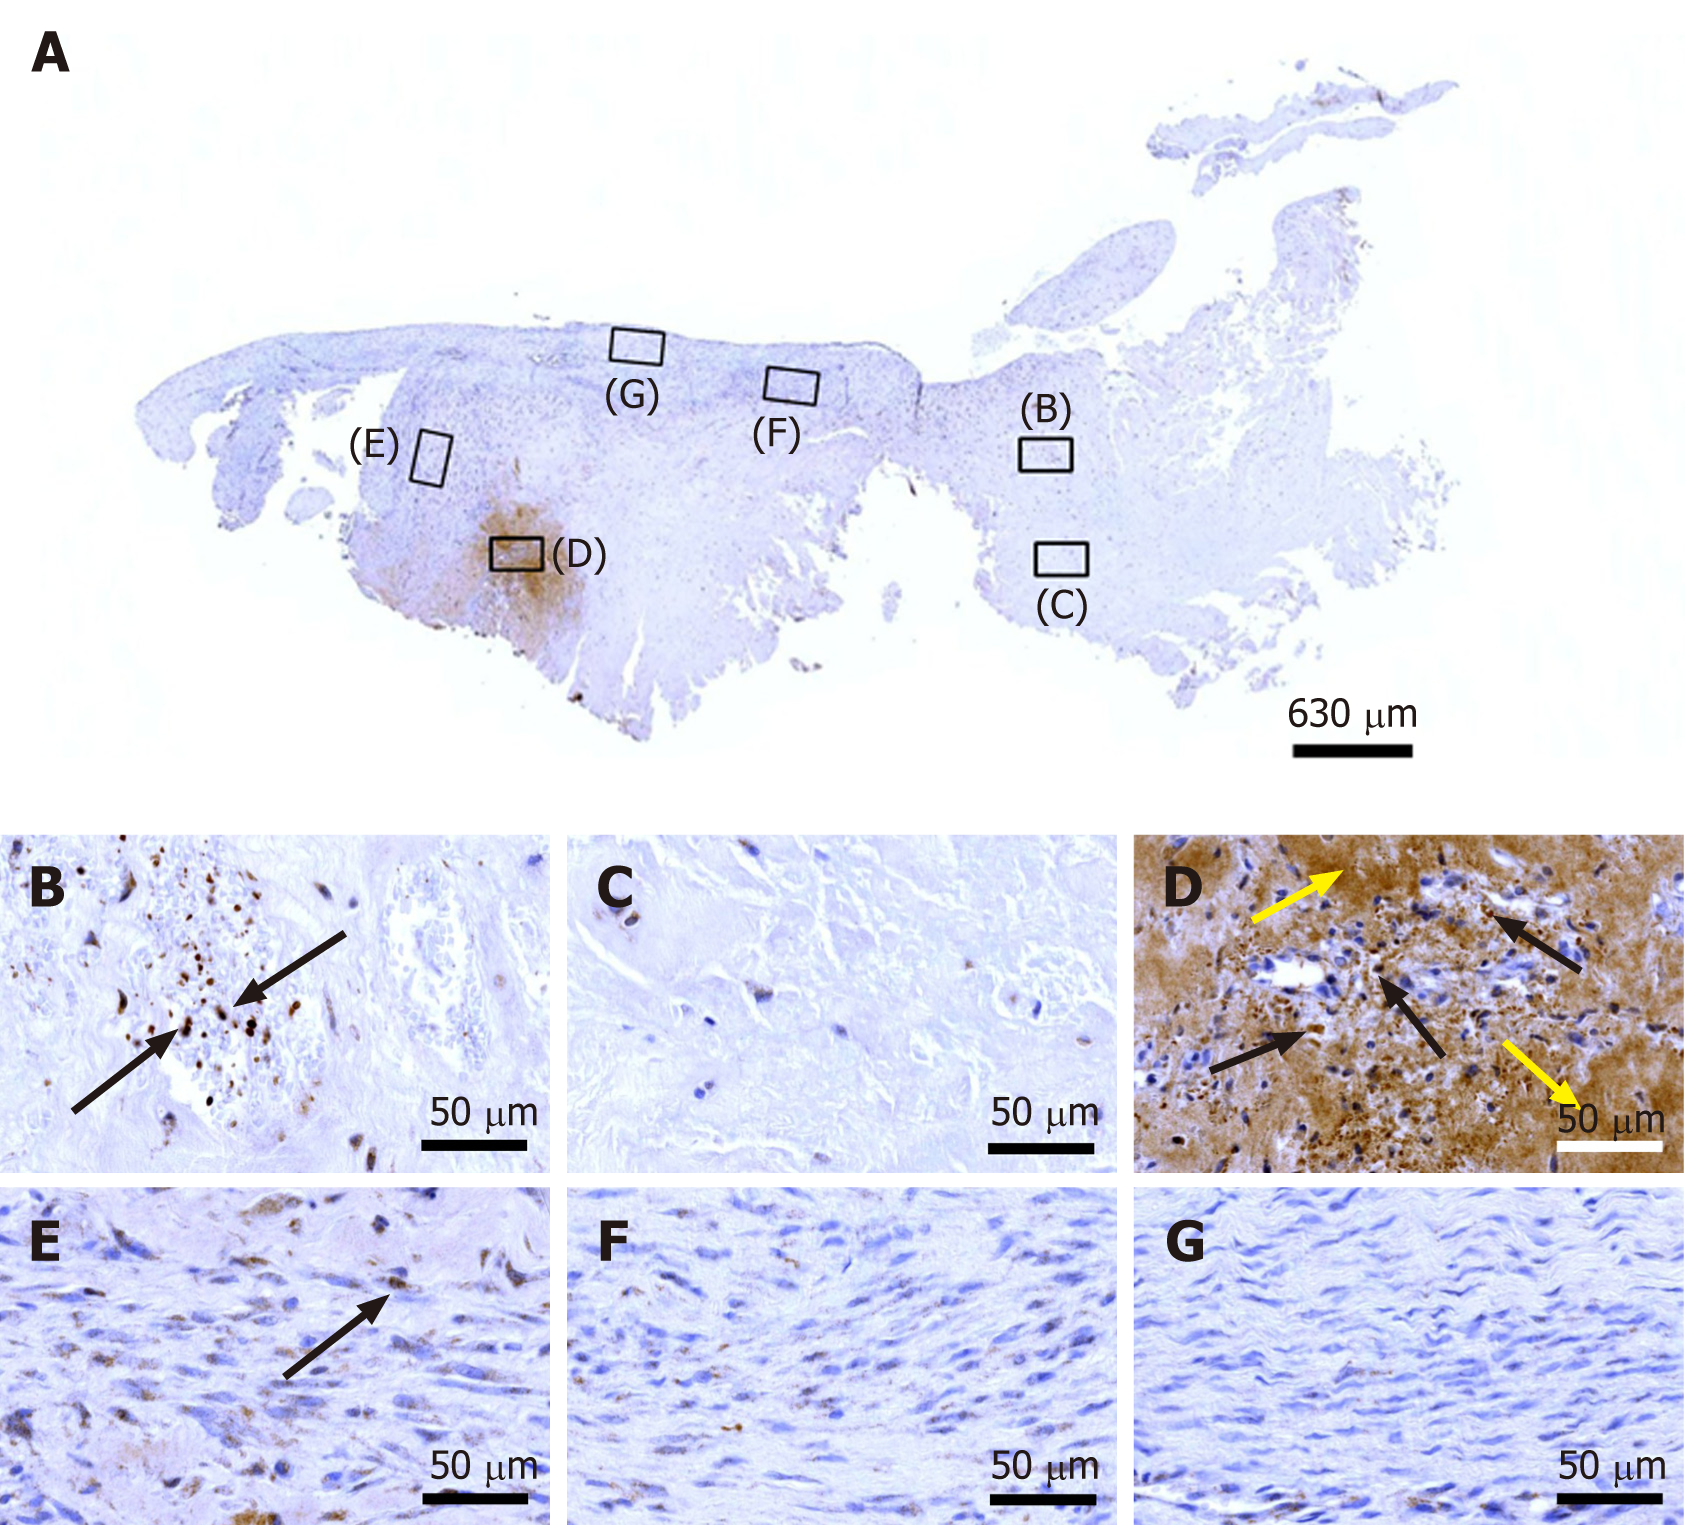
Figure 7 Immunohistochemical detection of Ki-67 in a section of the second part of the biopsy that was investigated in this study (section adjacent to the one shown in Figure 4; counterstaining was performed with Mayer's hematoxylin).
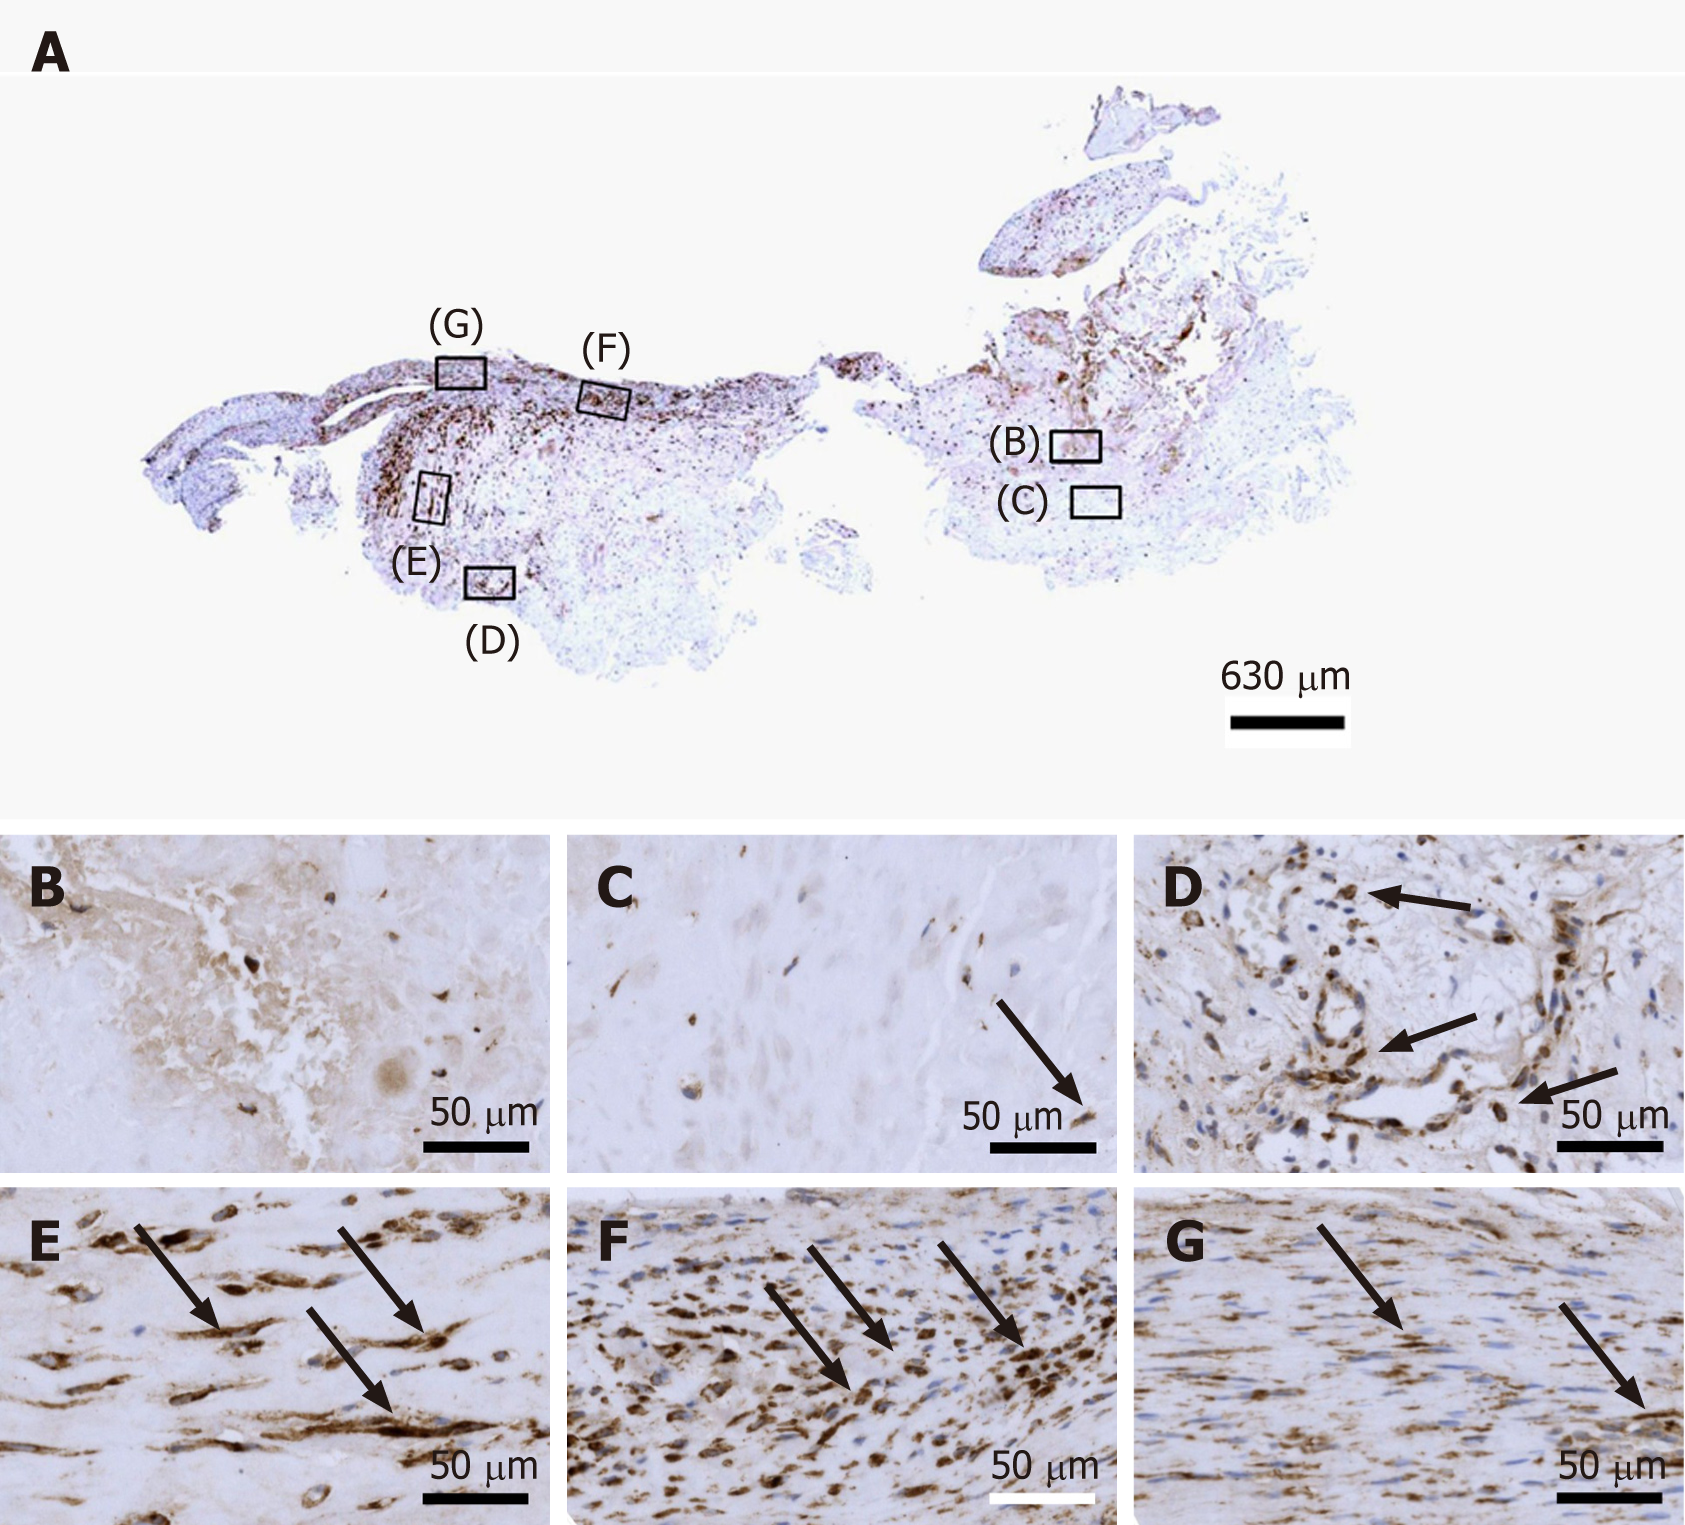
A: Low-power overview (insets, position of the high-power photomicrographs displayed in Panels B-G); B: Position of degenerative tendon tissue with formation of microvessels (black arrow, intracellular immunolabeling for Ki-67); C: Position of degenerative tendon tissue without formation of microvessels (black arrow, intracellular immunolabeling for Ki-67); D: Position of a spot with very high density of cells and microvessels (black arrows, intracellular immunolabeling for Ki-67 inside microvessel walls; yellow arrows, intracellular immunolabeling for Ki-67 outside microvessel walls); E: Position of tendon tissue in the depth of the biopsy; F: Position of tendon tissue below an outer surface of the biopsy (black arrows, intracellular immunolabeling for Ki-67 in elongated cells in a chain-like arrangement); G: Position of tendon tissue at an outer surface of the biopsy.
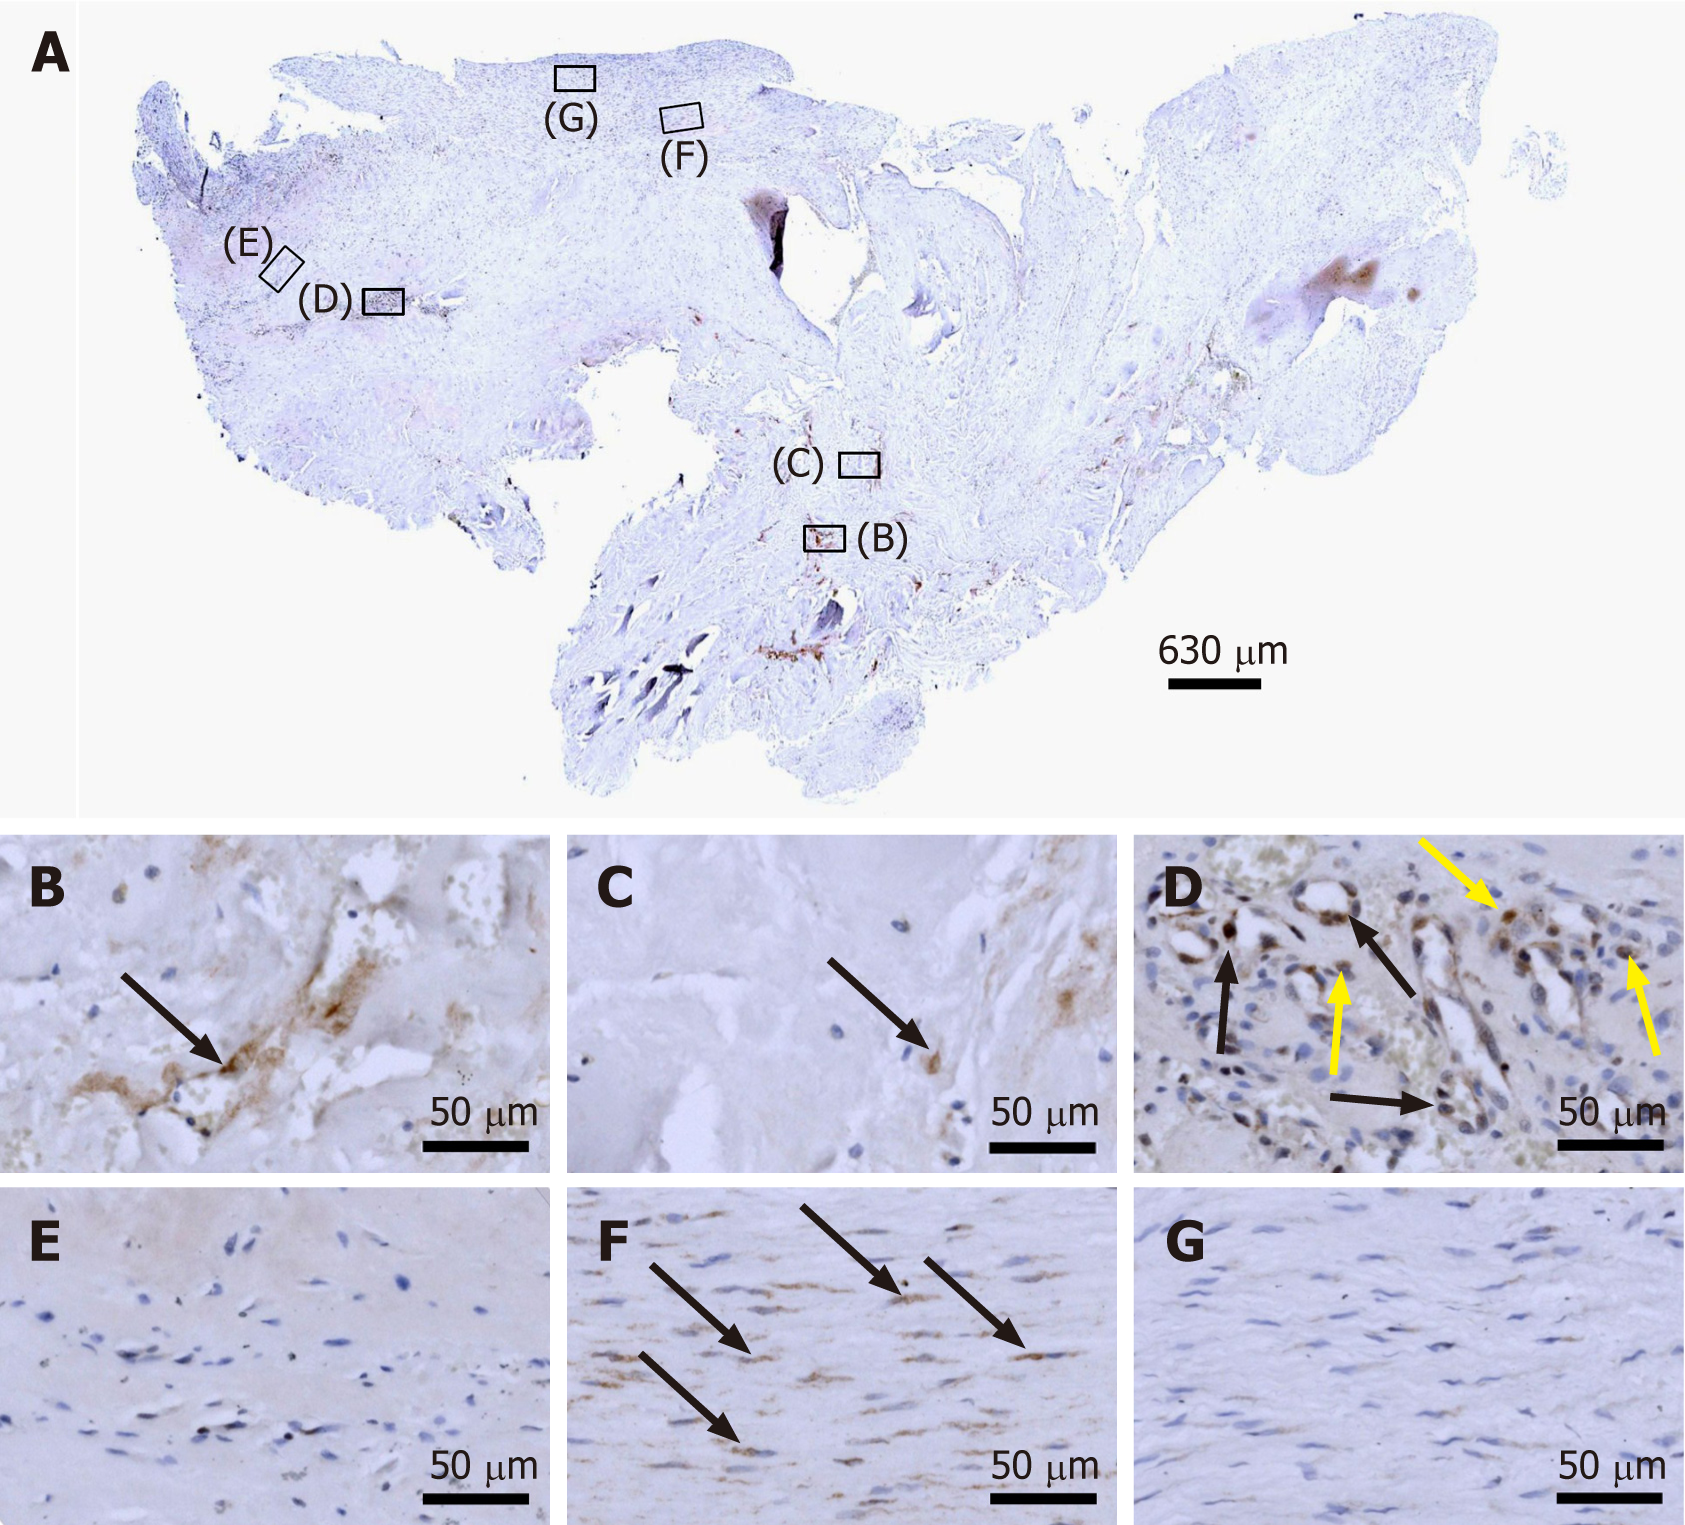
Figure 8 Immunohistochemical detection of tenomodulin in a section of the second part of the biopsy that was investigated in this study (section adjacent to the one shown in Figure 4; counterstaining was performed with Mayer's hematoxylin).
A: Low-power overview (insets, position of the high-power photomicrographs displayed in Panels B-G); B: Position of degenerative tendon tissue with formation of microvessels (black arrows, intracellular immunolabeling for tenomodulin in cells inside microvessels); C: Position of degenerative tendon tissue without formation of microvessels; D: Position of a spot with very high density of cells and microvessels (black arrows, intracellular immunolabeling for tenomodulin; yellow arrows, extracellular immunolabeling for tenomodulin); E: Position of tendon tissue in the depth of the biopsy (black arrows, intracellular immunolabeling for tenomodulin); F: Position of tendon tissue below an outer surface of the biopsy; G: Position of tendon tissue at an outer surface of the biopsy.
Figure 9 Immunohistochemical detection of type I procollagen in a section of the second part of the biopsy that was investigated in this study (section adjacent to the one shown in Figure 4; counterstaining was performed with Mayer's hematoxylin).
A: Low-power overview (insets, position of the high-power photomicrographs displayed in Panels B-G); B: Position of degenerative tendon tissue with formation of microvessels; C: Position of degenerative tendon tissue without formation of microvessels (black arrow, intracellular immunolabeling for type I procollagen); D: Position of a spot with very high density of cells and microvessels (black arrows, intracellular immunolabeling for type I procollagen outside microvessels); E: Position of tendon tissue in the depth of the biopsy (black arrows, intracellular immunolabeling for type I procollagen); F: Position of tendon tissue below an outer surface of the biopsy (black arrows, intracellular immunolabeling for type I procollagen); G: Position of tendon tissue at an outer surface of the biopsy (black arrows, intracellular immunolabeling for type I procollagen).
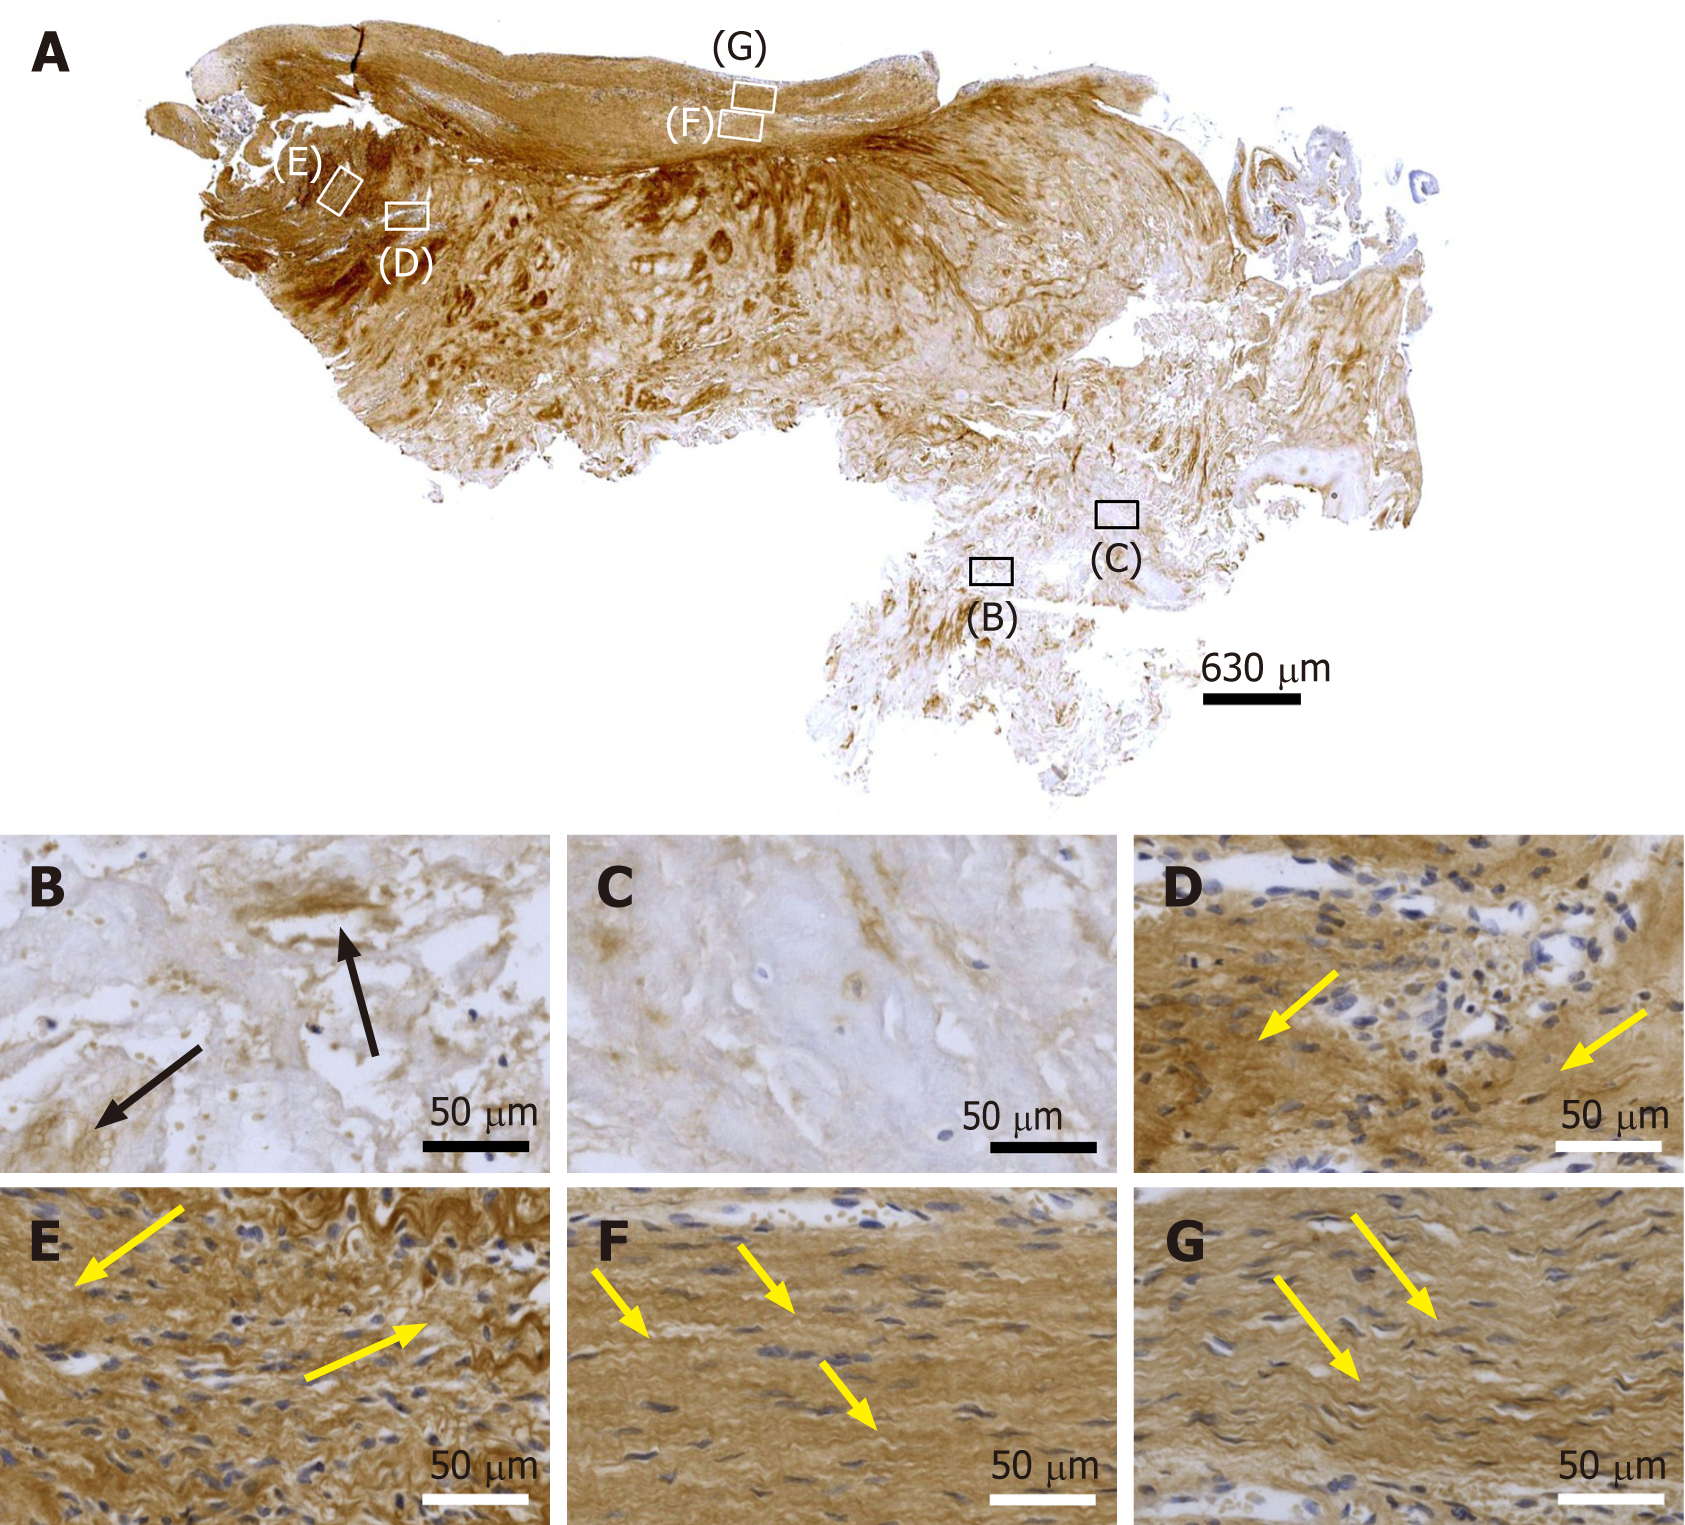
Figure 10 Immunohistochemical detection of type I collagen in a section of the second part of the biopsy that was investigated in this study (section adjacent to the one shown in Figure 4; counterstaining was performed with Mayer's hematoxylin).
A: Low-power overview (insets, position of the high-power photomicrographs displayed in Panels B-G); B: Position of degenerative tendon tissue with formation of microvessels (black arrows, immunolabeling for unorganized type I collagen); C: Position of degenerative tendon tissue without formation of microvessels; D: Position of a spot with very high density of cells and microvessels (yellow arrows, immunolabeling for unorganized type I collagen); E: Position of tendon tissue in the depth of the biopsy (yellow arrows, immunolabeling for unorganized type I collagen); F: Position of tendon tissue below an outer surface of the biopsy (yellow arrows, immunolabeling for organized, slightly undulating type I collagen); G: Position of tendon tissue at an outer surface of the biopsy (yellow arrows, immunolabeling for organized, slightly undulating type I collagen).
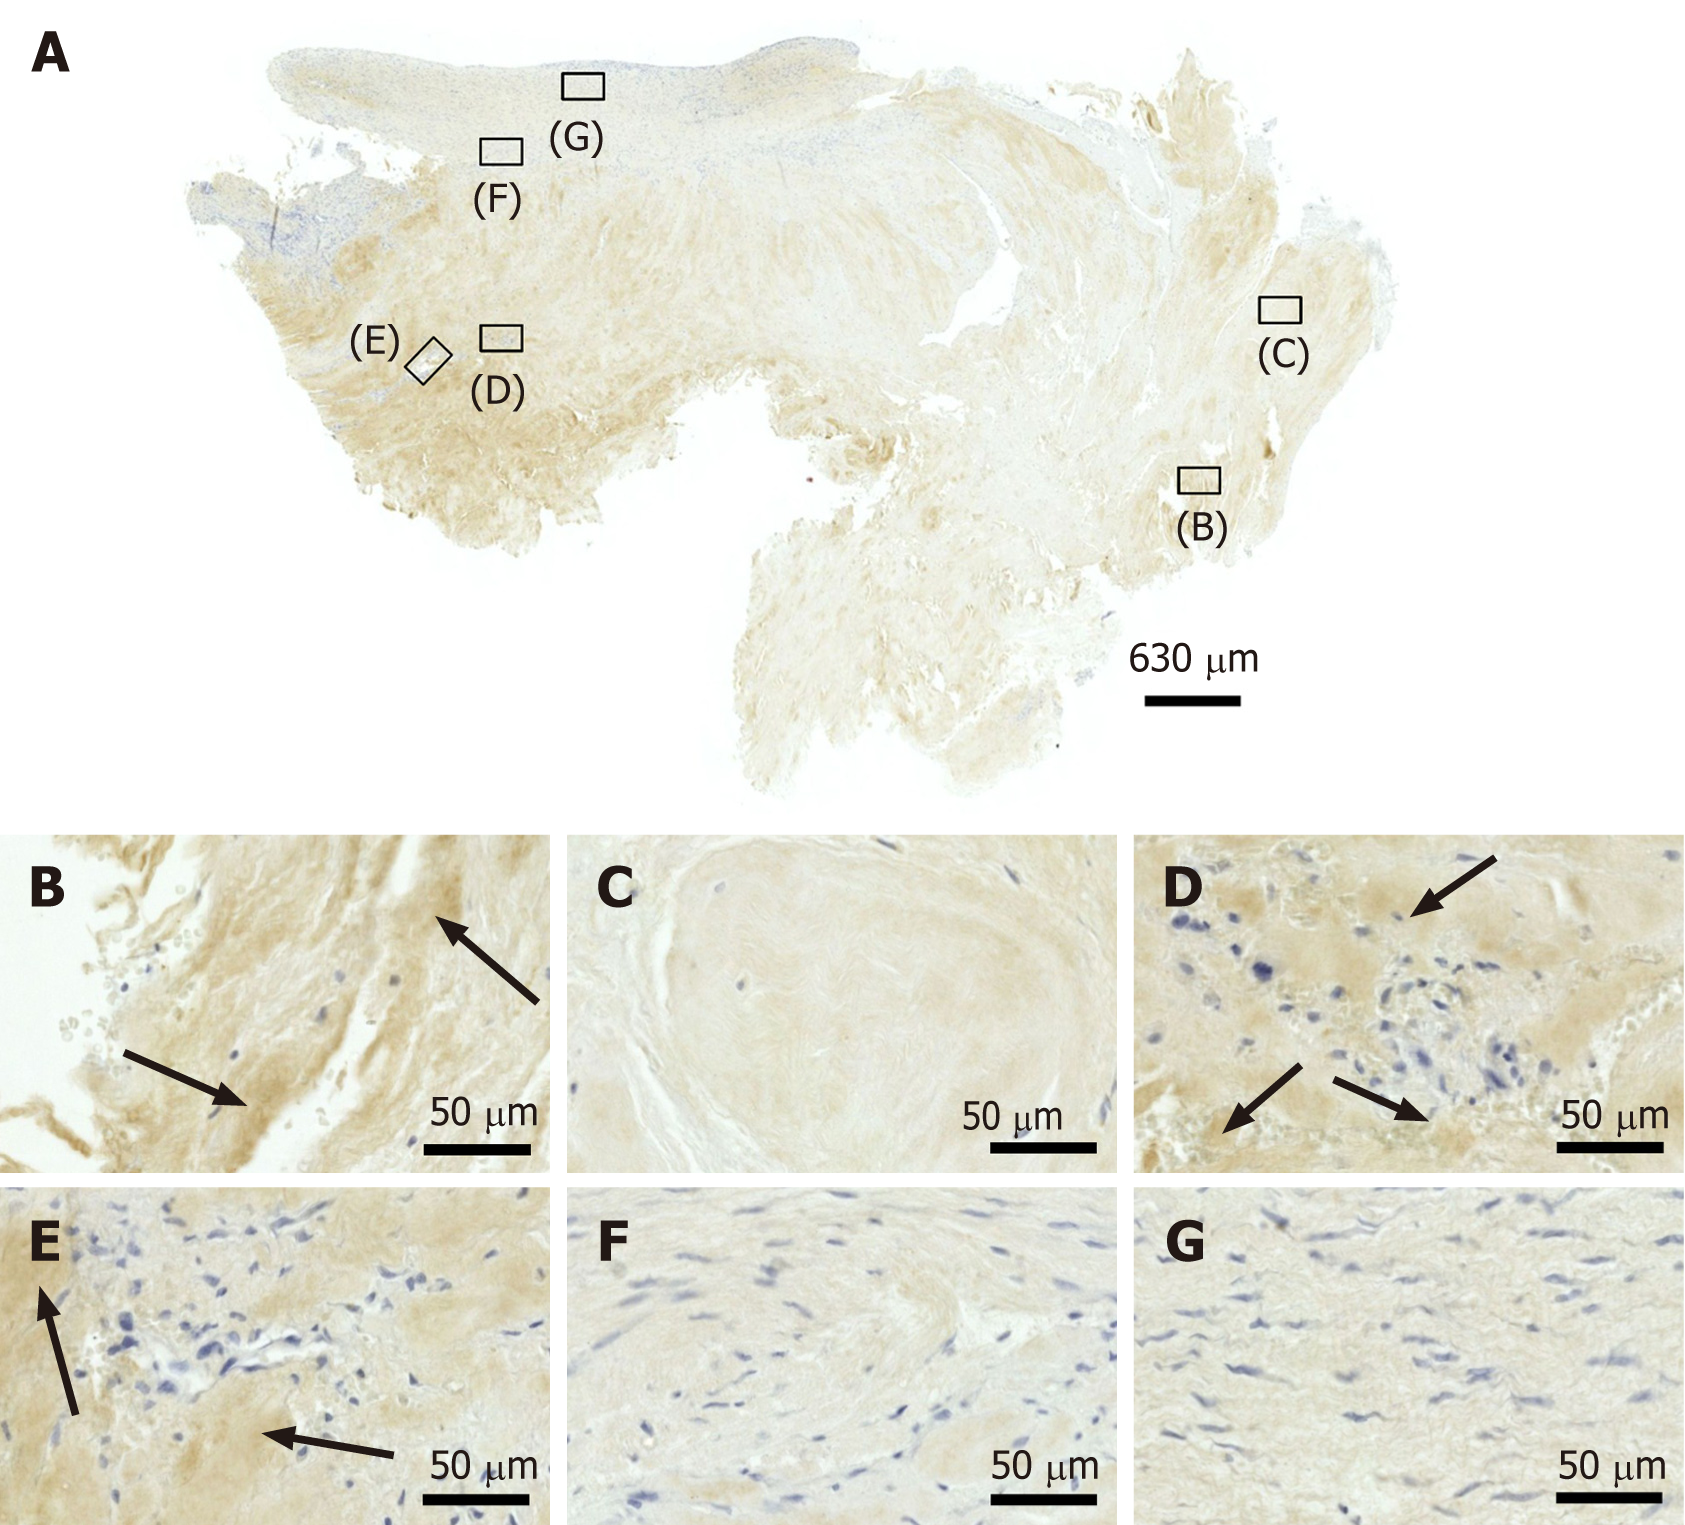
Figure 11 Immunohistochemical detection of type III collagen in a section of the second part of the biopsy that was investigated in this study (section adjacent to the one shown in Figure 4; counterstaining was performed with Mayer's hematoxylin).
A: Low-power overview (insets, position of the high-power photomicrographs displayed in Panels B-G); B: Position of degenerative tendon tissue with formation of microvessels (black arrows, extracellular immunolabeling for type III collagen); C: Position of degenerative tendon tissue without formation of microvessels; D: Position of a spot with very high density of cells and microvessels (black arrows, extracellular immunolabeling for type III collagen); E: Position of tendon tissue in the depth of the biopsy (black arrows, extracellular immunolabeling for type III collagen); F: Position of tendon tissue below an outer surface of the biopsy; G: Position of tendon tissue at an outer surface of the biopsy.
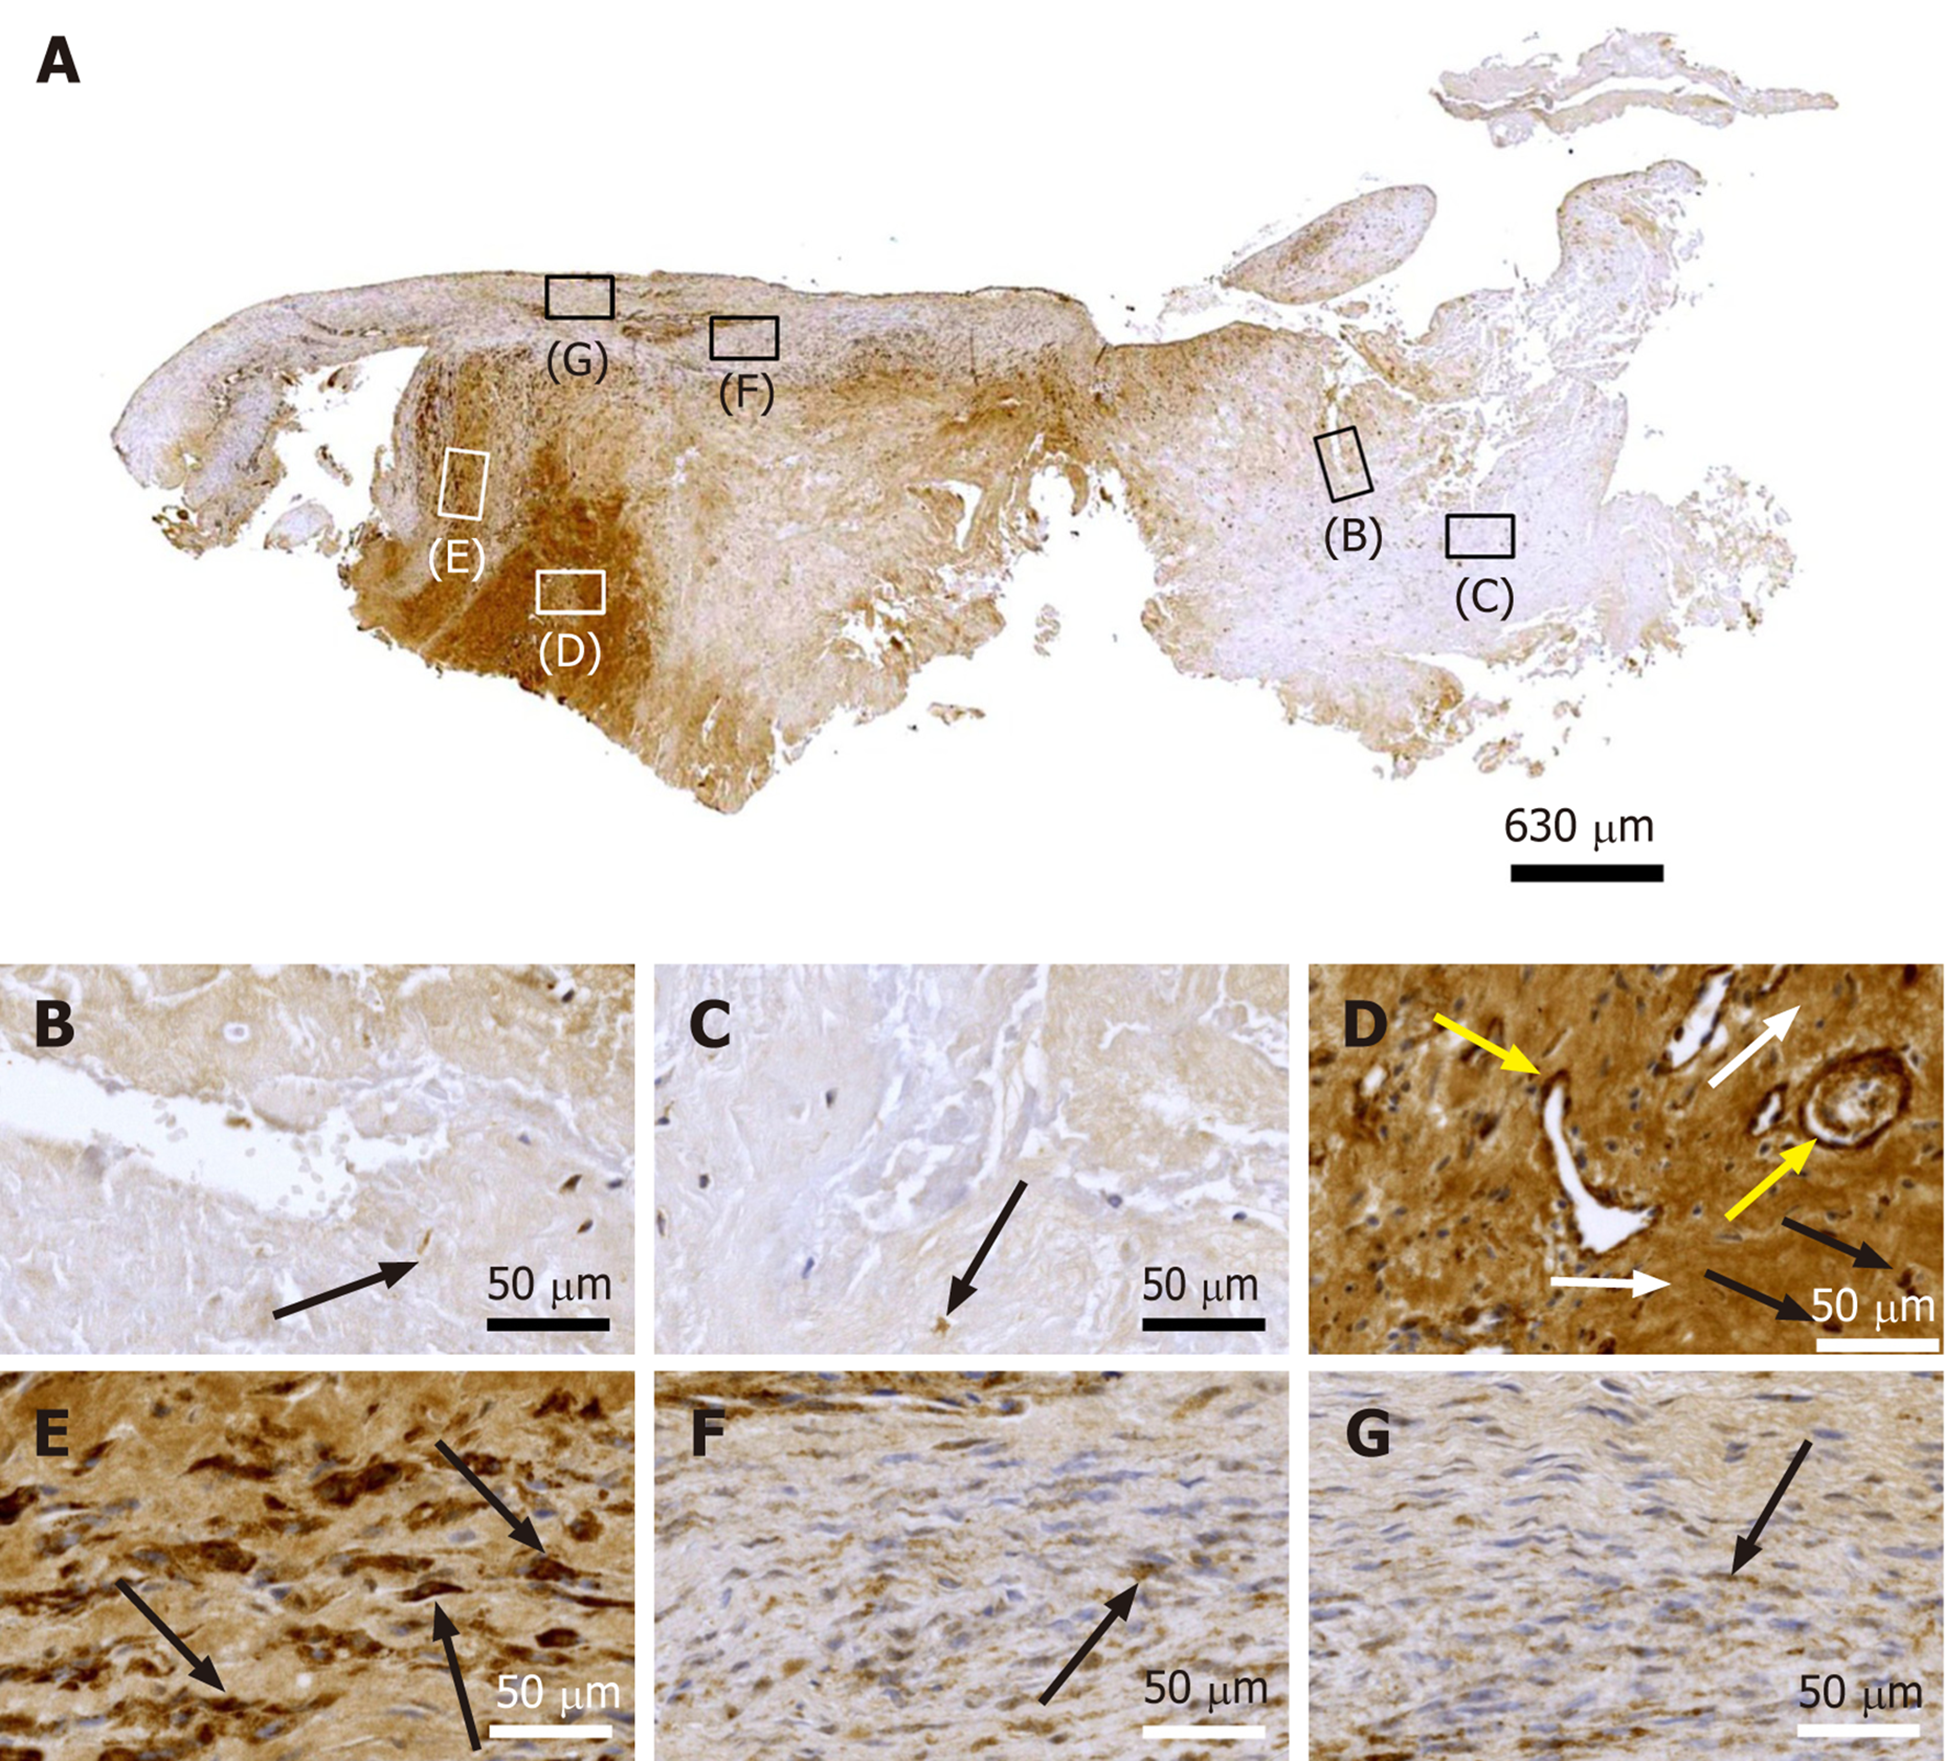
Figure 12 Immunohistochemical detection of laminin in a section of the second part of the biopsy that was investigated in this study (section adjacent to the one shown in Figure 4; counterstaining was performed with Mayer's hematoxylin).
A: Low-power overview (insets, position of the high-power photomicrographs displayed in Panels B-G); B: Position of degenerative tendon tissue with formation of microvessels (black arrow, intracellular immunolabeling for laminin); C: Position of degenerative tendon tissue without formation of microvessels (black arrow, intracellular immunolabeling for laminin); D: Position of a spot with very high density of cells and microvessels (black arrows, intracellular immunolabeling for laminin outside microvessel walls; yellow arrows, intracellular immunolabeling for laminin inside microvessel walls; white arrows, extracellular immunolabeling for laminin); E: Position of tendon tissue in the depth of the biopsy (black arrows, intracellular immunolabeling for laminin); F: Position of tendon tissue below an outer surface of the biopsy (black arrow, intracellular immunolabeling for laminin); G: Position of tendon tissue at an outer surface of the biopsy (black arrow, intracellular immunolabeling for laminin).
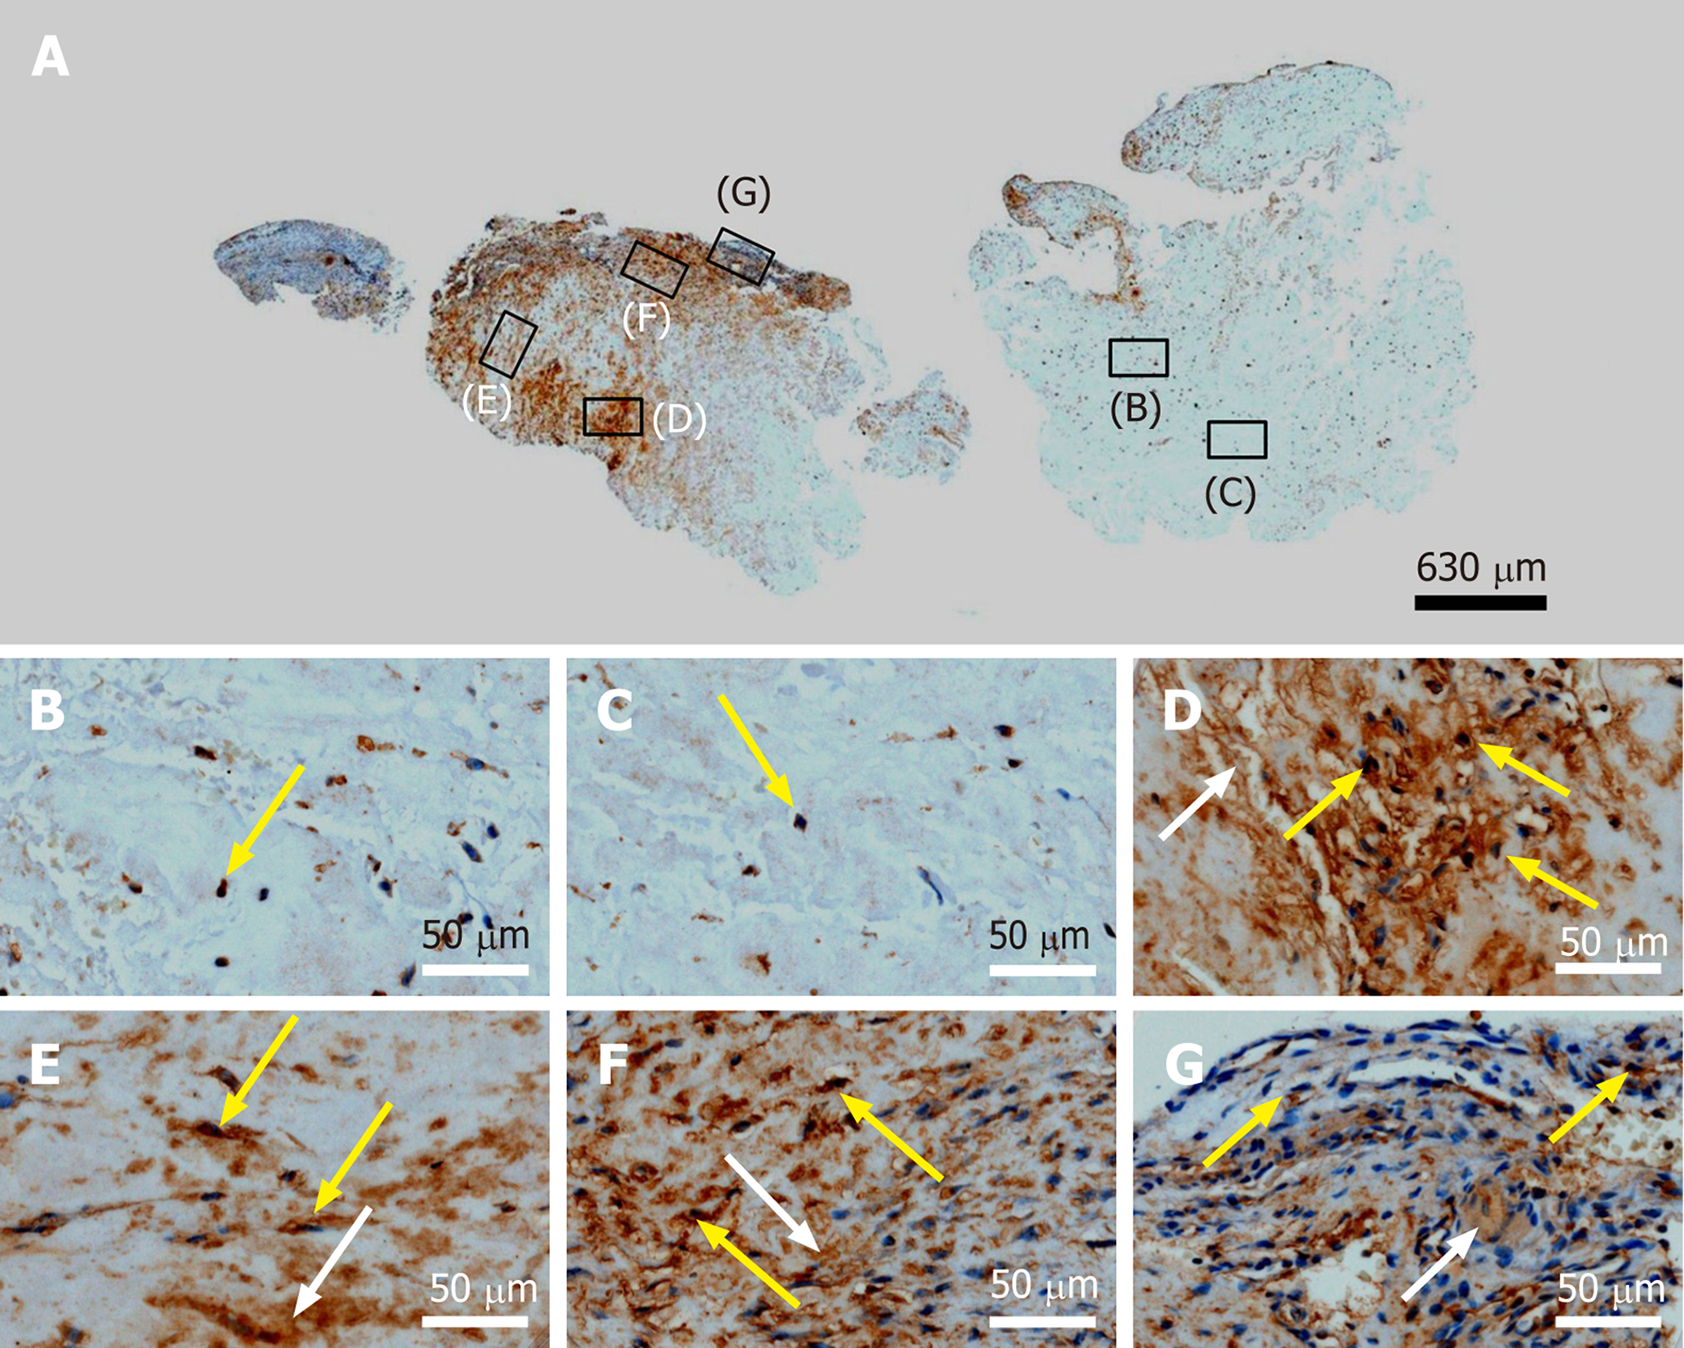
Figure 13 Immunohistochemical detection of matrix metalloproteinase 2 (MMP-2) in a section of the second part of the biopsy that was investigated in this study (section adjacent to the one shown in Figure 4; counterstaining was performed with Mayer's hematoxylin).
A: Low-power overview (insets, position of the high-power photomicrographs displayed in Panels B-G); B: Position of degenerative tendon tissue with formation of microvessels [yellow arrow, intracellular immunolabeling for matrix metalloproteinase 2 (MMP-2)]; C: Position of degenerative tendon tissue without formation of microvessels (yellow arrow, intracellular immunolabeling for MMP-2); D: Position of a spot with very high density of cells and microvessels (yellow arrows, intracellular immunolabeling for MMP-2; white arrow, extracellular immunolabeling for MMP-2); E: Position of tendon tissue in the depth of the biopsy (yellow arrows, intracellular immunolabeling for MMP-2; white arrow, extracellular immunolabeling for MMP-2); F: Position of tendon tissue below an outer surface of the biopsy (yellow arrows, intracellular immunolabeling for MMP-2; white arrow, extracellular immunolabeling for MMP-2); G: Position of tendon tissue at an outer surface of the biopsy (yellow arrows, intracellular immunolabeling for MMP-2; white arrow, extracellular immunolabeling for MMP-2).
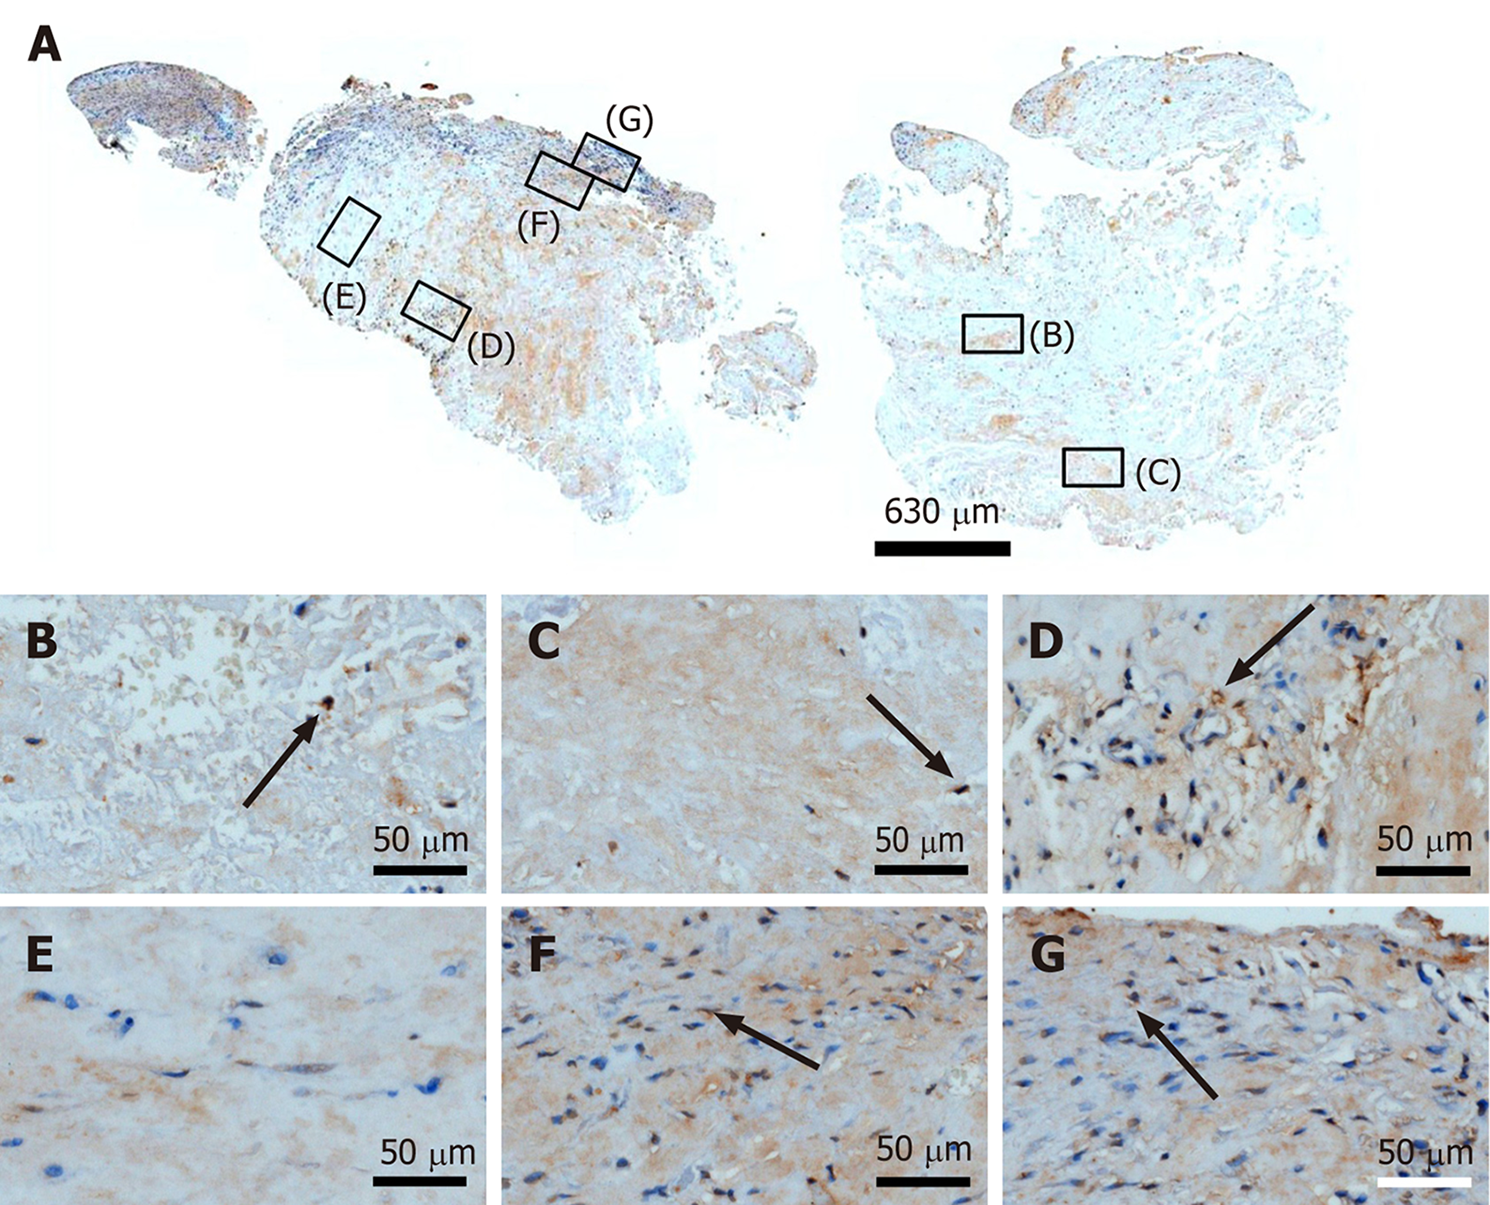
Figure 14 Immunohistochemical detection of matrix metalloproteinase 9 in a section of the second part of the biopsy that was inve
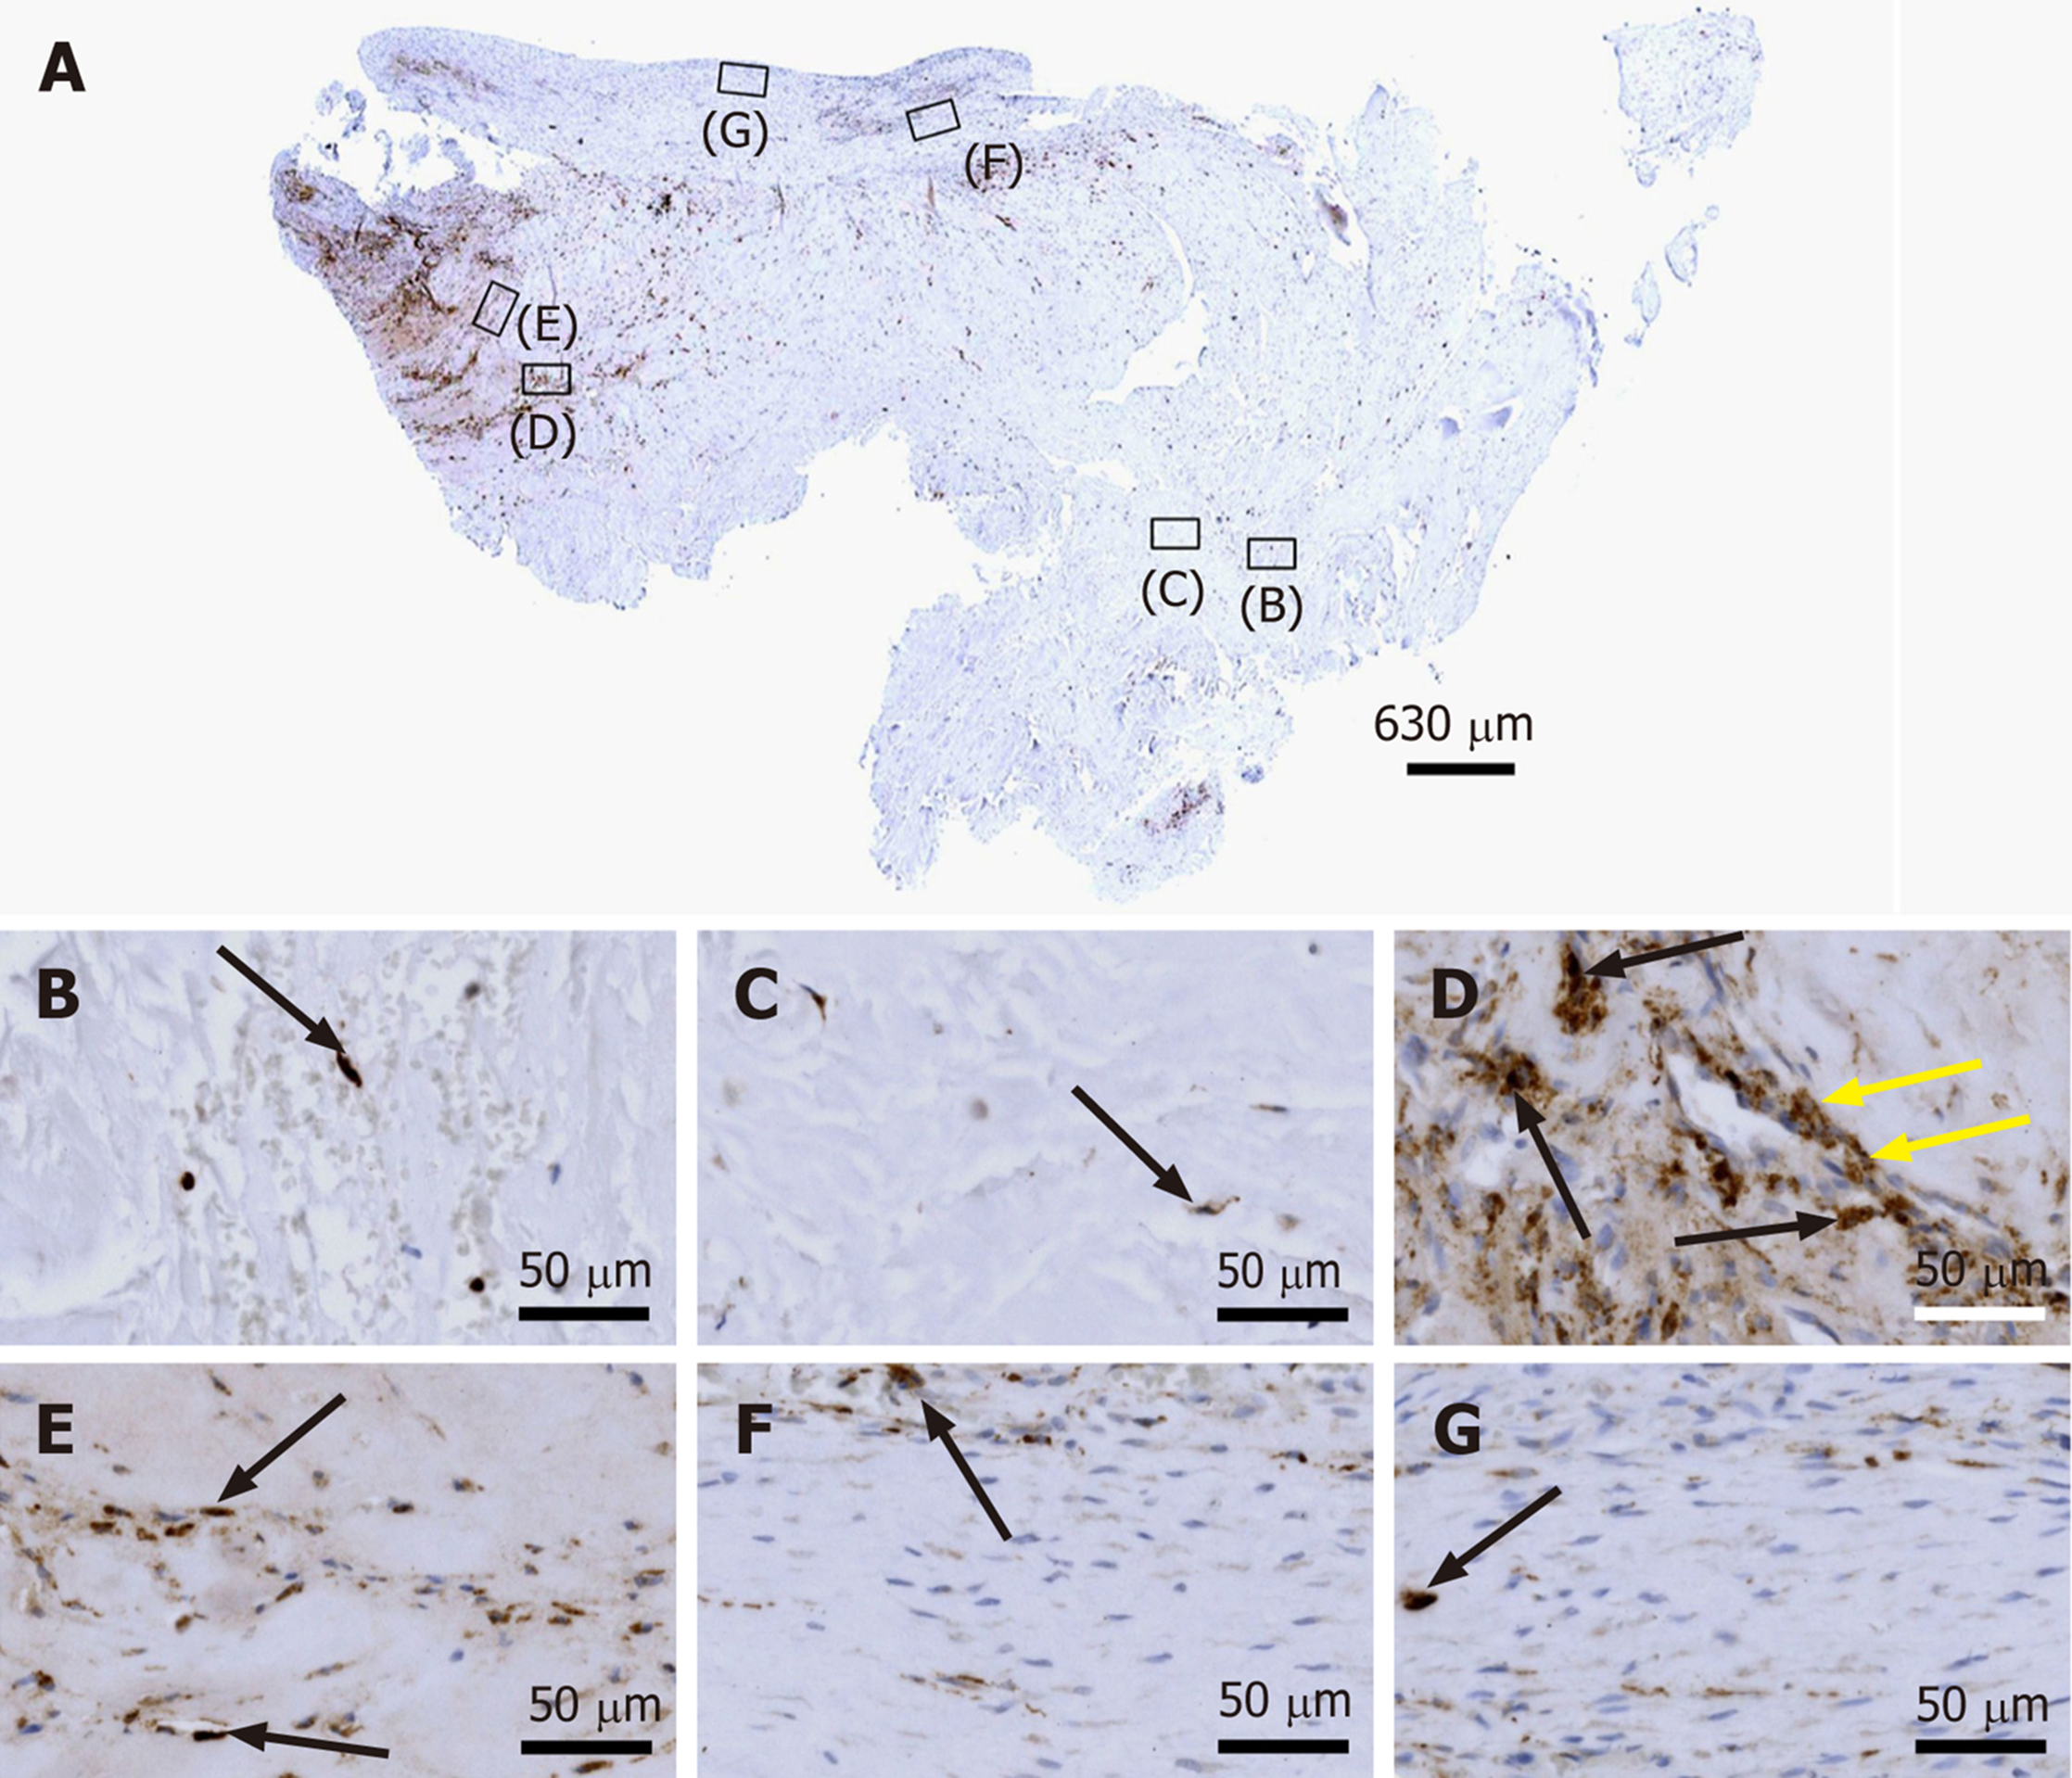
Figure 15 Immunohistochemical detection of cluster of differentiation 68 in a section of the second part of the biopsy that was investigated in this study (section adjacent to the one shown in Figure 4; counterstaining was performed with Mayer's hematoxylin).
A: Low-power overview (insets, position of the high-power photomicrographs displayed in Panels B-G); B: Position of degenerative tendon tissue with formation of microvessels [black arrow, intracellular labeling for cluster of differentiation (CD68)]; C: Position of degenerative tendon tissue without formation of microvessels (black arrow, intracellular labeling for CD68); D: Position of a spot with very high density of cells and microvessels (black arrows, intracellular labeling for CD68 outside microvessel walls; yellow arrows, intracellular immunolabeling for CD68 inside microvessel walls); E: Position of tendon tissue in the depth of the biopsy (black arrows, intracellular labeling for CD68); F: Position of tendon tissue below an outer surface of the biopsy (black arrow, intracellular labeling for CD68); G: Position of tendon tissue at an outer surface of the biopsy (black arrow, intracellular labeling for CD68).
- Citation: Alt E, Rothoerl R, Hoppert M, Frank HG, Wuerfel T, Alt C, Schmitz C. First immunohistochemical evidence of human tendon repair following stem cell injection: A case report and review of literature. World J Stem Cells 2021; 13(7): 944-970
- URL: https://www.wjgnet.com/1948-0210/full/v13/i7/944.htm
- DOI: https://dx.doi.org/10.4252/wjsc.v13.i7.944


