Copyright
©The Author(s) 2021.
World J Stem Cells. May 26, 2021; 13(5): 452-469
Published online May 26, 2021. doi: 10.4252/wjsc.v13.i5.452
Published online May 26, 2021. doi: 10.4252/wjsc.v13.i5.452
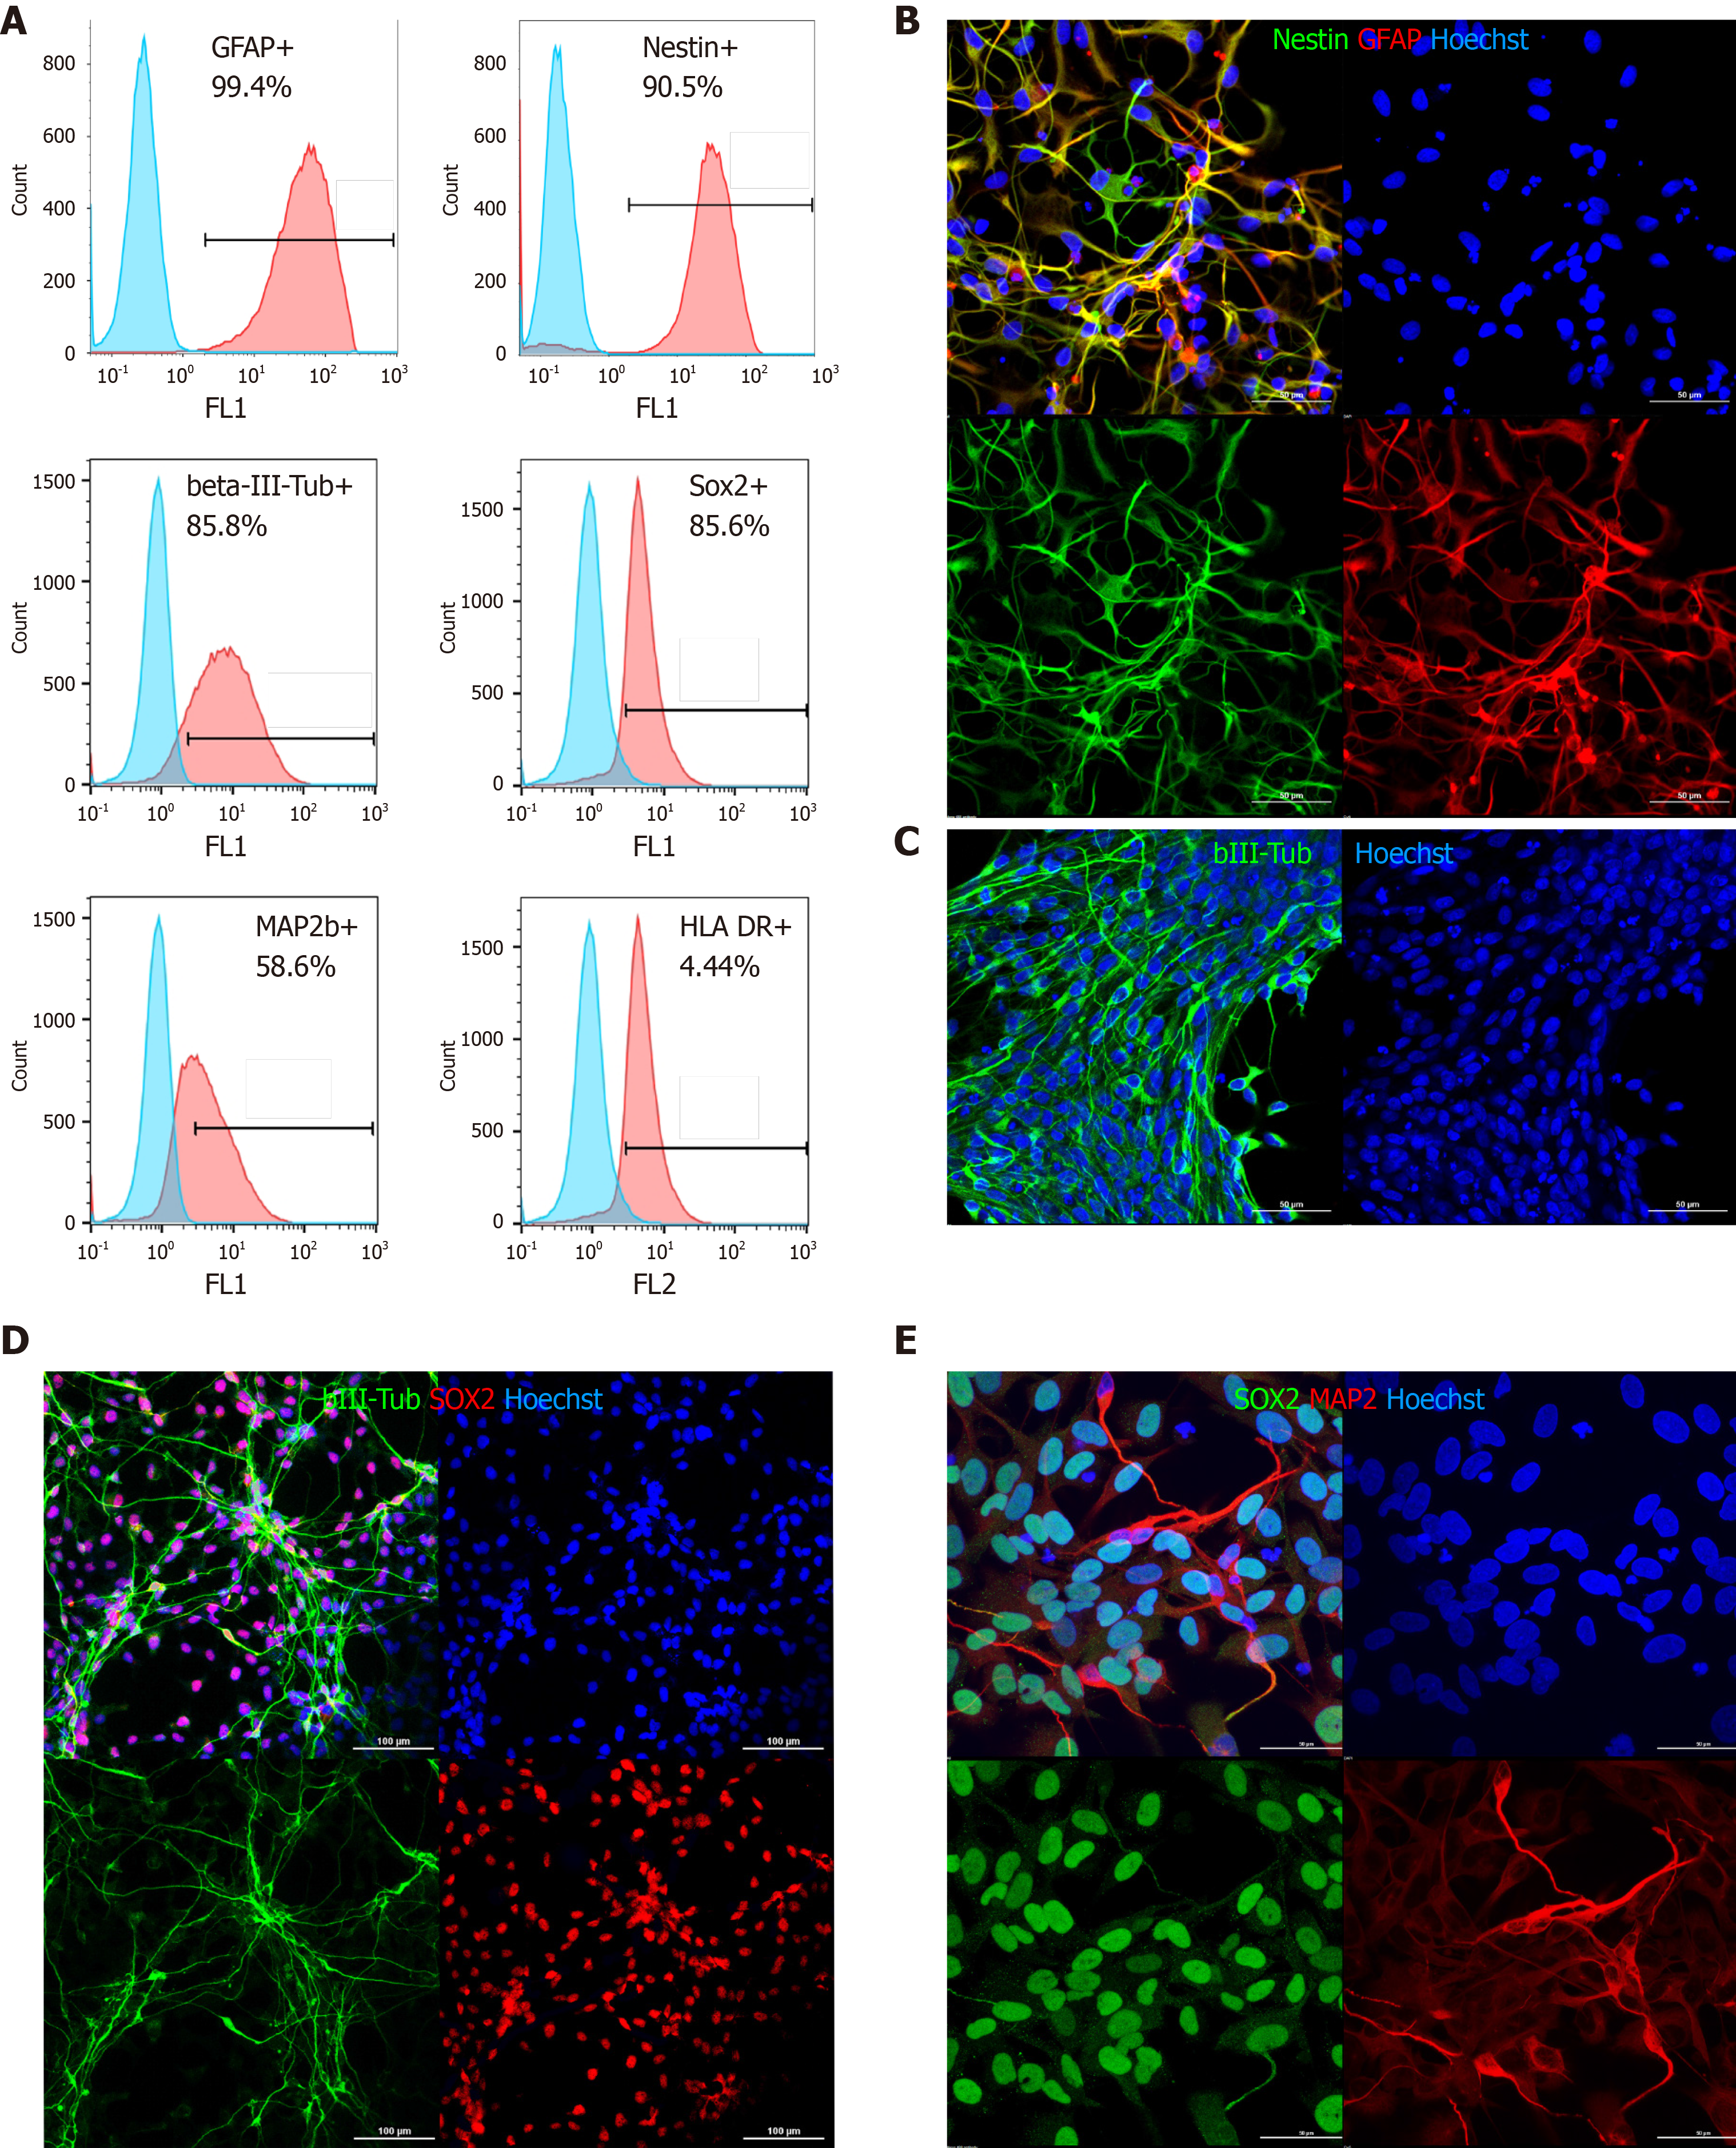
Figure 1 Phenotypic characterization of directly reprogrammed neural precursor cells by flow cytometry and immunocytochemistry.
A: Flow cytometry: blue peaks-negative control (isotype immunoglobulins); from left to right, top to bottom: Glial fibrillary acidic protein, nestin, βIII-tubulin SRY-box transcription factor 2 (SOX2), microtubule associated protein 2 (MAP2), human leukocyte antigen (HLA)-DR; B: Nestin and glial fibrillary acidic protein staining (most cells are double positive); C: βIII-tubulin (green); D: βIII-tubulin (green) and SOX2 (red); E: MAP2 (red) and SOX2 (green) (D and E: Partial spontaneous differentiation of directly reprogrammed neural precursor cells on laminin/poly-L-lysine coated plastic). In all panels, nuclei are counterstained with Hoechst (blue). Scale bar, 50 μm (B, C, and E) and 100 μm (D).
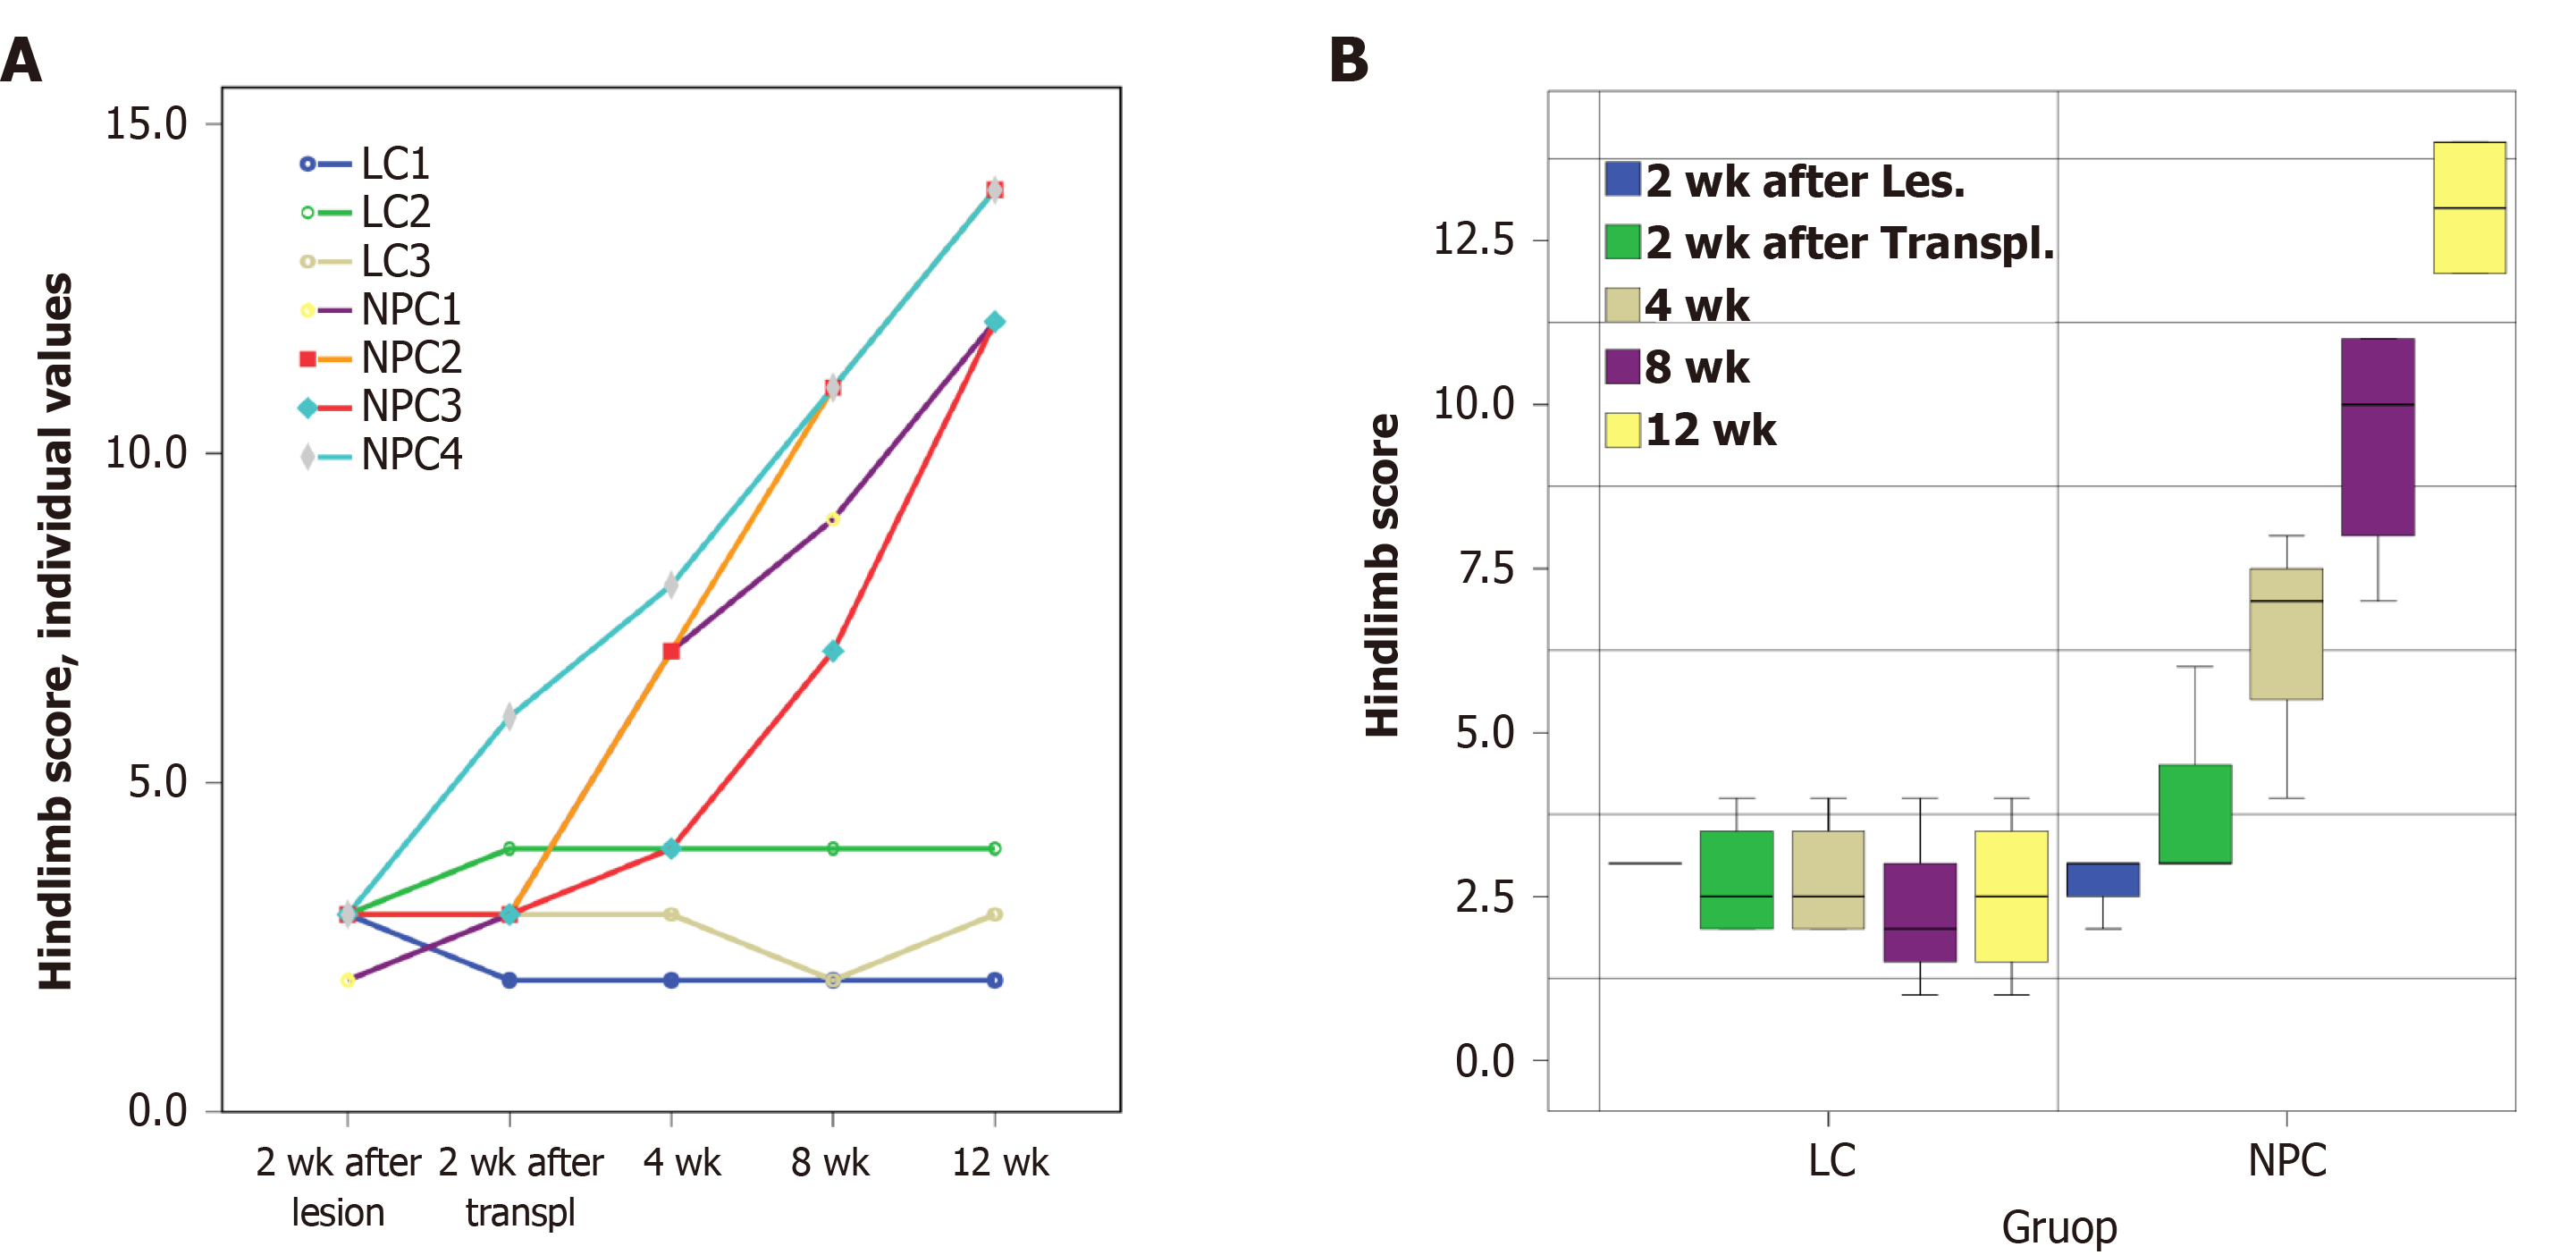
Figure 2 Changes in the hindlimb score in the experimental groups up to 12 wk after directly reprogrammed neural precursor cell transplantation or vehicle injection.
A: Hindlimb scores of individual animals; B: Box plots of the parameters in the lesion control (LC) group and neural progenitor cell (NPC) groups (the median, the minimum, and maximum values and the first and third quartiles). The hindlimb scores of the LC group did not change over time. However, the hindlimb scores in the NPC group significantly increased over time and were statistically significant at 4, 8, and 12 wk post transplantation when compared to the pretransplantation time point (P < 0.01). Differences between the LC and NPC groups are significant from the 4th wk (P < 0.01, as estimated using the mixed linear model).
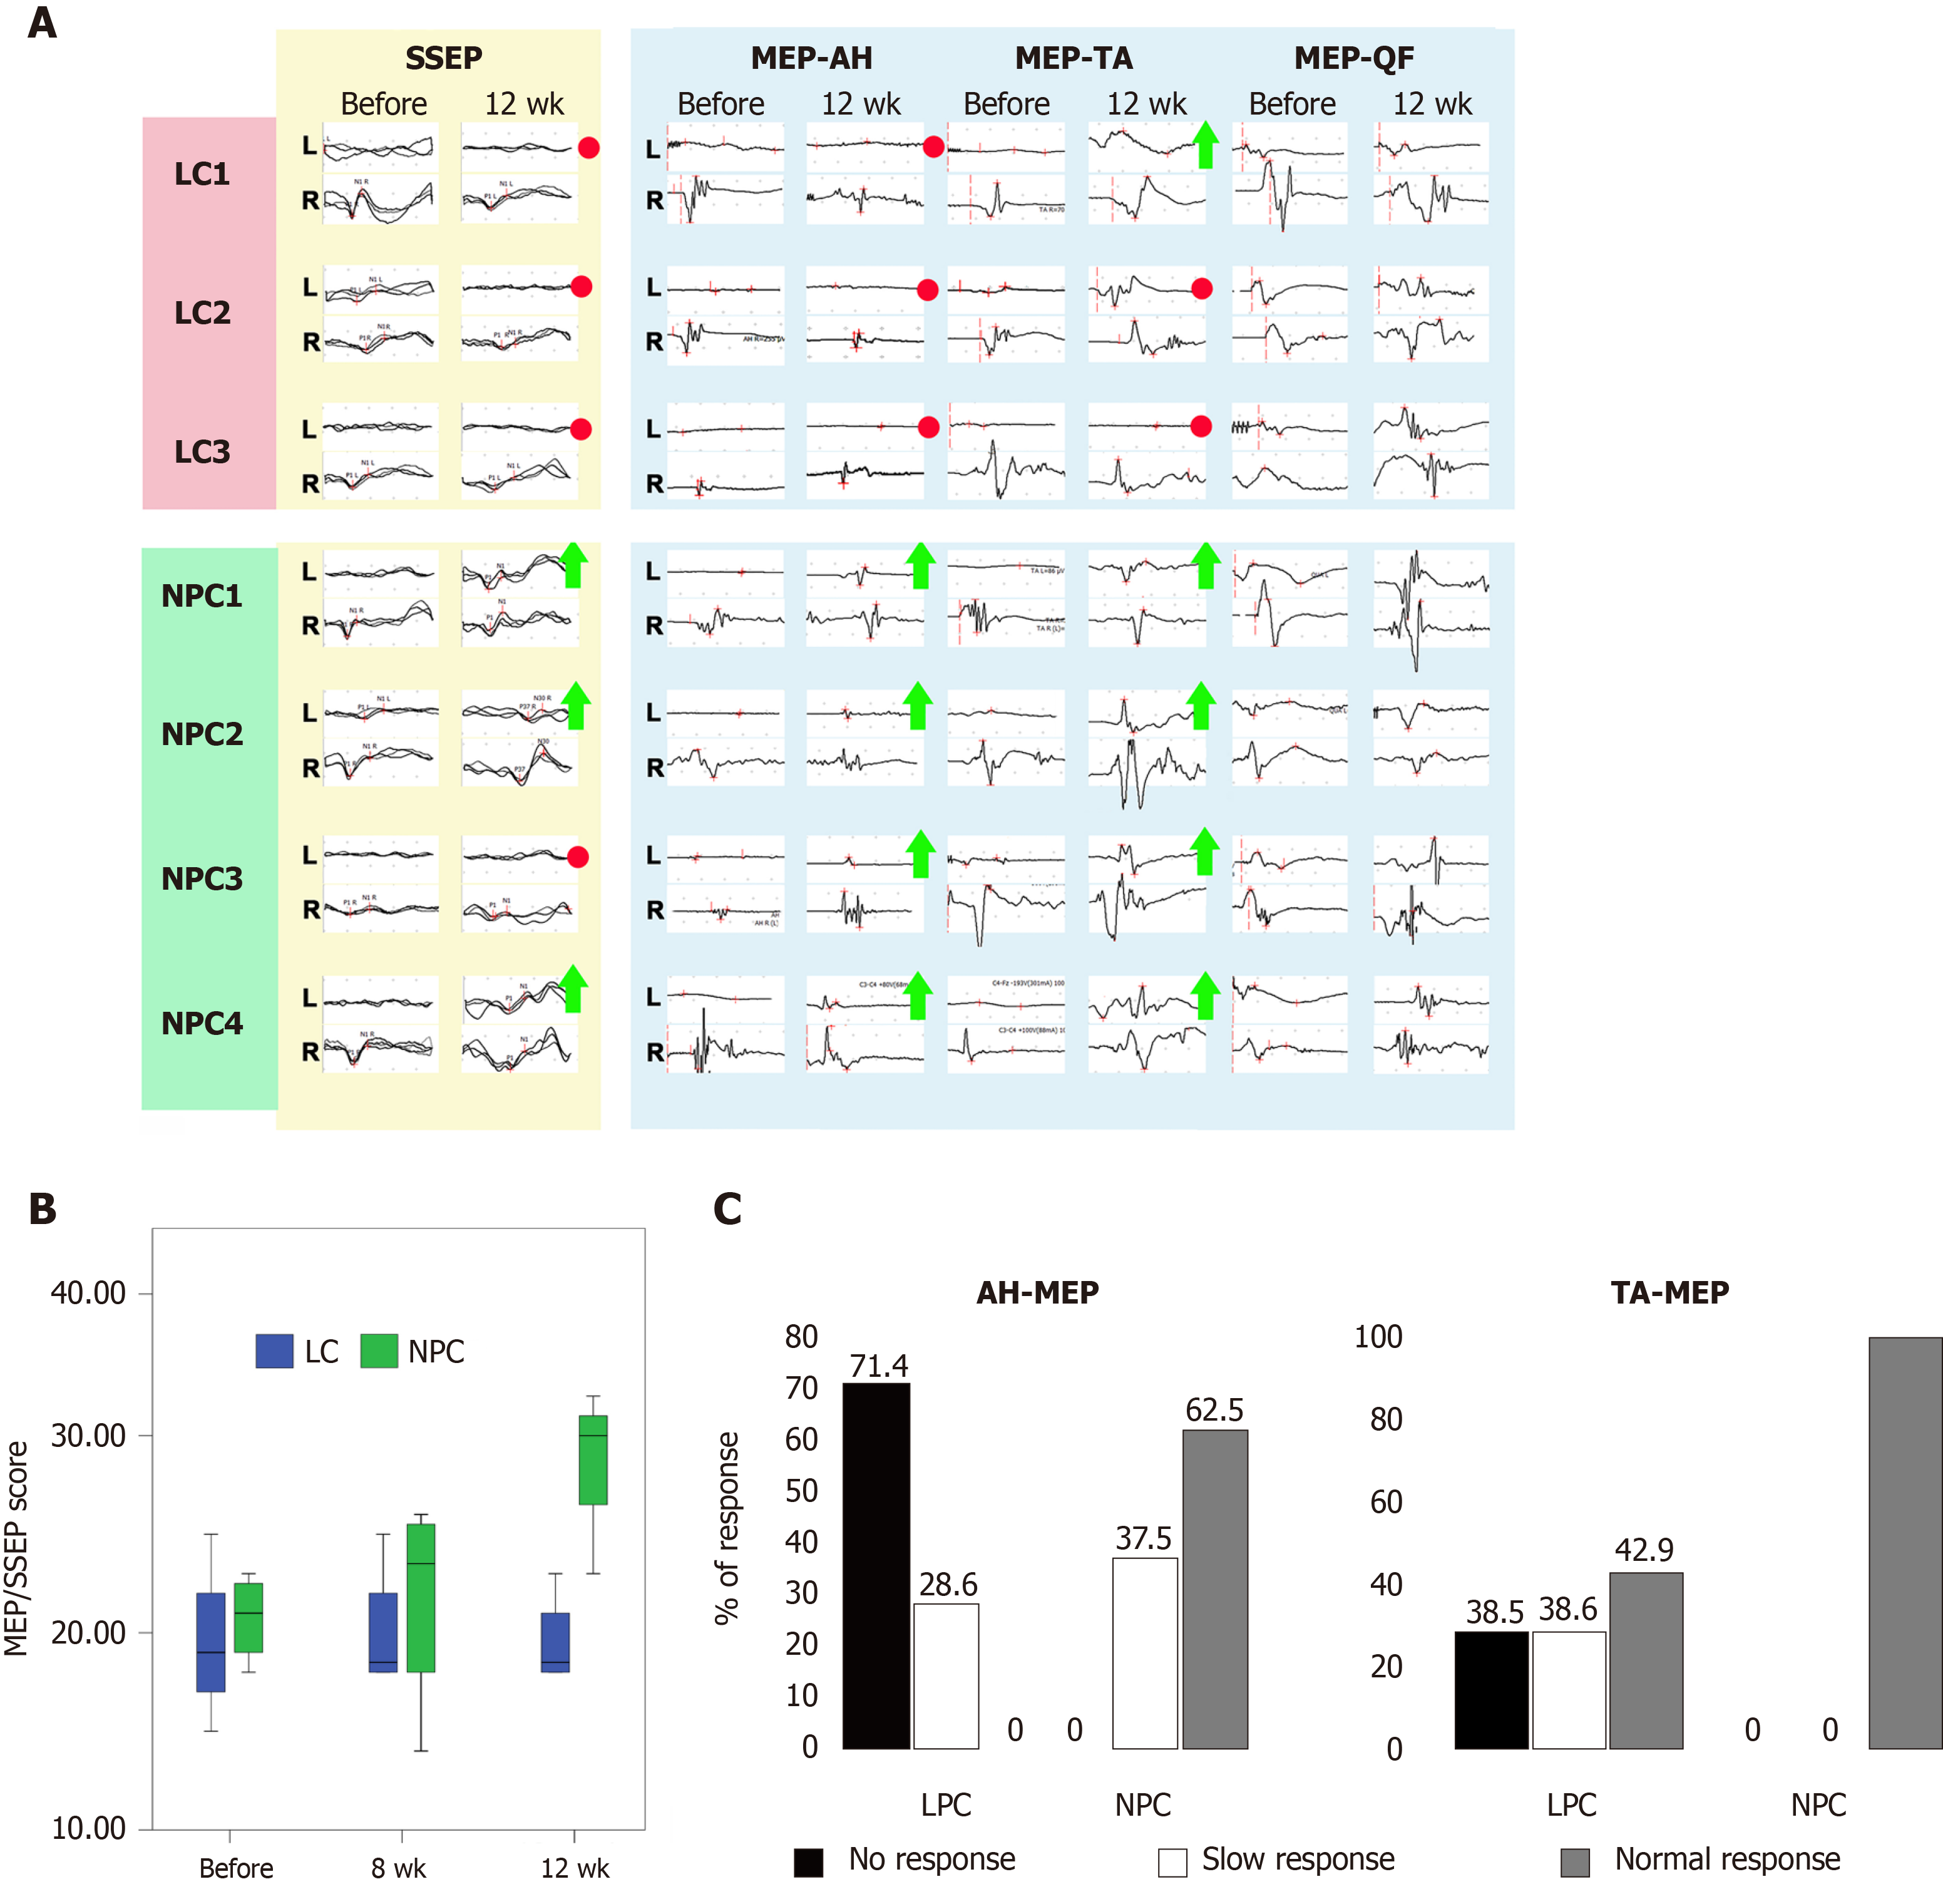
Figure 3 Functional assessment.
A: Examples of somatosensory evoked potential (SSEP) and motor evoked potential (MEP) from all animals in the lesion control (LC) group and neural progenitor cell (NPC) group. Red circles indicate lack of recovery. Green arrows indicate recovery by 1 point of the EP scale. The MEP-musculus quadriceps femoris (QF) served as an internal control as the neighboring quadriceps femoris pathways were not specifically dissected and thus minimally affected. The MEP-quadriceps femoris showed no deterioration over time indicating the safety of the transplant procedure and the directly reprogrammed NPCs; B: Box plots of evoked potential scores in the LC and NPC groups (median, minimum, and maximum values and first and third quartiles). Differences between the groups 12 wk after the transplantation were significant (P < 0.01, as estimated using the mixed linear model); C: Semiquantitative analysis of the MEP-abductor hallucis and MEP-tibialis anterior latencies on the ipsilateral side 12 wk after directly reprogrammed NPC transplantation or vehicle injection. AH: Musculus abductor hallucis; TA: Musculus tibialis anterior.
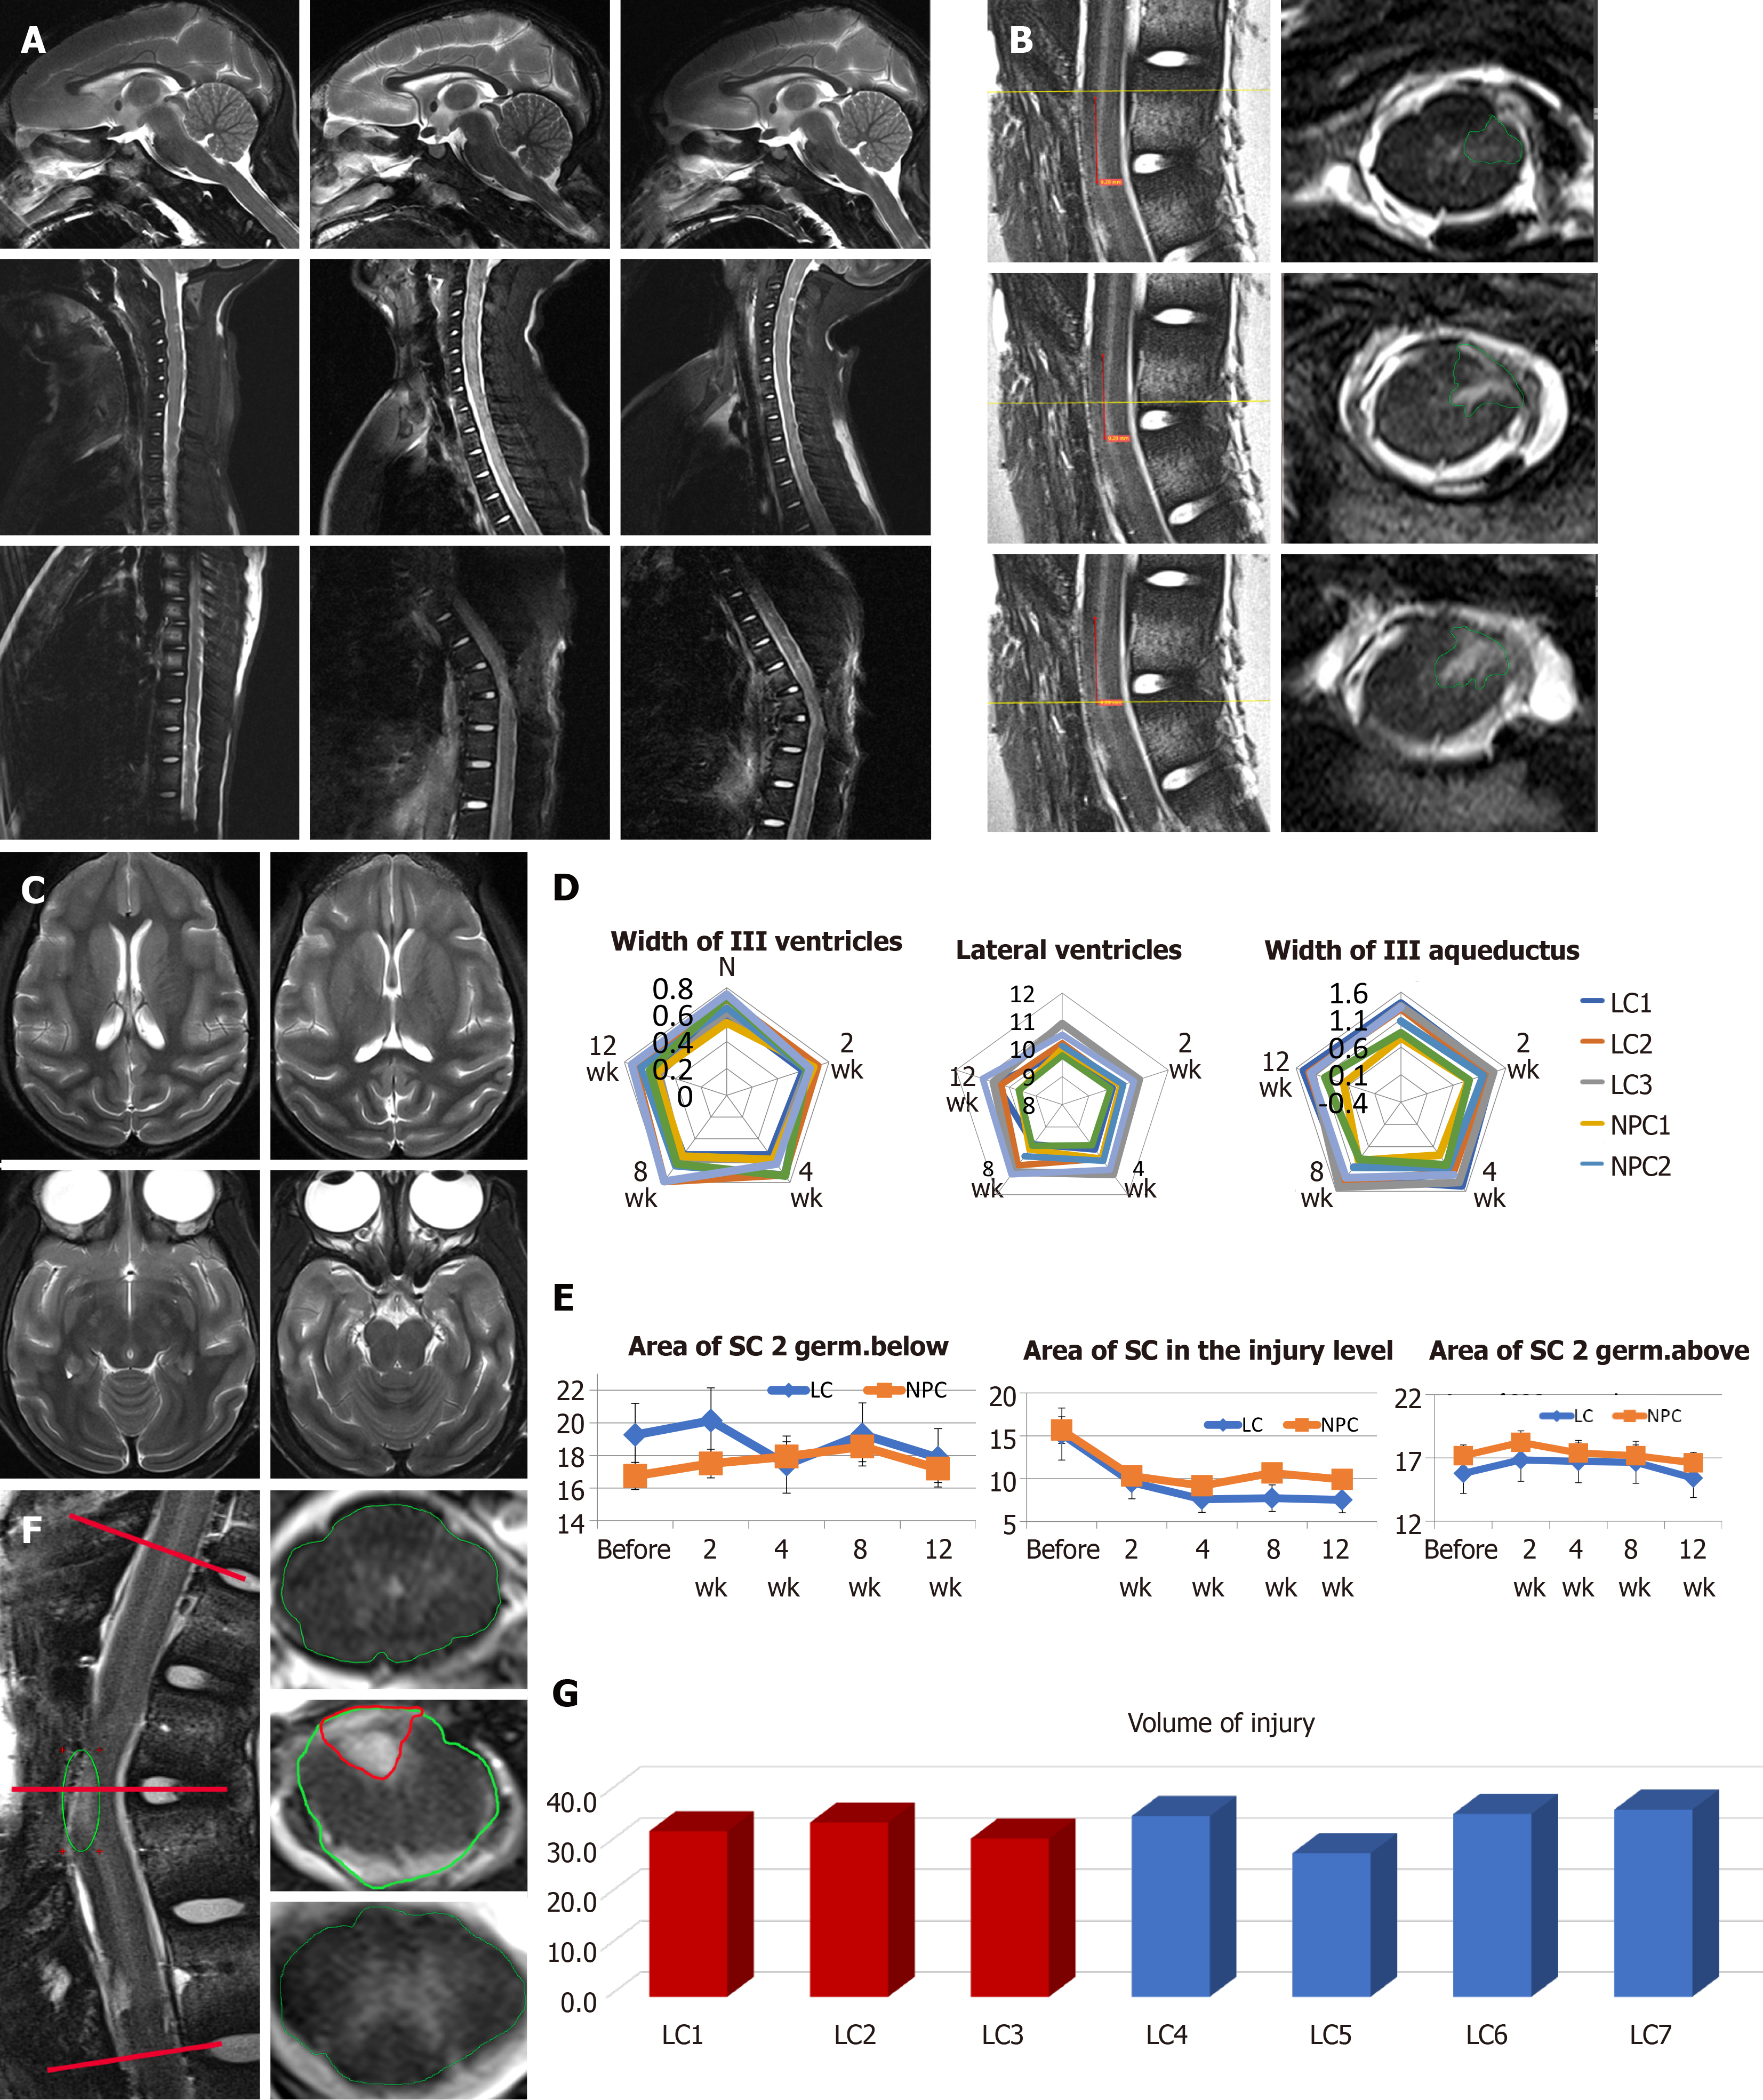
Figure 4 T2 weighted magnetic resonance imaging and the results of the brain and spinal cord morphometry.
A: Sagittal sections of the brain and the cervical and thoracic spinal cord of animal NPC1 before the lesion (left column), 2 wk after the lesion, just before the transplantation (middle column) and 12 wk after the transplantation (right column). The site of the injury is shown by white arrows; B: Postmortem high-resolution magnetic resonance diffusion tensor imaging of the spinal cord of animal NPC1. Left column: sagittal sections, right column: coronal sections from the upper part, middle part, and lower part of the injury (from top to bottom). The projection planes of coronal sections shown by yellow lines on corresponding sagittal sections. The middle part of the injury was shown by green arrow; C: Coronal sections of the brain, animal NPC2; D: Morphometry of the brain ventricles monitored 12 wk after the transplantation in animals of the lesion control (LC) group and neural progenitor cell (NPC) group; E: Morphometry of the spinal cord area in the lesion site, and two segments above and below; F: The example of sagittal (left column) and coronal (right column) sections with highlighted spinal cord and injury areas. The projection planes of coronal sections shown by red lines of the sagittal one; G: The results of spinal cord lesion volume calculation at week 12.
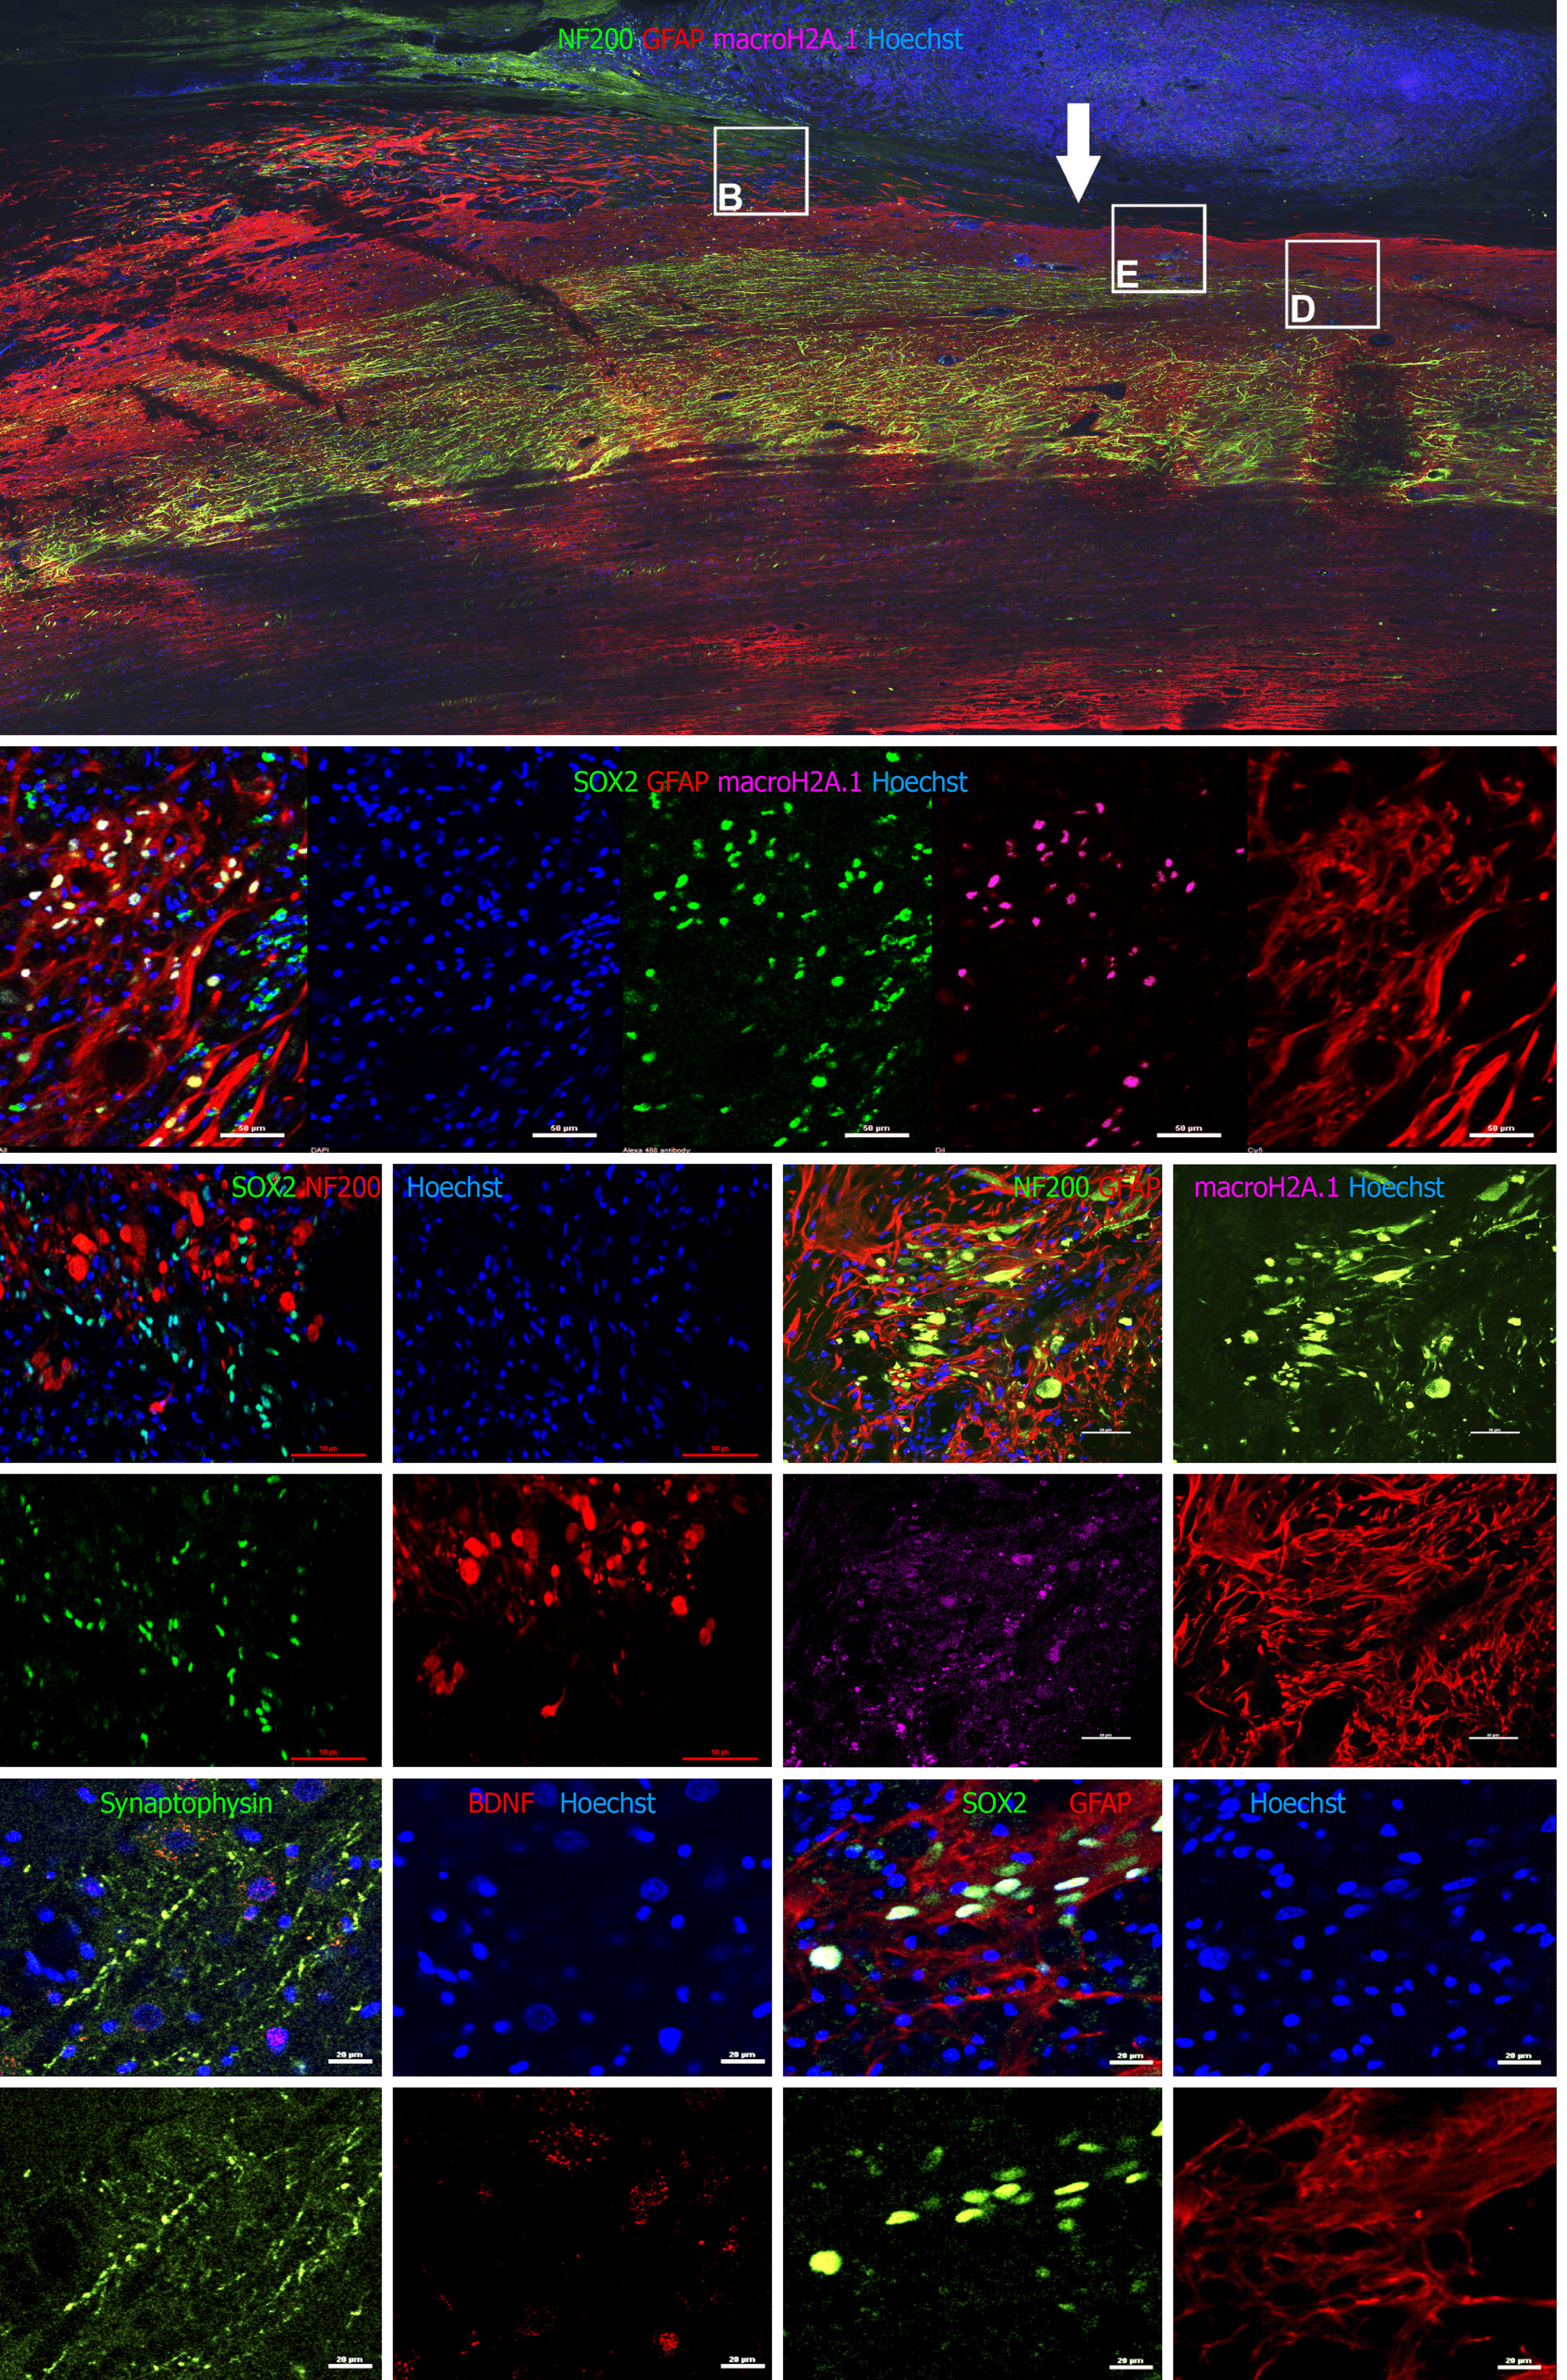
Figure 5 Immunohistochemical analysis on spinal cord sagittal sections 12 wk after transplantation.
A: Large image showing the center of injury (white arrow) of animal NPC1 stained with antibodies to NF200 (green) glial fibrillary acidic protein (GFAP) (red) and macro H2A.1 (magenta; staining is visible only in enlarged panels). Squares show approximate localization of enlarged panels B, D, and E (B and E stained with different antibody cocktails); B: Enlarged fragment of a sagittal section of animal NPC 1 stained for SRY-box transcription factor 2 (SOX2) (green), GFAP (red) and macro-H2A.1 (magenta). SOX2 and macro H2A.1 colocalized in the same cells (Pearson correlation = 0.78); C: Enlarged fragment of sagittal section of animal NPC4 stained for NF200 (red) and SOX2 (green). NF200 and SOX2 did not colocalize (Pearson correlation = 0.20); D: Enlarged fragment of sagittal section stained for NF200 (green, growth cones are shown), GFAP (red, astrogliosis area), and macro H2A.1 (magenta), animal NPC1. NF200 and macro H2A.1 did not colocalize (Pearson correlation = 0.20); E: Enlarged fragment of sagittal section stained for synaptophysin (green) and brain derived neurotrophic factor (red), animal NPC1; F: A sagittal section of animal NPC4 spinal cord near the injury epicenter stained for SOX2 (green) and GFAP (red). Size bar 50 µm (A-D), and 2 µm (E-F).
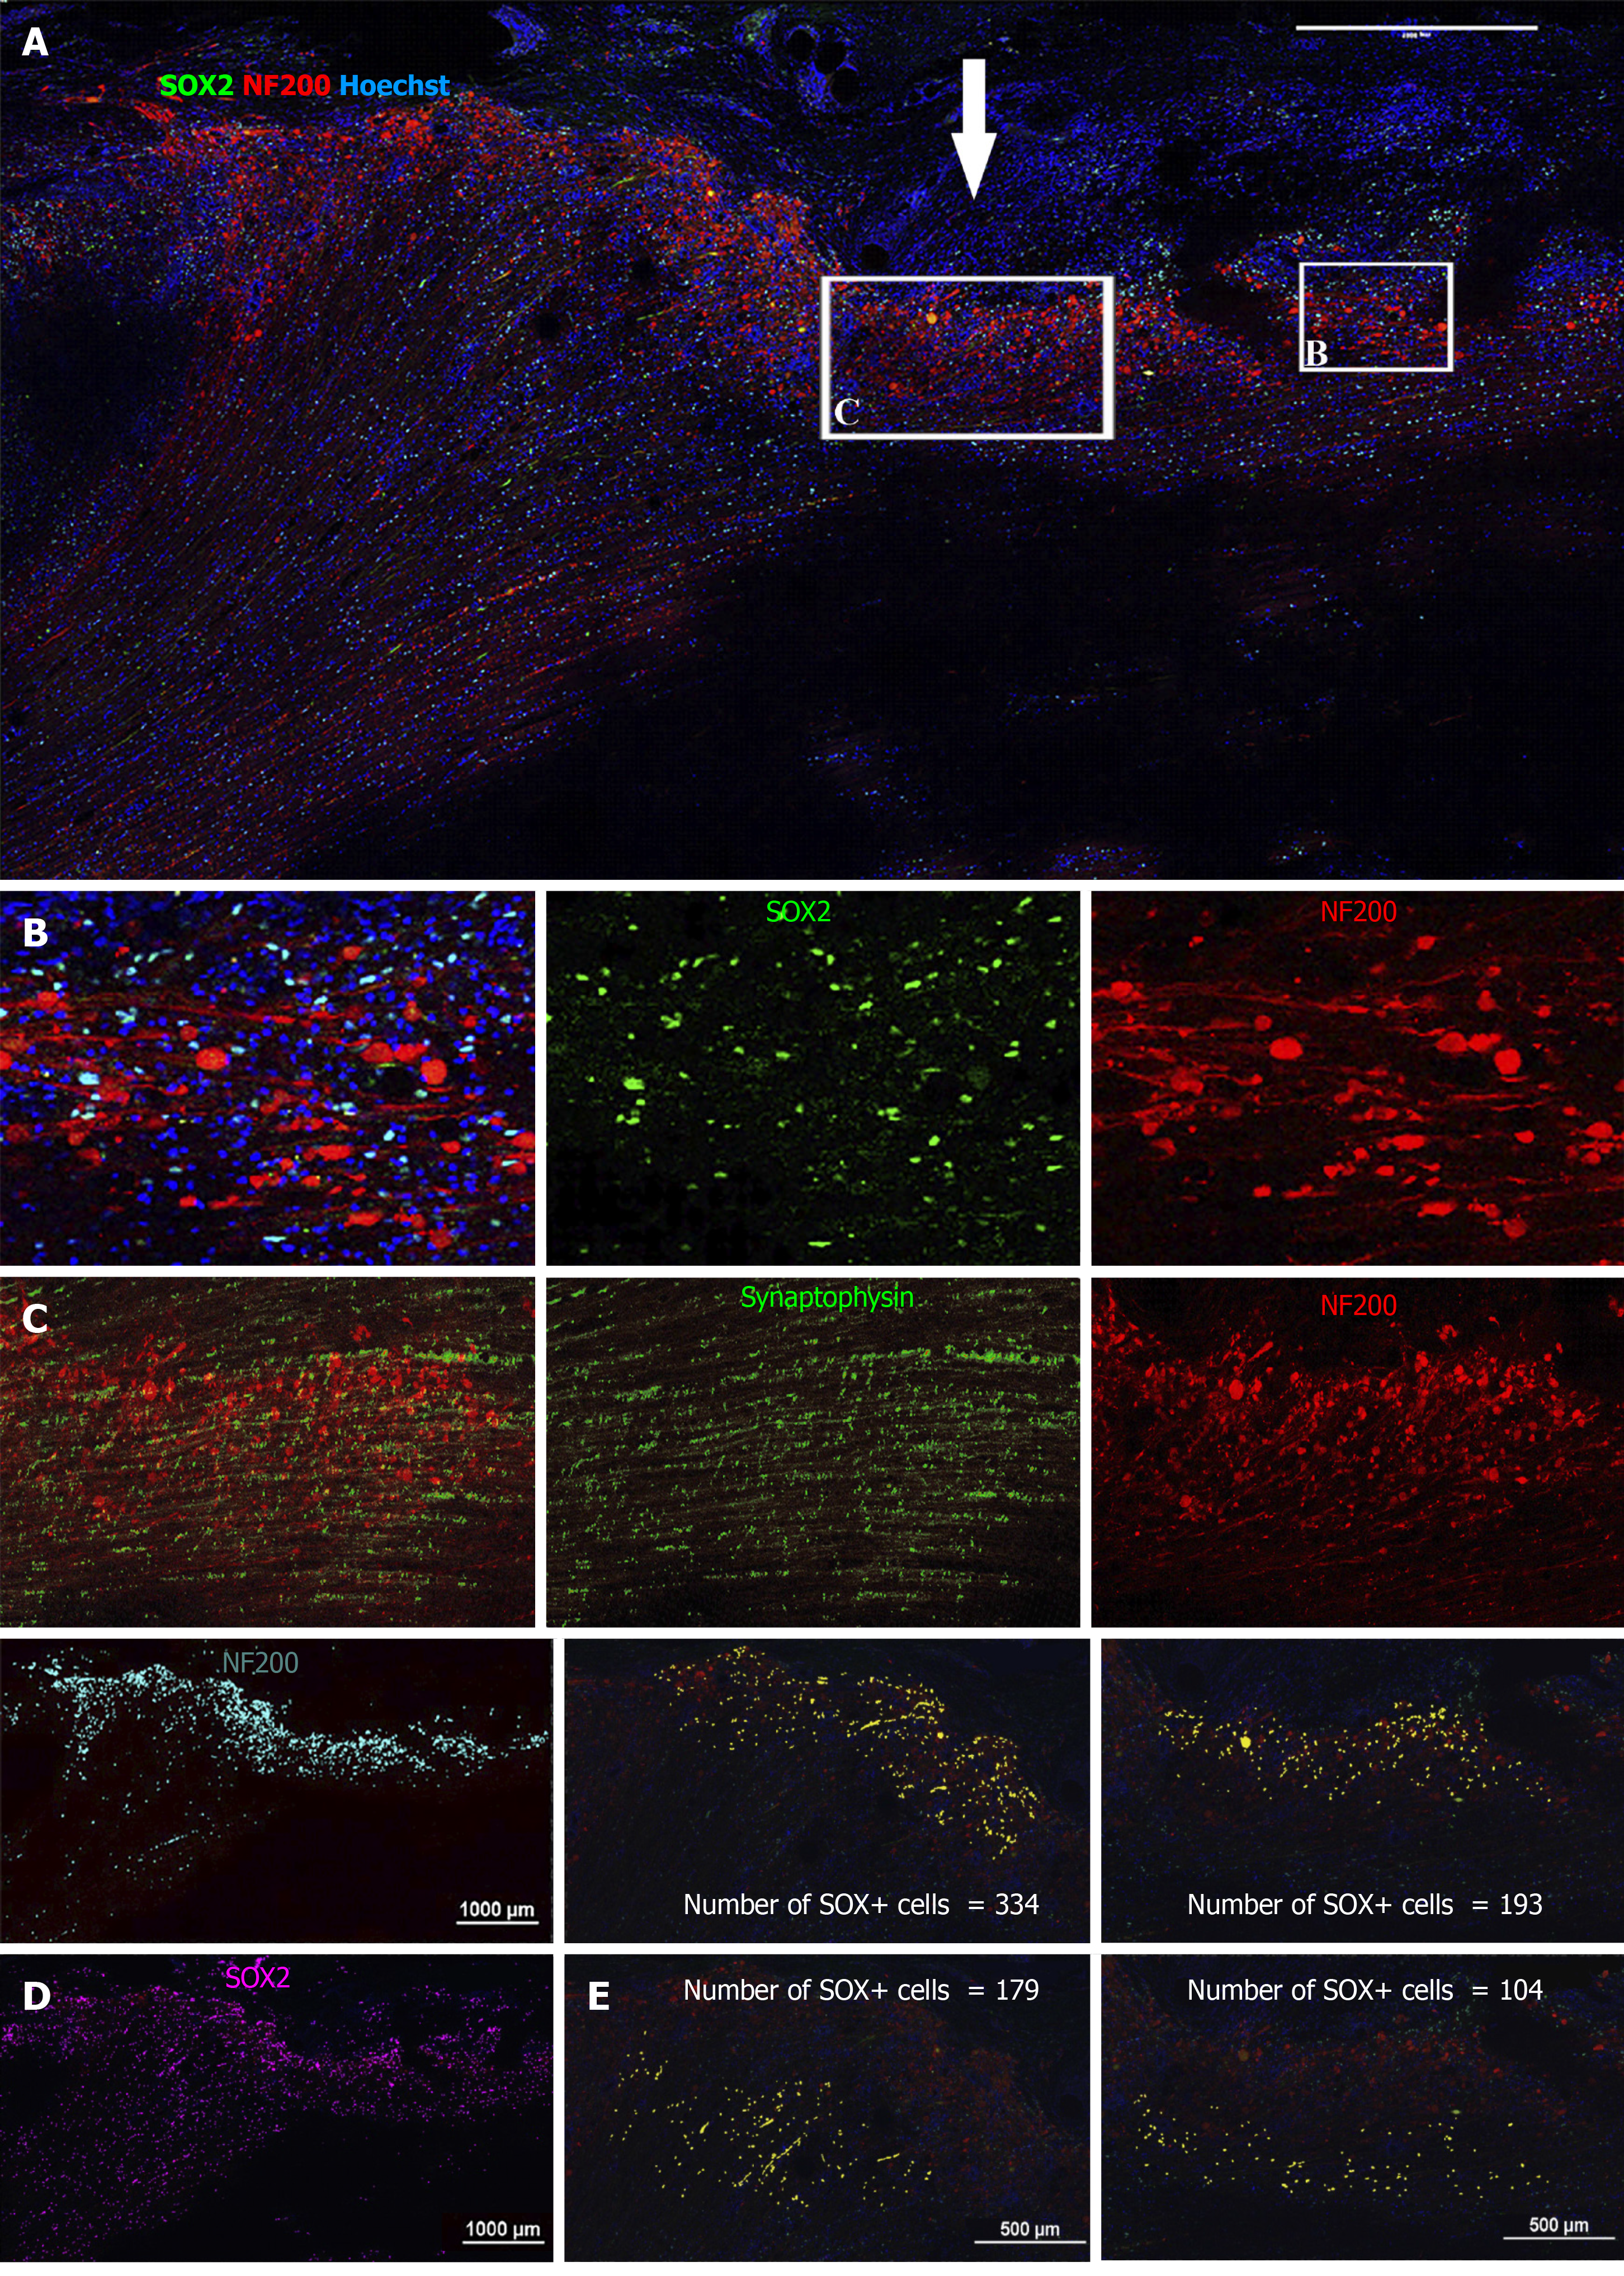
Figure 6 Immunohistochemical analysis of NF200 and SRY-box transcription factor 2 on spinal cord sagittal sections 12 wk after transplantation (animal NPC4).
A: Large image showing the center of injury (arrow). Squares show approximate localization of enlarged panels B and C; B: Enlarged image of SRY-box transcription factor 2 (SOX2) (green) and NF200 (red) staining; C: Enlarged image of synaptophysin (green) and NF200 (red) staining; D: The results of quantification of NF200 (blue) and SOX2 (magenta); binary selection; and E: Upper images: yellow dots-number of SOX2-positive cells in the high intensity zone of NF200 fluorescence (area of growth cones); Lower images: yellow dots-number of SOX2-positive cells in the low intensity zone of NF200 fluorescence. Bar size 500–1000 µm.
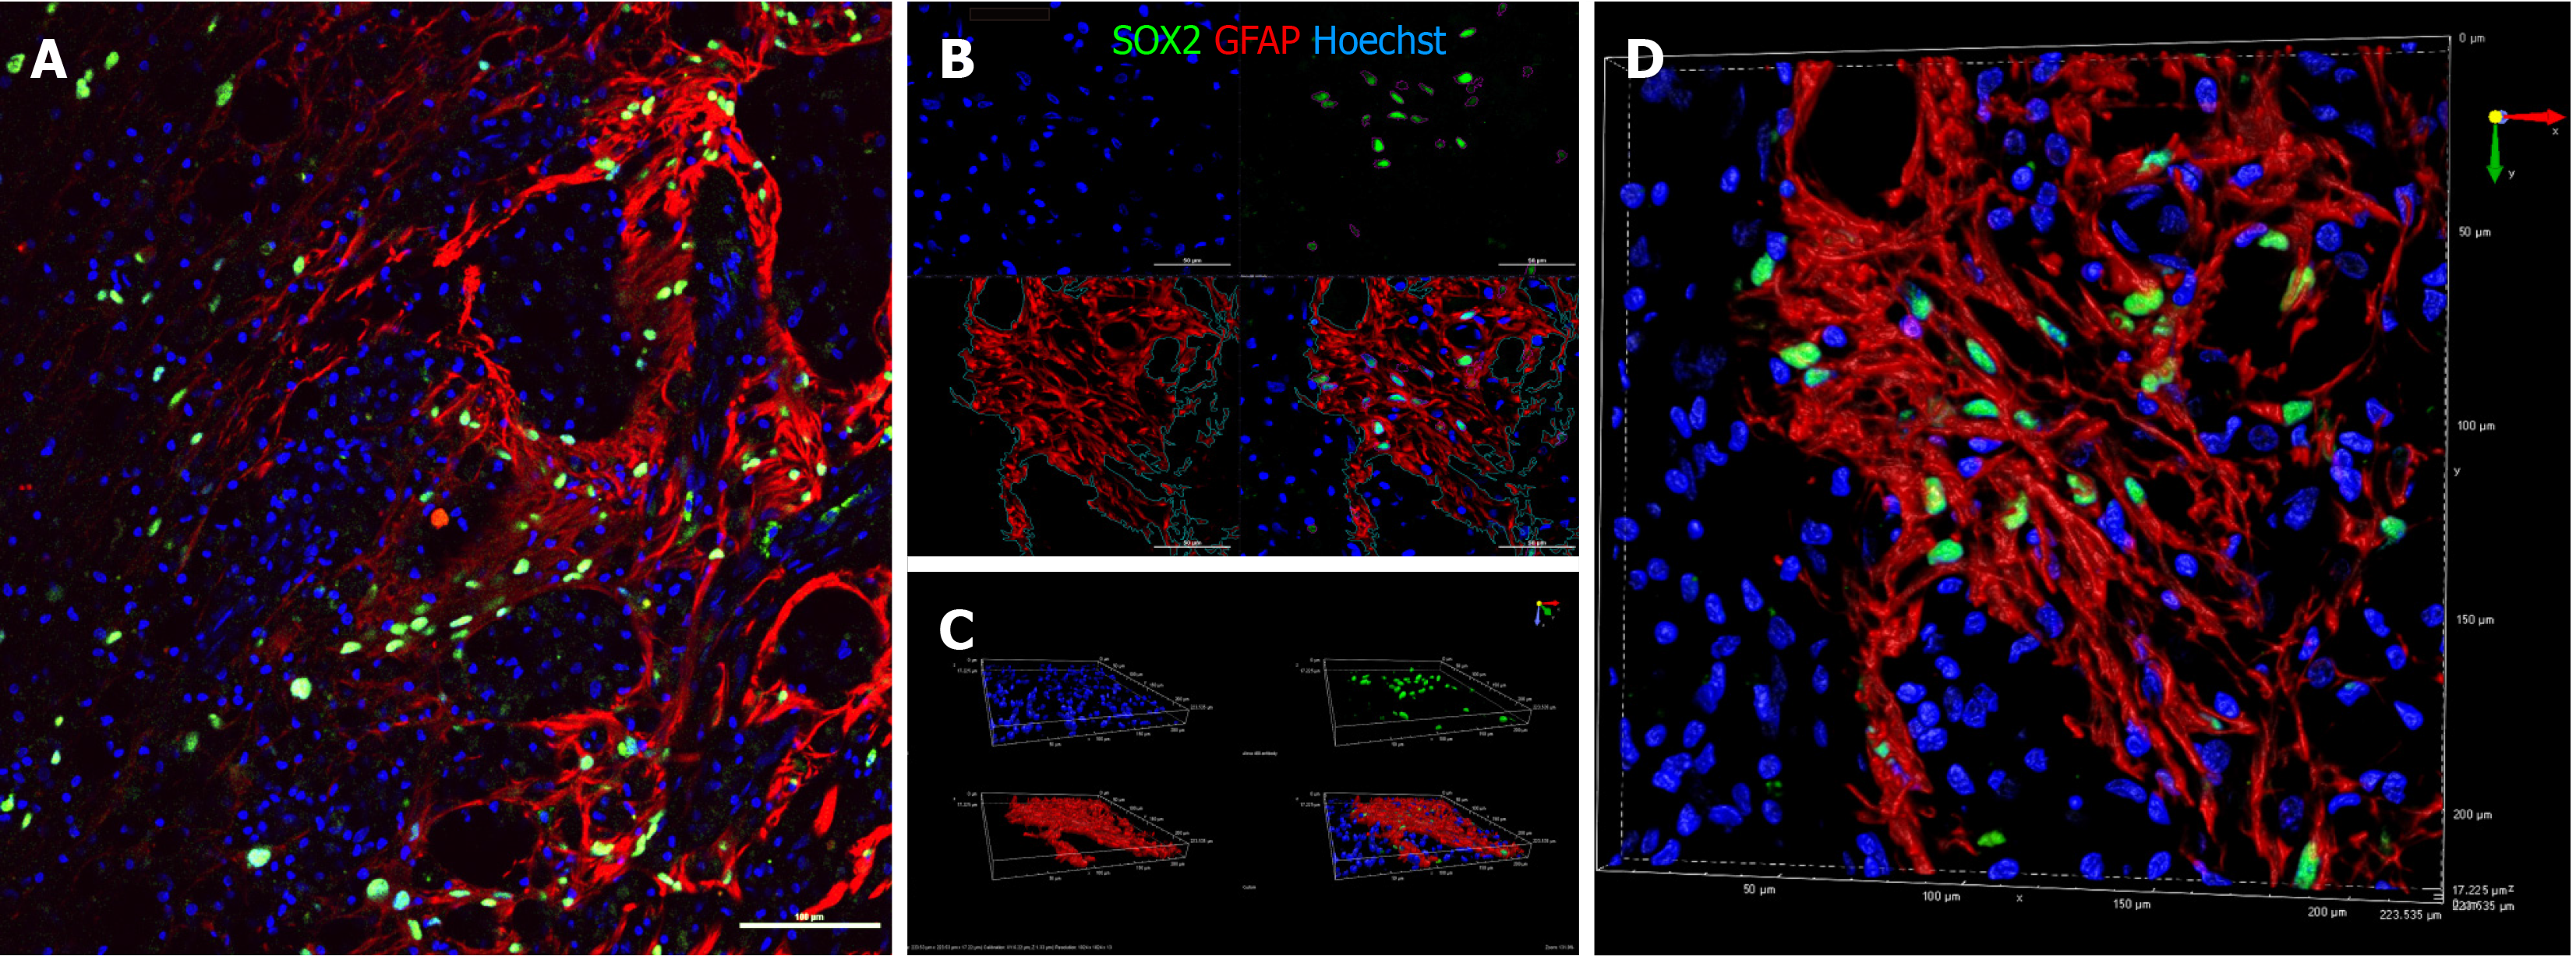
Figure 7 Immunohistochemical analysis of SRY-box transcription factor 2 (green) and glial fibrillary acidic protein (red) on sagittal sections of animal NPC4 spinal cord.
A: Large image showing that in the site of astrogliosis SRY-box transcription factor 2 (SOX2)-positive cells predominantly localized along glial fibrillary acidic protein (GFAP)-positive processes; B and C: Three dimensional reconstruction revealed that SOX2 was not expressed by GFAP positive cells; and D: High resolution three dimensional reconstruction. Arrows show the GFAP-positive processes, surrounding SOX2-positive cells. Bar size 100 µm.
- Citation: Baklaushev VP, Durov OV, Kalsin VA, Gulaev EV, Kim SV, Gubskiy IL, Revkova VA, Samoilova EM, Melnikov PA, Karal-Ogly DD, Orlov SV, Troitskiy AV, Chekhonin VP, Averyanov AV, Ahlfors JE. Disease modifying treatment of spinal cord injury with directly reprogrammed neural precursor cells in non-human primates. World J Stem Cells 2021; 13(5): 452-469
- URL: https://www.wjgnet.com/1948-0210/full/v13/i5/452.htm
- DOI: https://dx.doi.org/10.4252/wjsc.v13.i5.452


