Copyright
©The Author(s) 2021.
World J Stem Cells. Dec 26, 2021; 13(12): 1928-1946
Published online Dec 26, 2021. doi: 10.4252/wjsc.v13.i12.1928
Published online Dec 26, 2021. doi: 10.4252/wjsc.v13.i12.1928
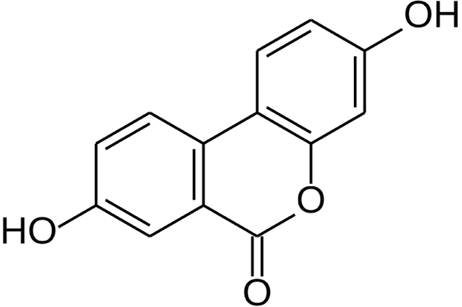
Figure 1 Chemical structure of Urolithin A.
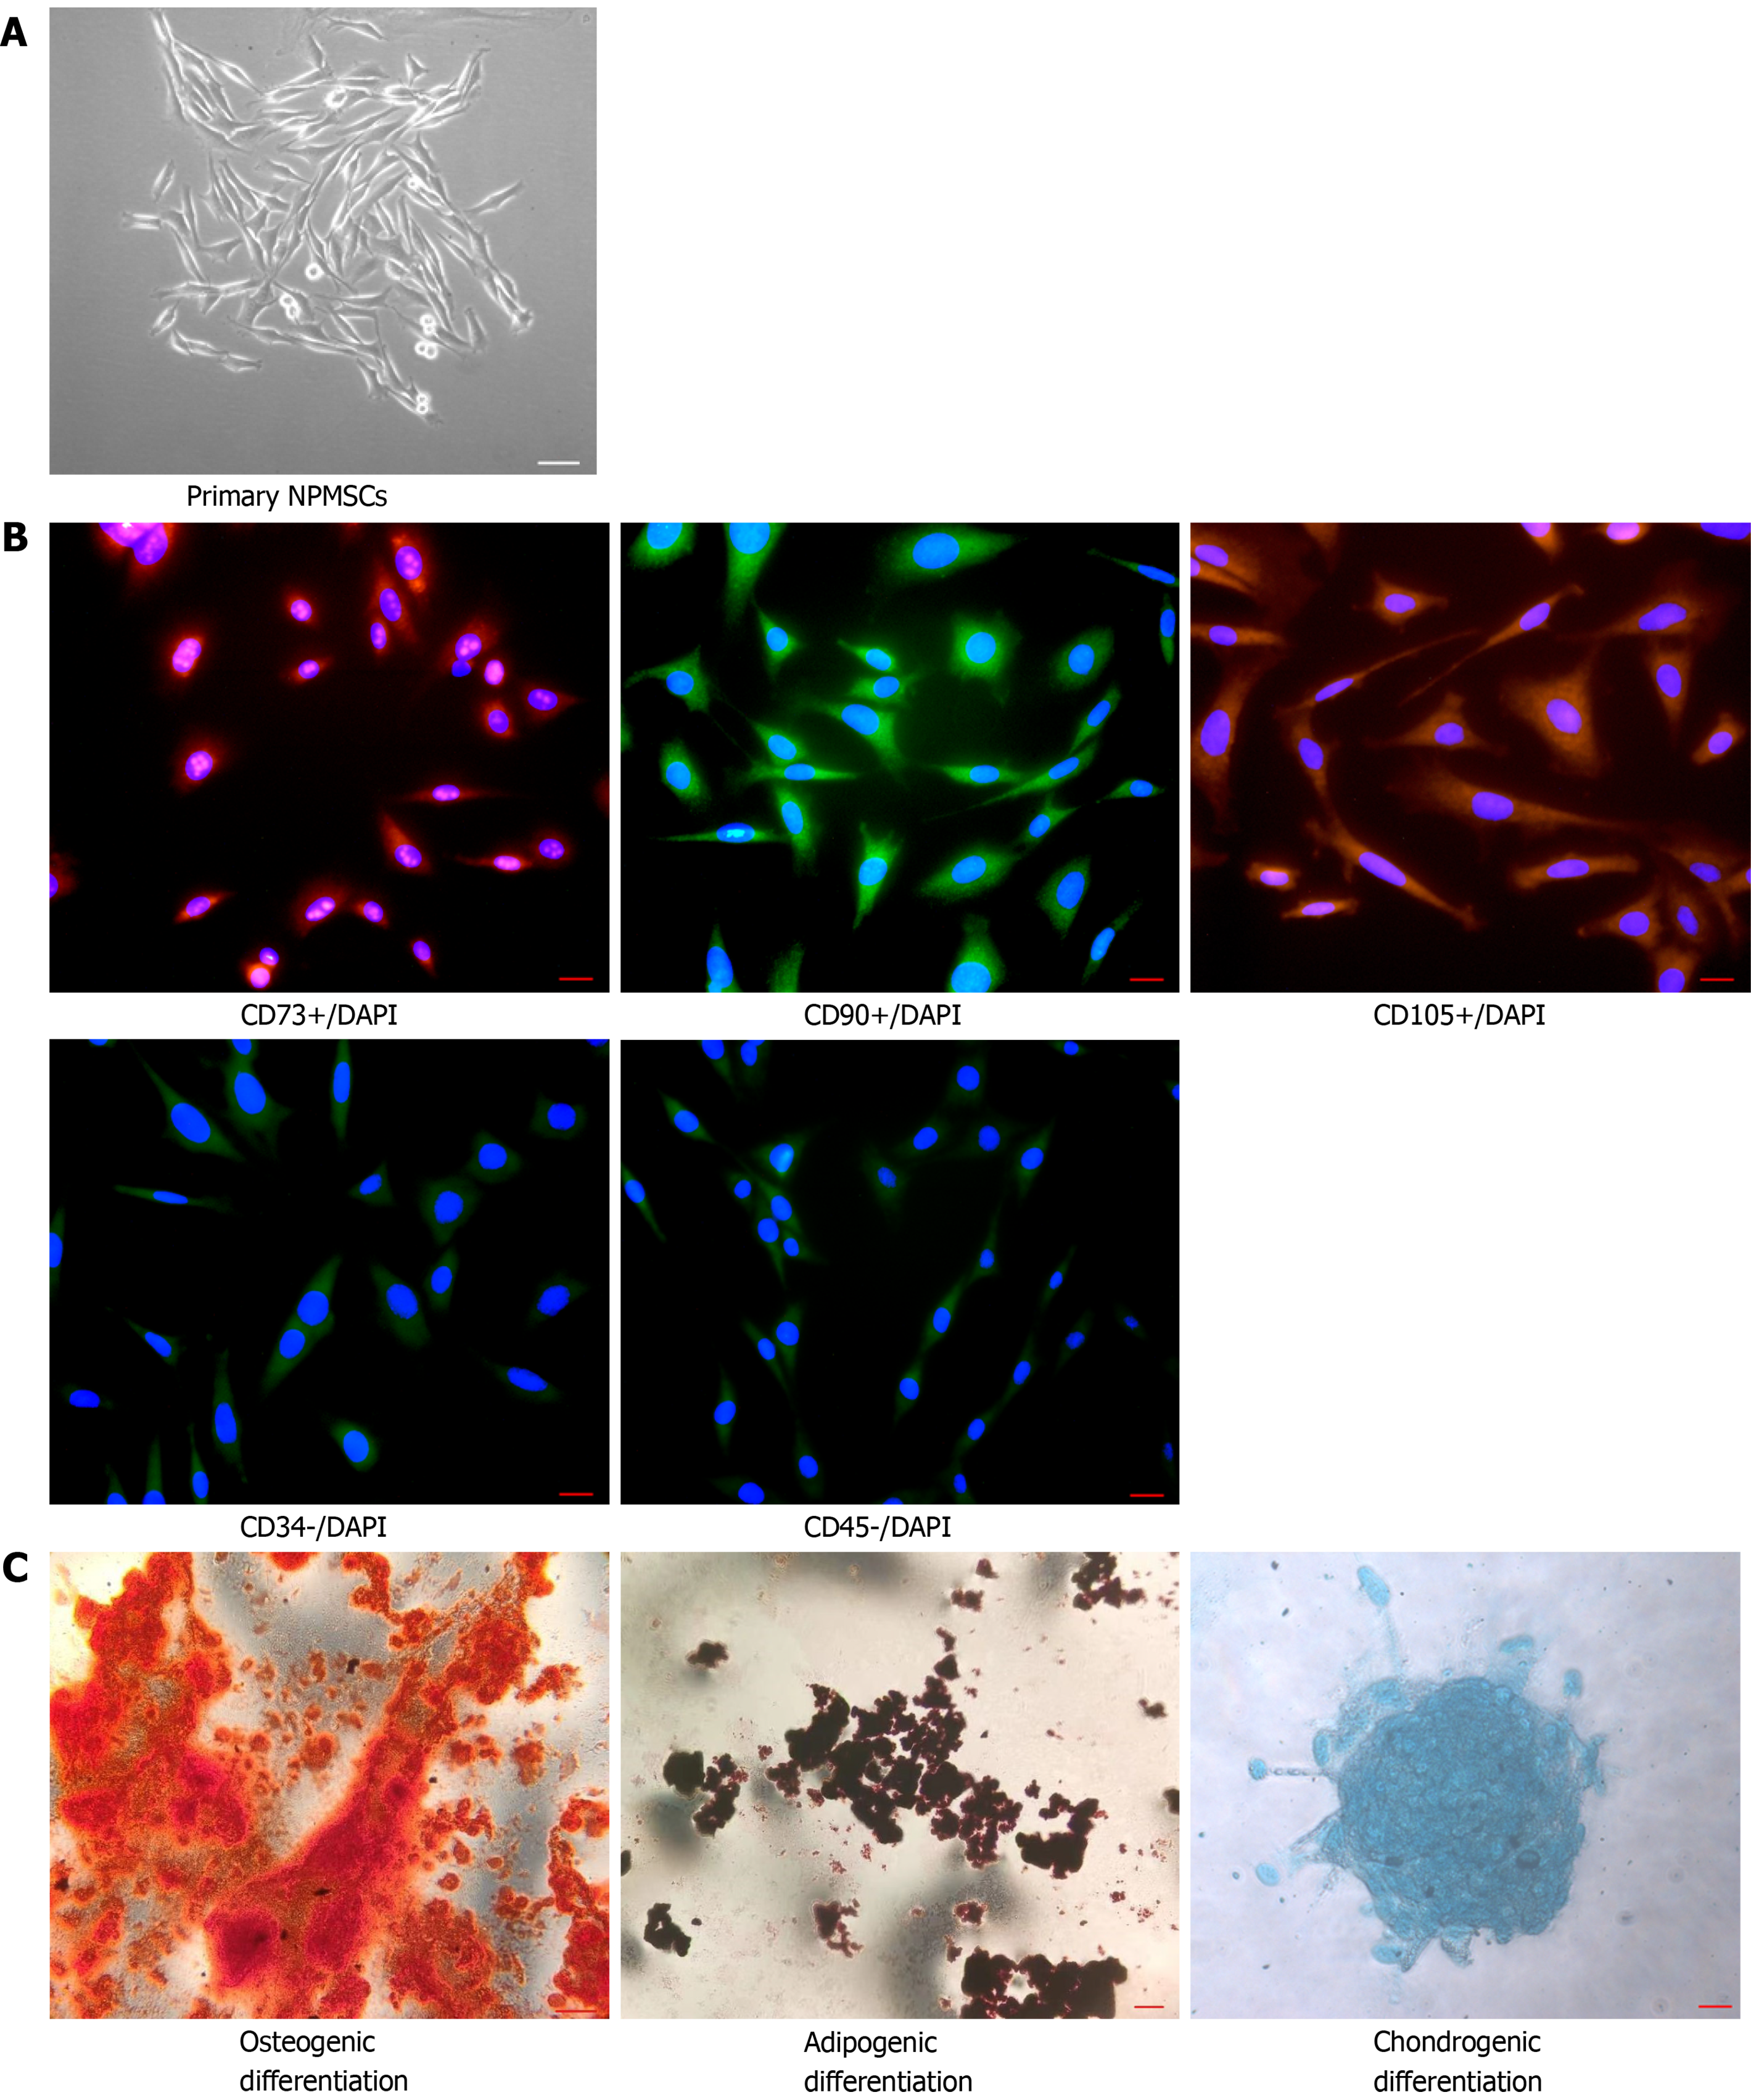
Figure 2 Identification of nucleus pulposus-derived mesenchymal stem cells.
A: Isolated primary cells presented with a long spindle shape and grew in flower formation; B: Nucleus pulposus-derived mesenchymal stem cells (NPMSCs) exhibited high fluorescent expression of CD73, CD90, and CD105, but low fluorescent expression of CD34 and CD45; C: NPMSCs was positive for Alizarin red, Oil Red O, and Alcian blue staining after induced differentiation. Scale bar = 50 μm. NPMSCs: Nucleus pulposus-derived mesenchymal stem cells.
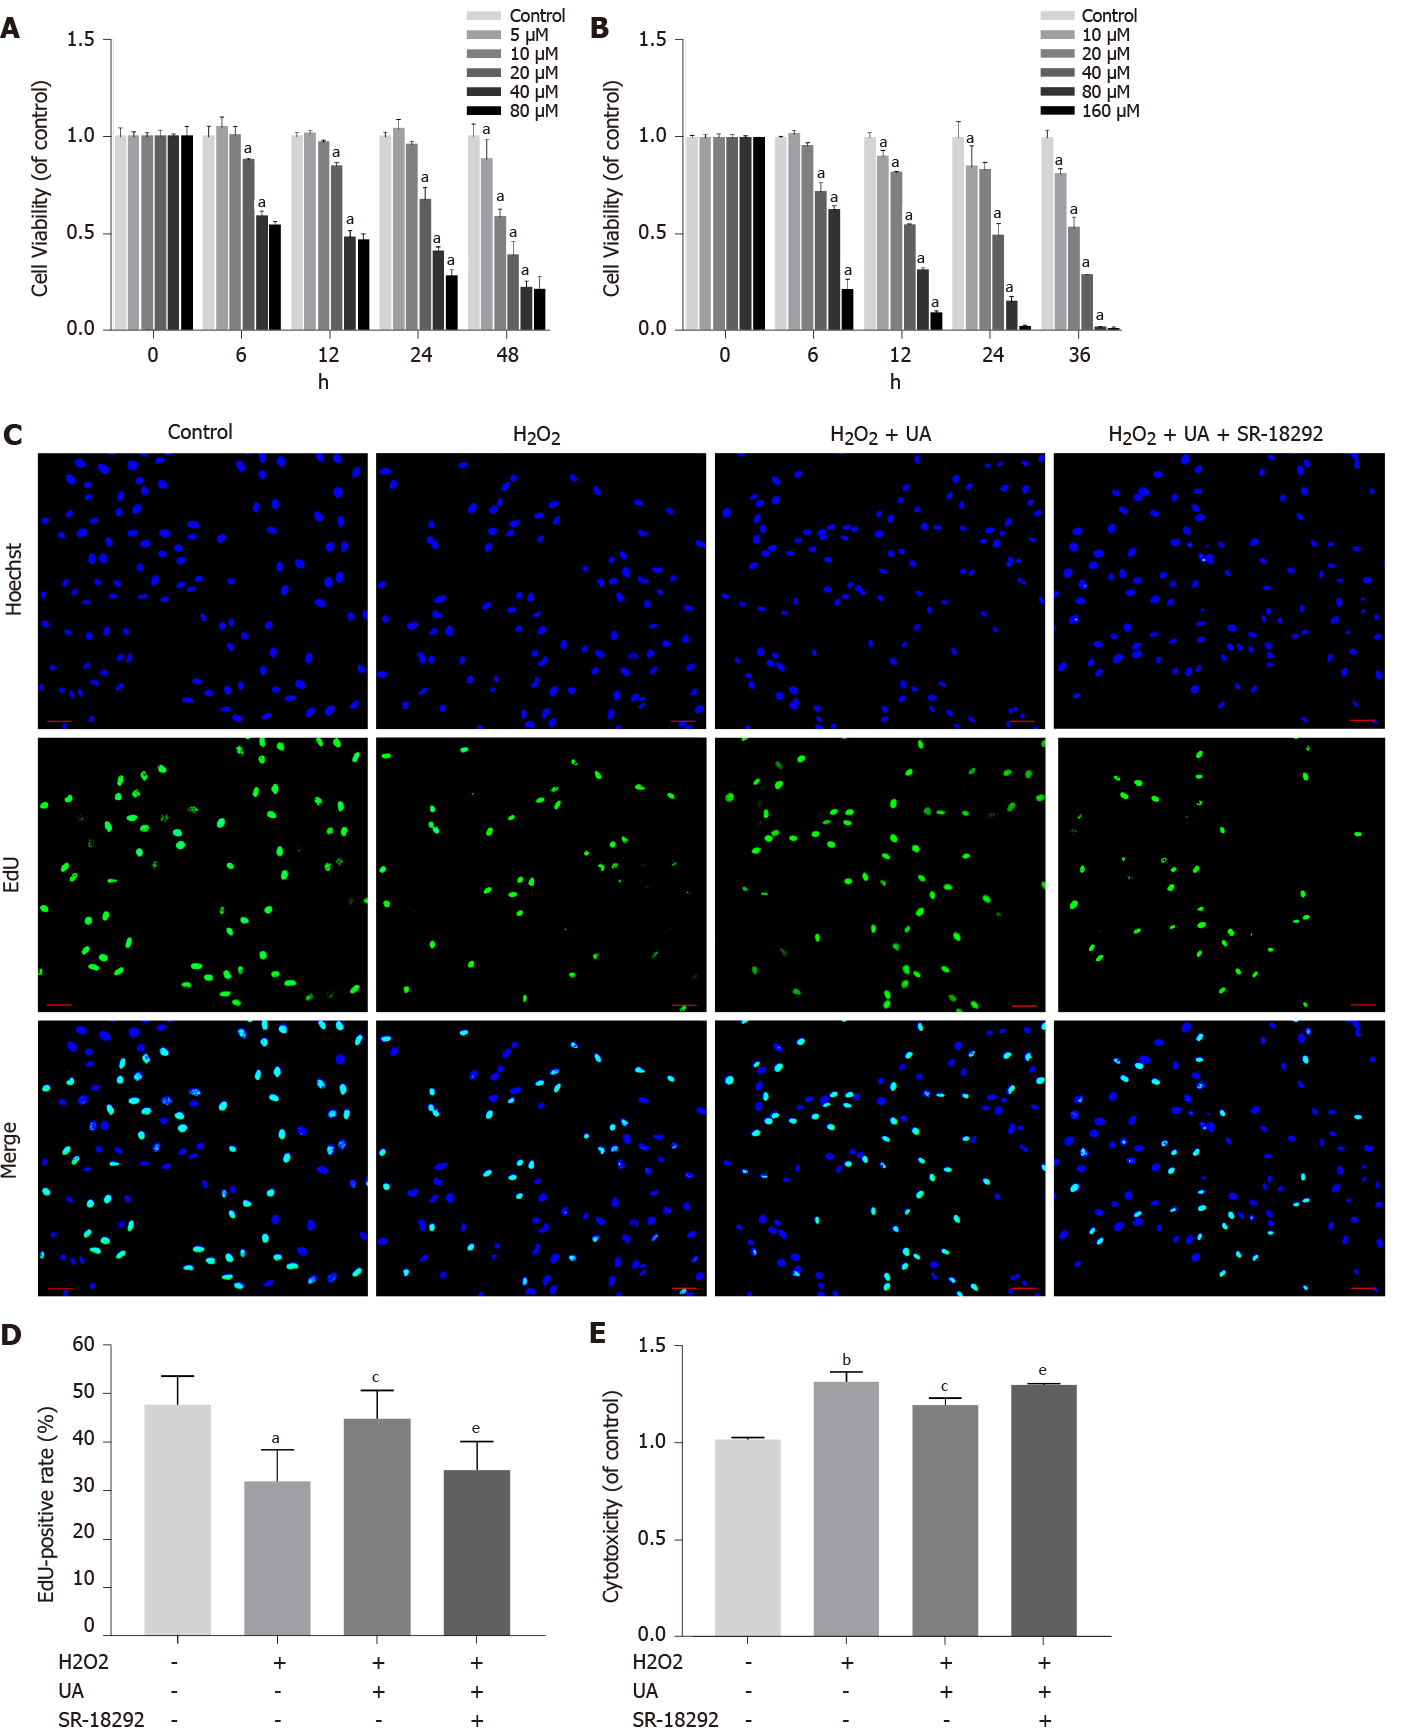
Figure 3 Cell viability assay, cell proliferation assay and cytotoxicity assay.
A: Cell counting kit-8 (CCK-8) results of nucleus pulposus-derived mesenchymal stem cells (NPMSCs) treated with different concentrations and times of urolithin A (UA); B: CCK-8 results of NPMSCs treated with different concentrations and times of SR-18292; C: EdU assay results of NPMSCs in different groups. Green fluorescence represents cells in a proliferating state, and blue fluorescence represents cell nucleus (scale bar = 25 μm); D: Quantitative analysis of EdU results; E: Cytotoxicity results of NPMSCs treated with H2O2, H2O2 + UA and H2O2 + UA + SR-18292. All data are expressed as the mean ± SD. aP < 0.05, bP < 0.01 compared with control group; cP < 0.05, dP < 0.01 compared with H2O2 group; eP < 0.05, fP < 0.01 compared with H2O2 + UA group. CCK-8: Cell counting kit-8; NPMSCs: Nucleus pulposus-derived mesenchymal stem cells; UA: Urolithin A.
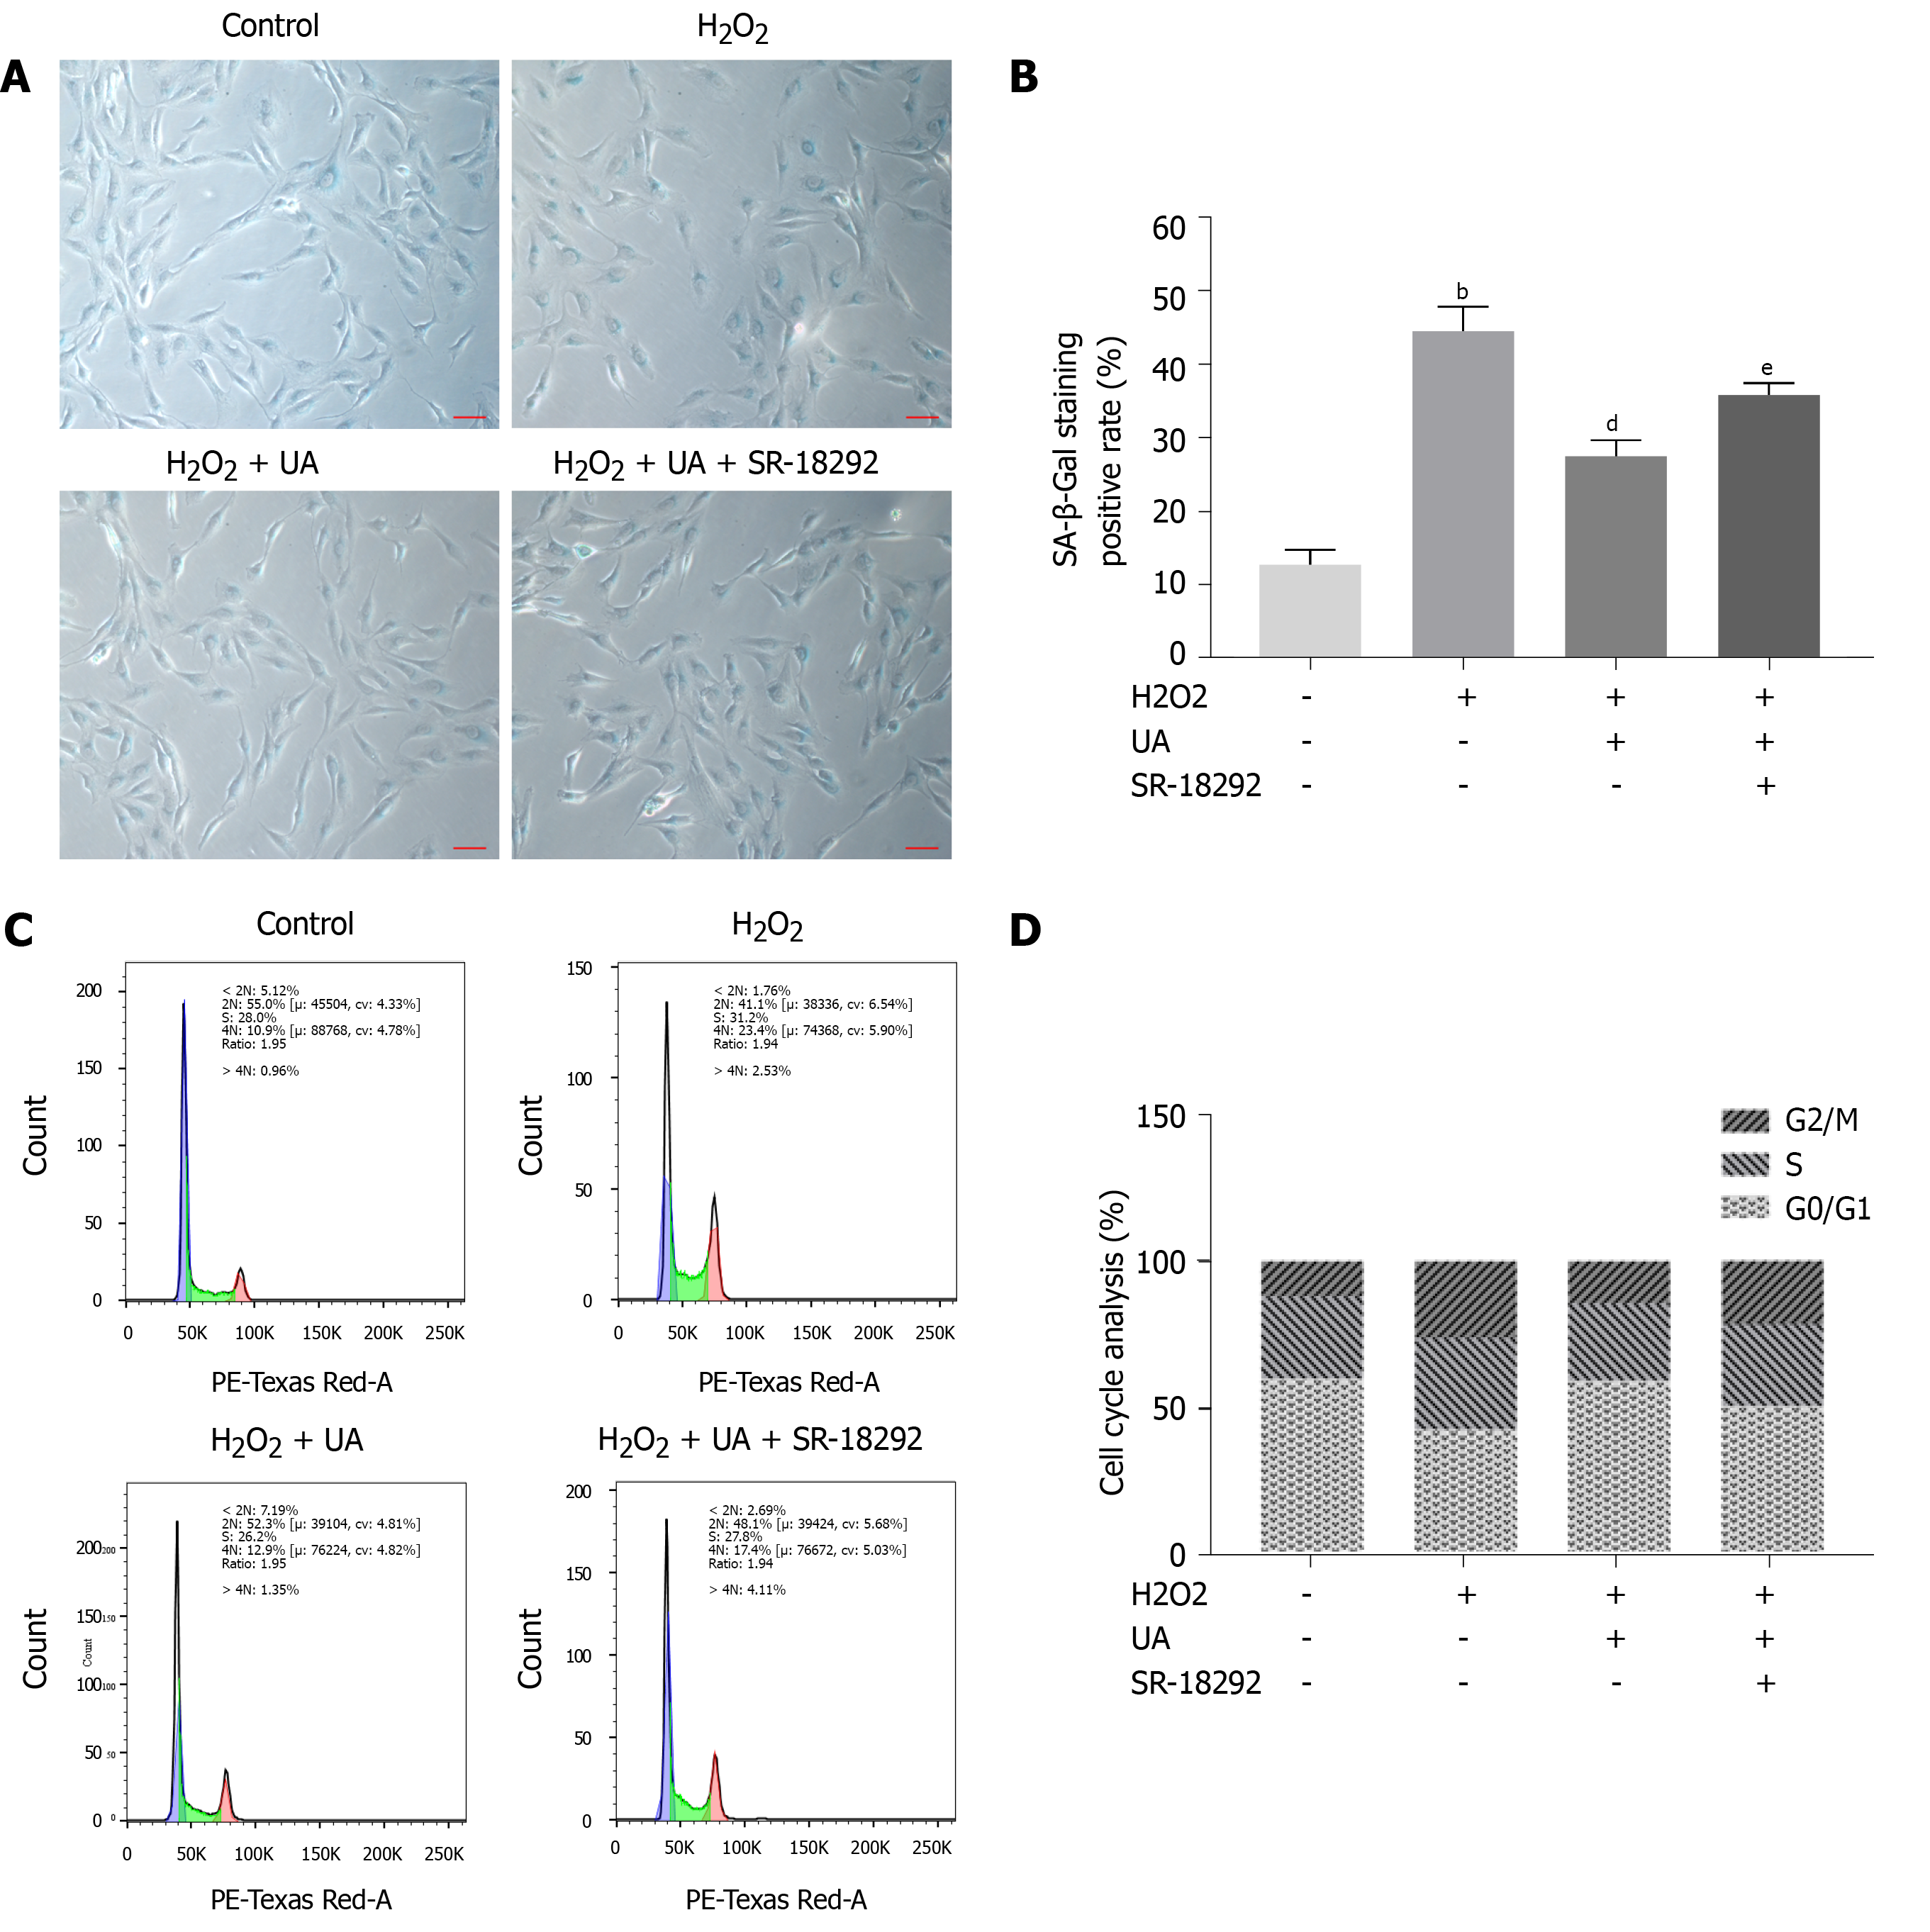
Figure 4 Senescence-associated β-Galactosidase staining assay and cell cycle assay.
A: Senescence-associated β-Galactosidase (SA-β-Gal) staining results of nucleus pulposus-derived mesenchymal stem cells (NPMSCs) in different groups. Senescent cells exhibit blue-stained high expression of SA-β-Gal. (scale bar = 25 μm); B: Quantitative analysis of SA-β-Gal staining results; C: Cell cycle results of NPMSCs in different groups; D: Quantitative analysis of cell cycle results. All data are expressed as the mean ± SD. aP < 0.05, bP < 0.01 compared with control group; cP < 0.05, dP < 0.01 compared with H2O2 group; eP < 0.05, fP < 0.01 compared with H2O2 + UA group. SA-β-Gal: Senescence-associated β-Galactosidase; NPMSCs: Nucleus pulposus-derived mesenchymal stem cells; UA: Urolithin A.
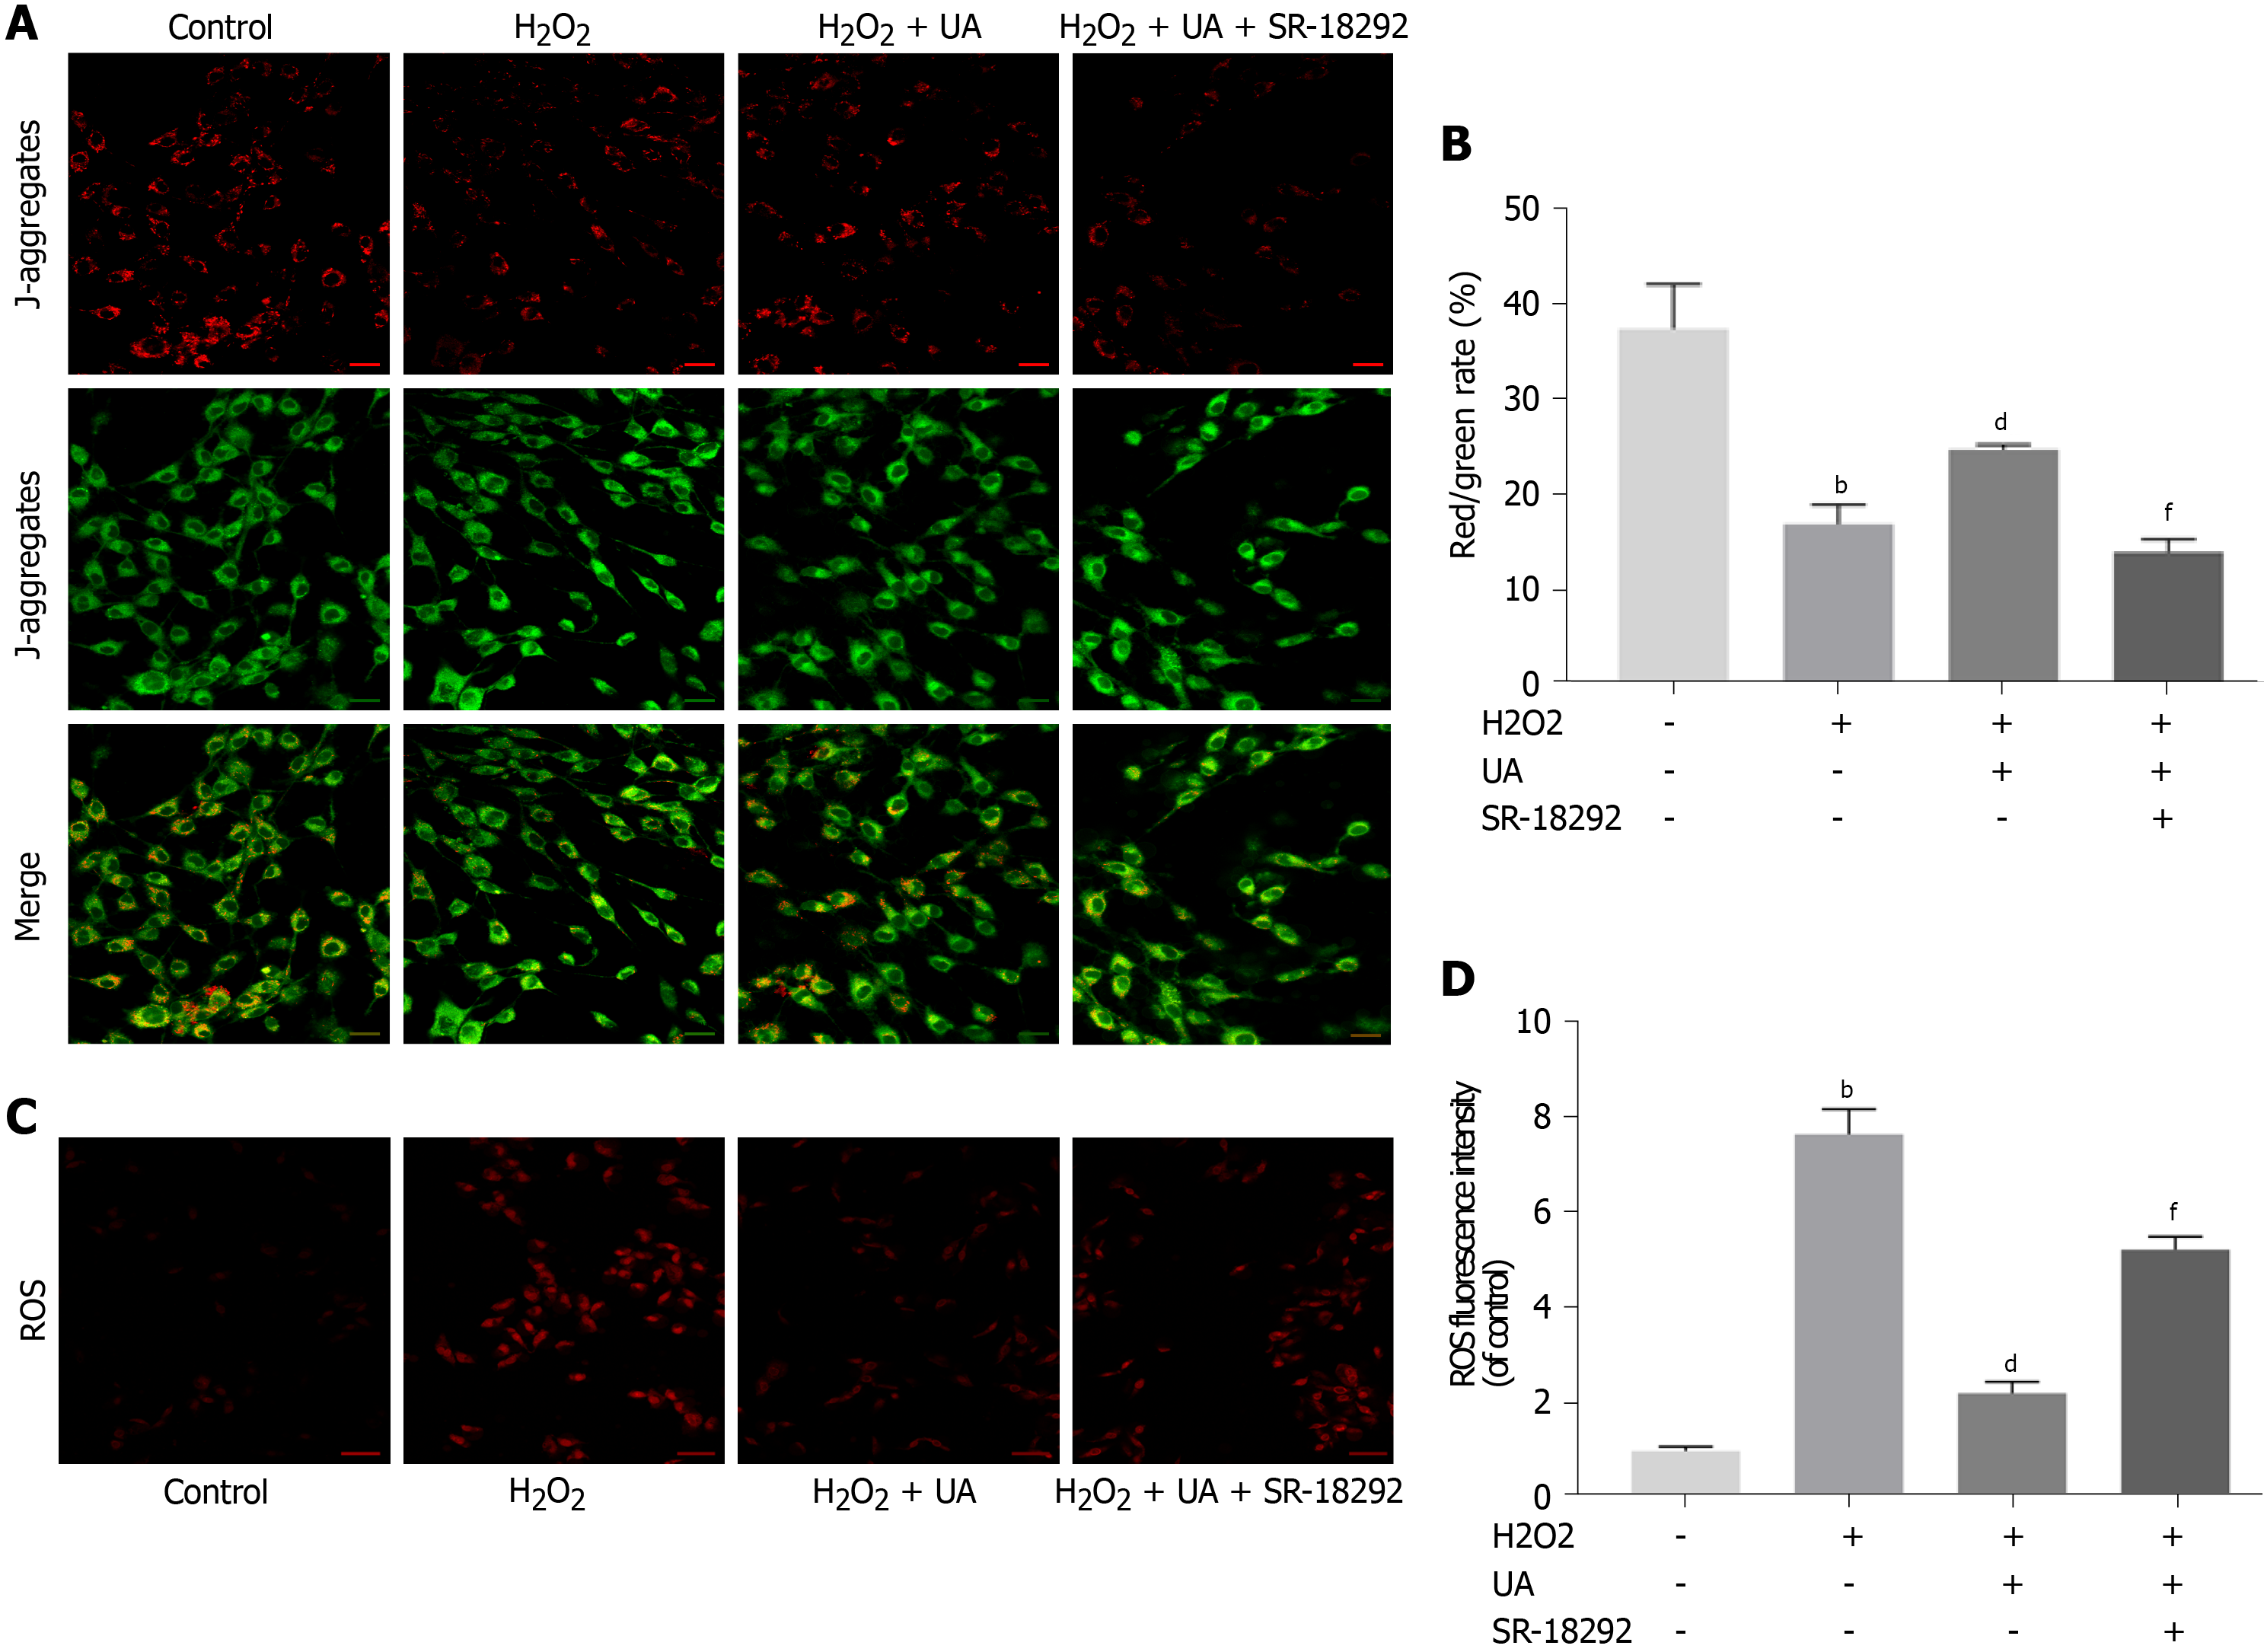
Figure 5 Mitochondrial membrane potential assay and reactive oxygen species assay.
A: Results of mitochondrial membrane potential (MMP) in different groups detected by fluorescence. Red fluorescence represents the mitochondrial aggregate JC-1 and green fluorescence indicates the monomeric JC-1 (scale bar = 50 μm); B: Quantitative analysis of MMP results; C: Results of reactive oxygen species (ROS) in different groups detected by fluorescence. Red fluorescence represents high level of ROS (scale bar = 50 μm); D: Quantitative analysis of ROS results. All data are expressed as the mean ± SD. aP < 0.05, bP < 0.01 compared with control group; cP < 0.05, dP < 0.01 compared with H2O2 group; eP < 0.05, fP < 0.01 compared with H2O2 + UA group. MMP: Mitochondrial membrane potential; ROS: Reactive oxygen species; UA: Urolithin A.
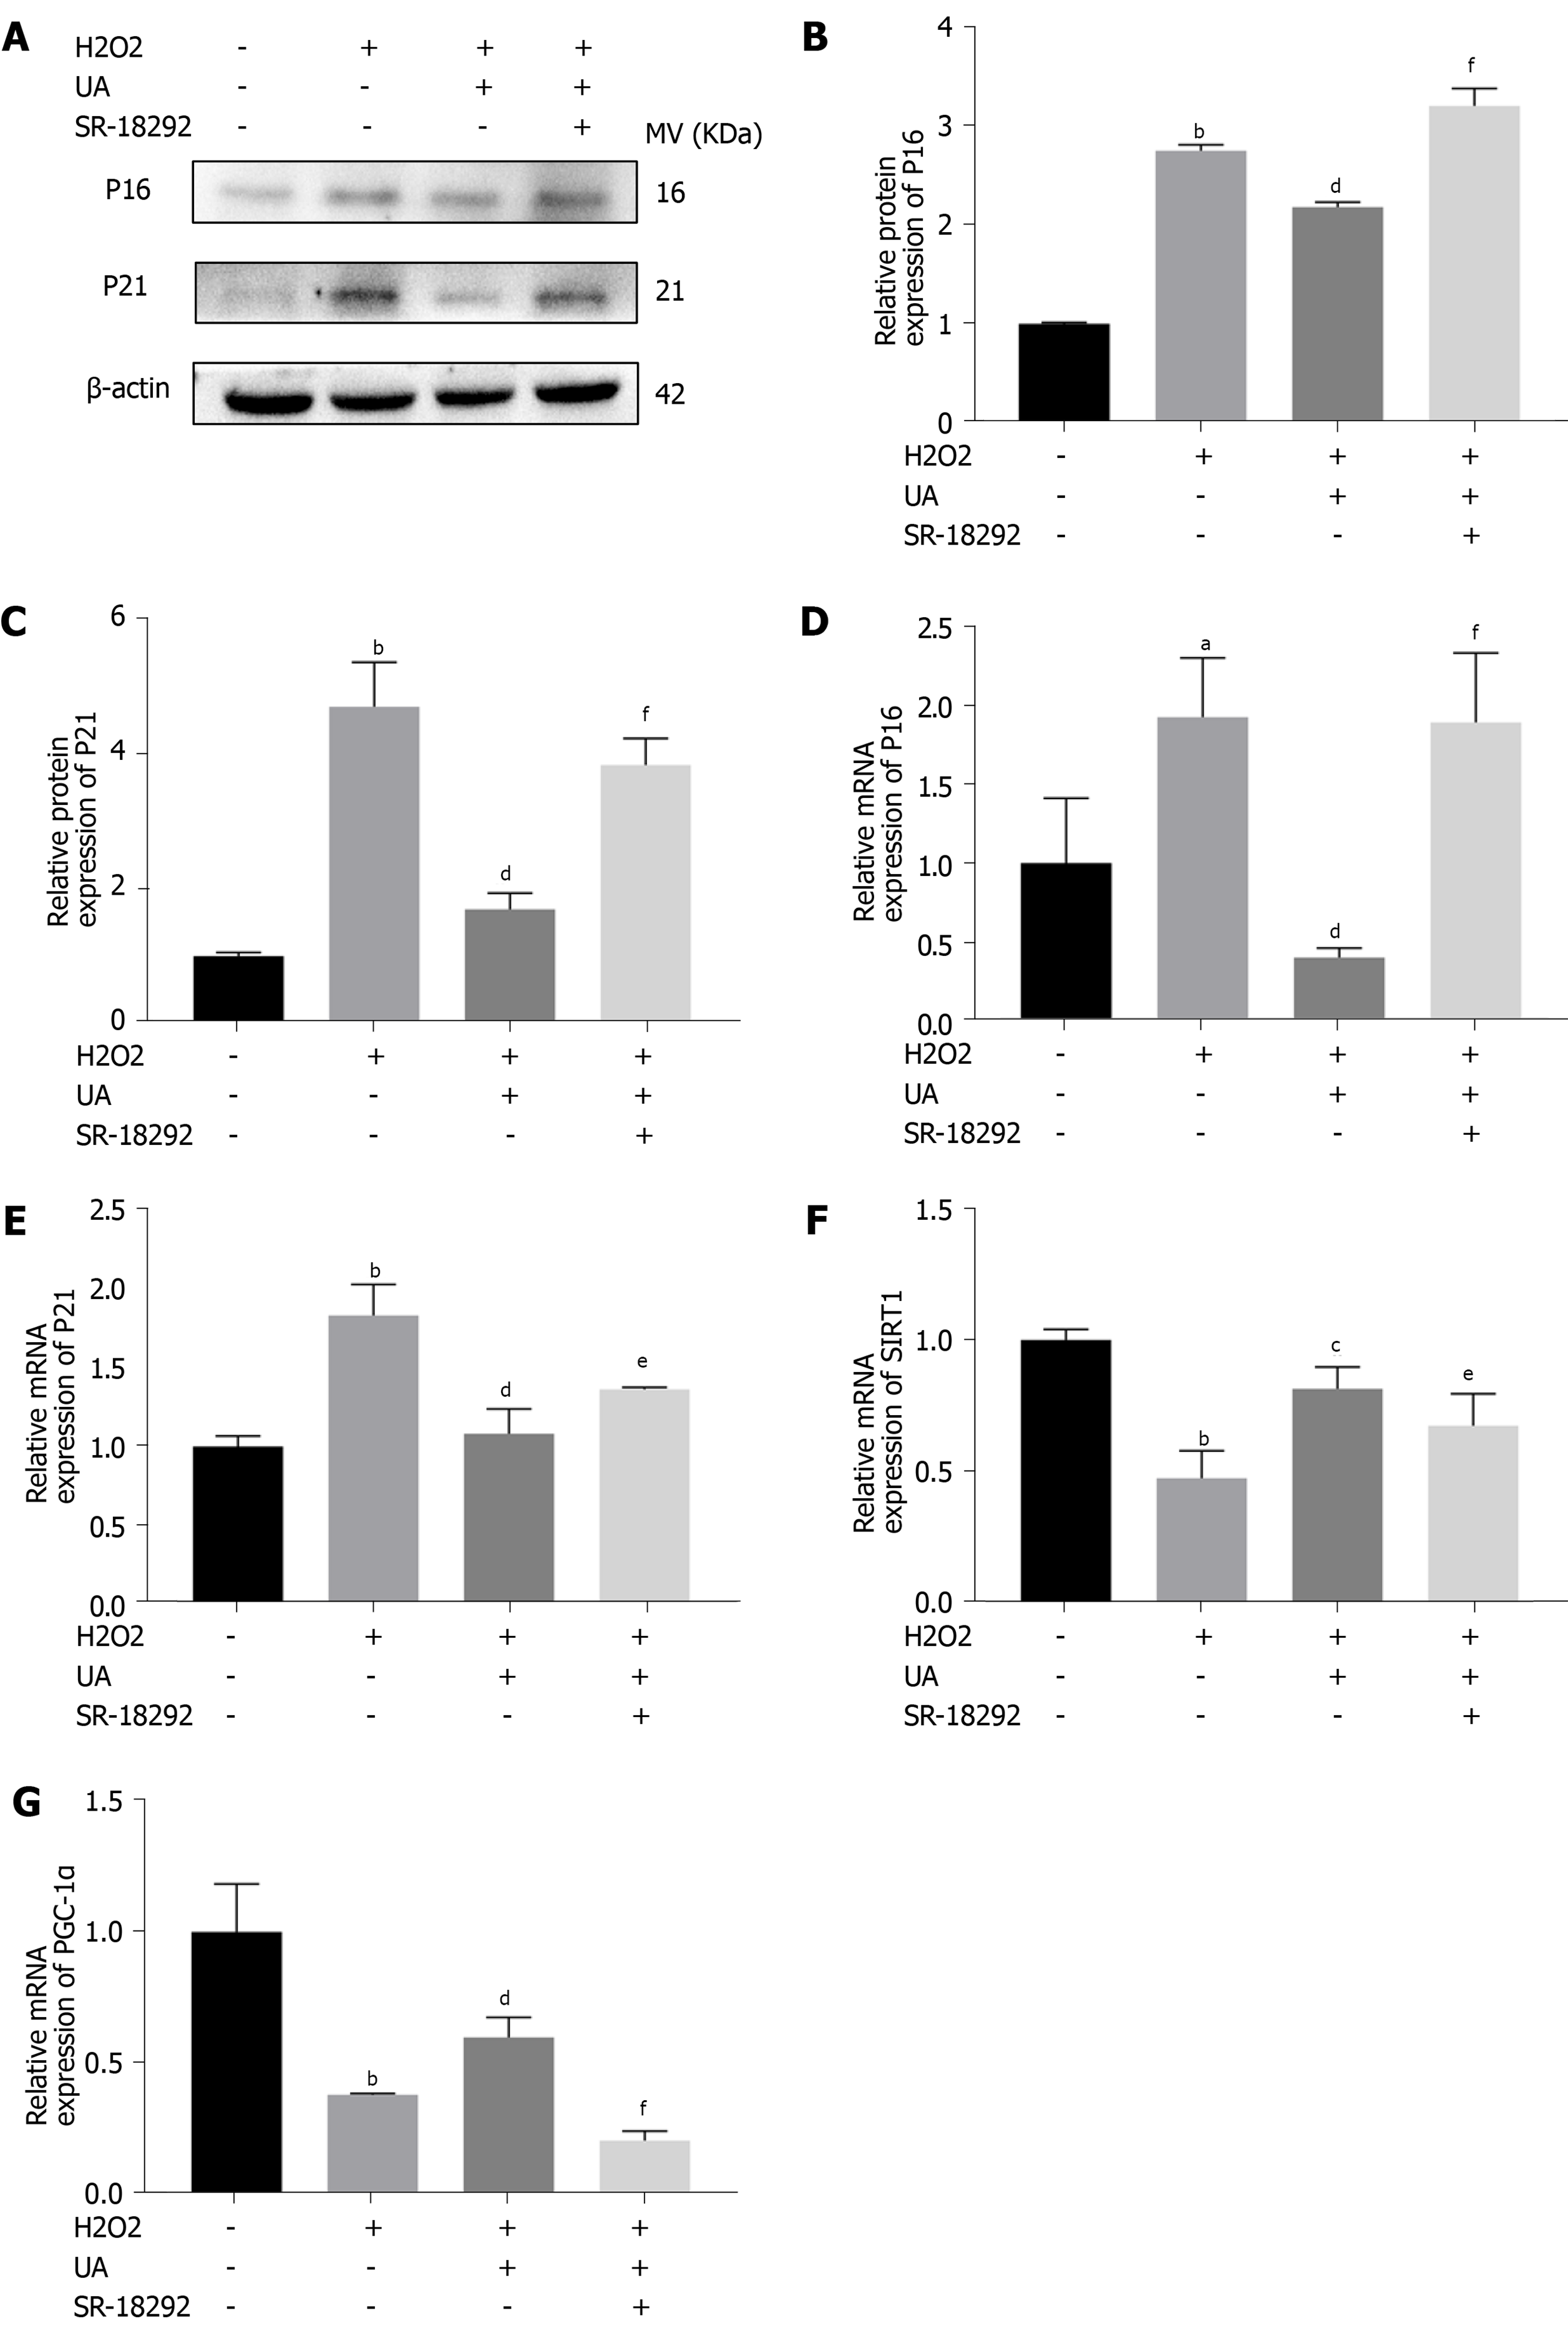
Figure 6 Senescence-related and SIRT1/PGC-1α pathway-related mRNA and proteins assay.
A: The expression of senescence-related proteins (P16 and P21) in different groups; B-C: Quantitative analysis of P16 and P21 protein expression results; D-E: Quantitative analysis of P16 and P21 mRNA expression results; F-G: Quantitative analysis SIRT1/PGC-1α pathway-related mRNA. All data are expressed as the mean ± SD. aP < 0.05, bP < 0.01 compared with control group; cP < 0.05, dP < 0.01 compared with H2O2 group; eP < 0.05, fP < 0.01 compared with H2O2 + UA group. SIRT1/PGC-1α: Silent information regulator of transcription 1/PPAR gamma coactivator-1α; UA: Urolithin A.
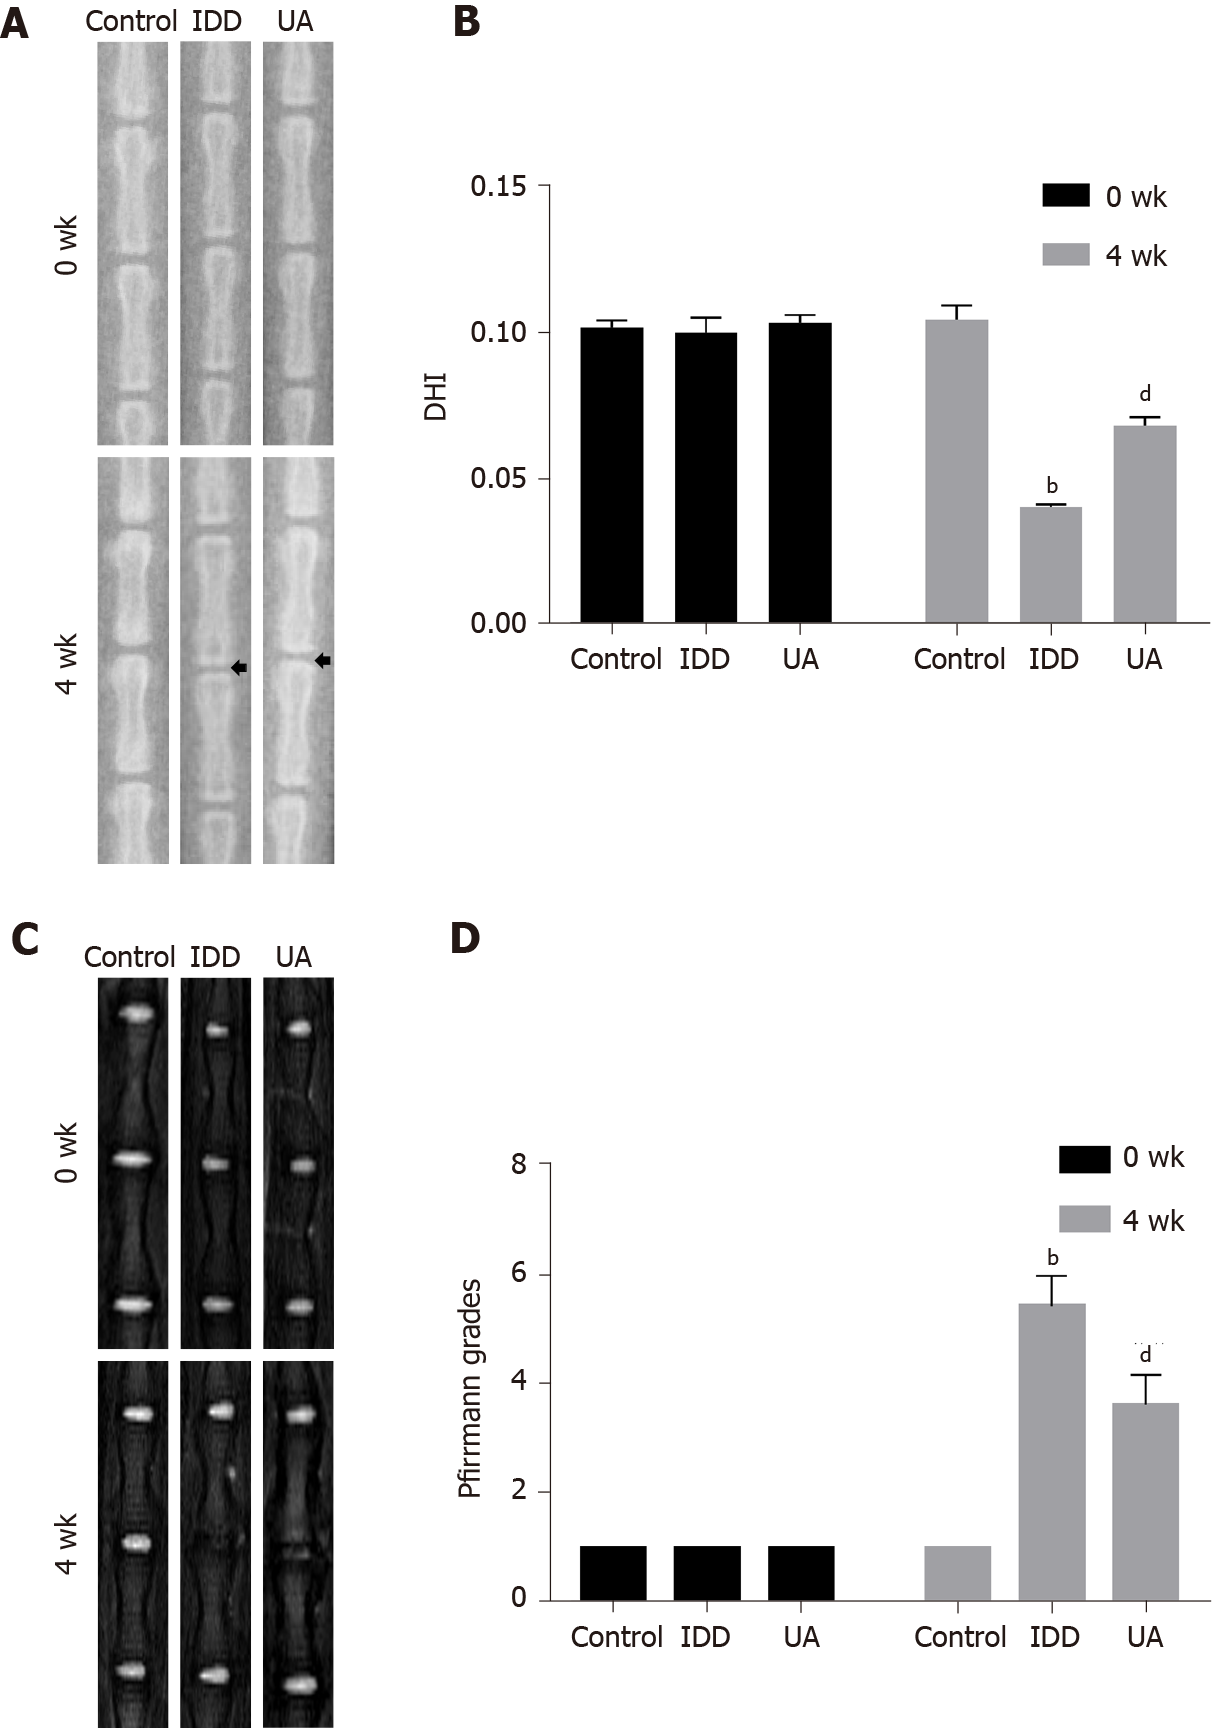
Figure 7 X-ray and magnetic resonance imaging evaluation in intervertebral disc degeneration animal models.
A: The X-ray in different groups at 0 wk and 4 wk after puncturing; B: Quantitative analysis of the disc height index in different groups; C: The magnetic resonance imaging results of different groups at 0 wk and 4 wk after puncture; D: Quantitative analysis of Pfirrmann grades in different groups. All data are expressed as the mean ± SD. aP < 0.05, bP < 0.01 compared with control group; cP < 0.05, dP < 0.01 compared with H2O2 group; eP < 0.05, fP < 0.01 compared with UA group. DHI: Disc height index; MRI: Magnetic resonance imaging; IDD: Intervertebral disc degeneration; UA: Urolithin A.
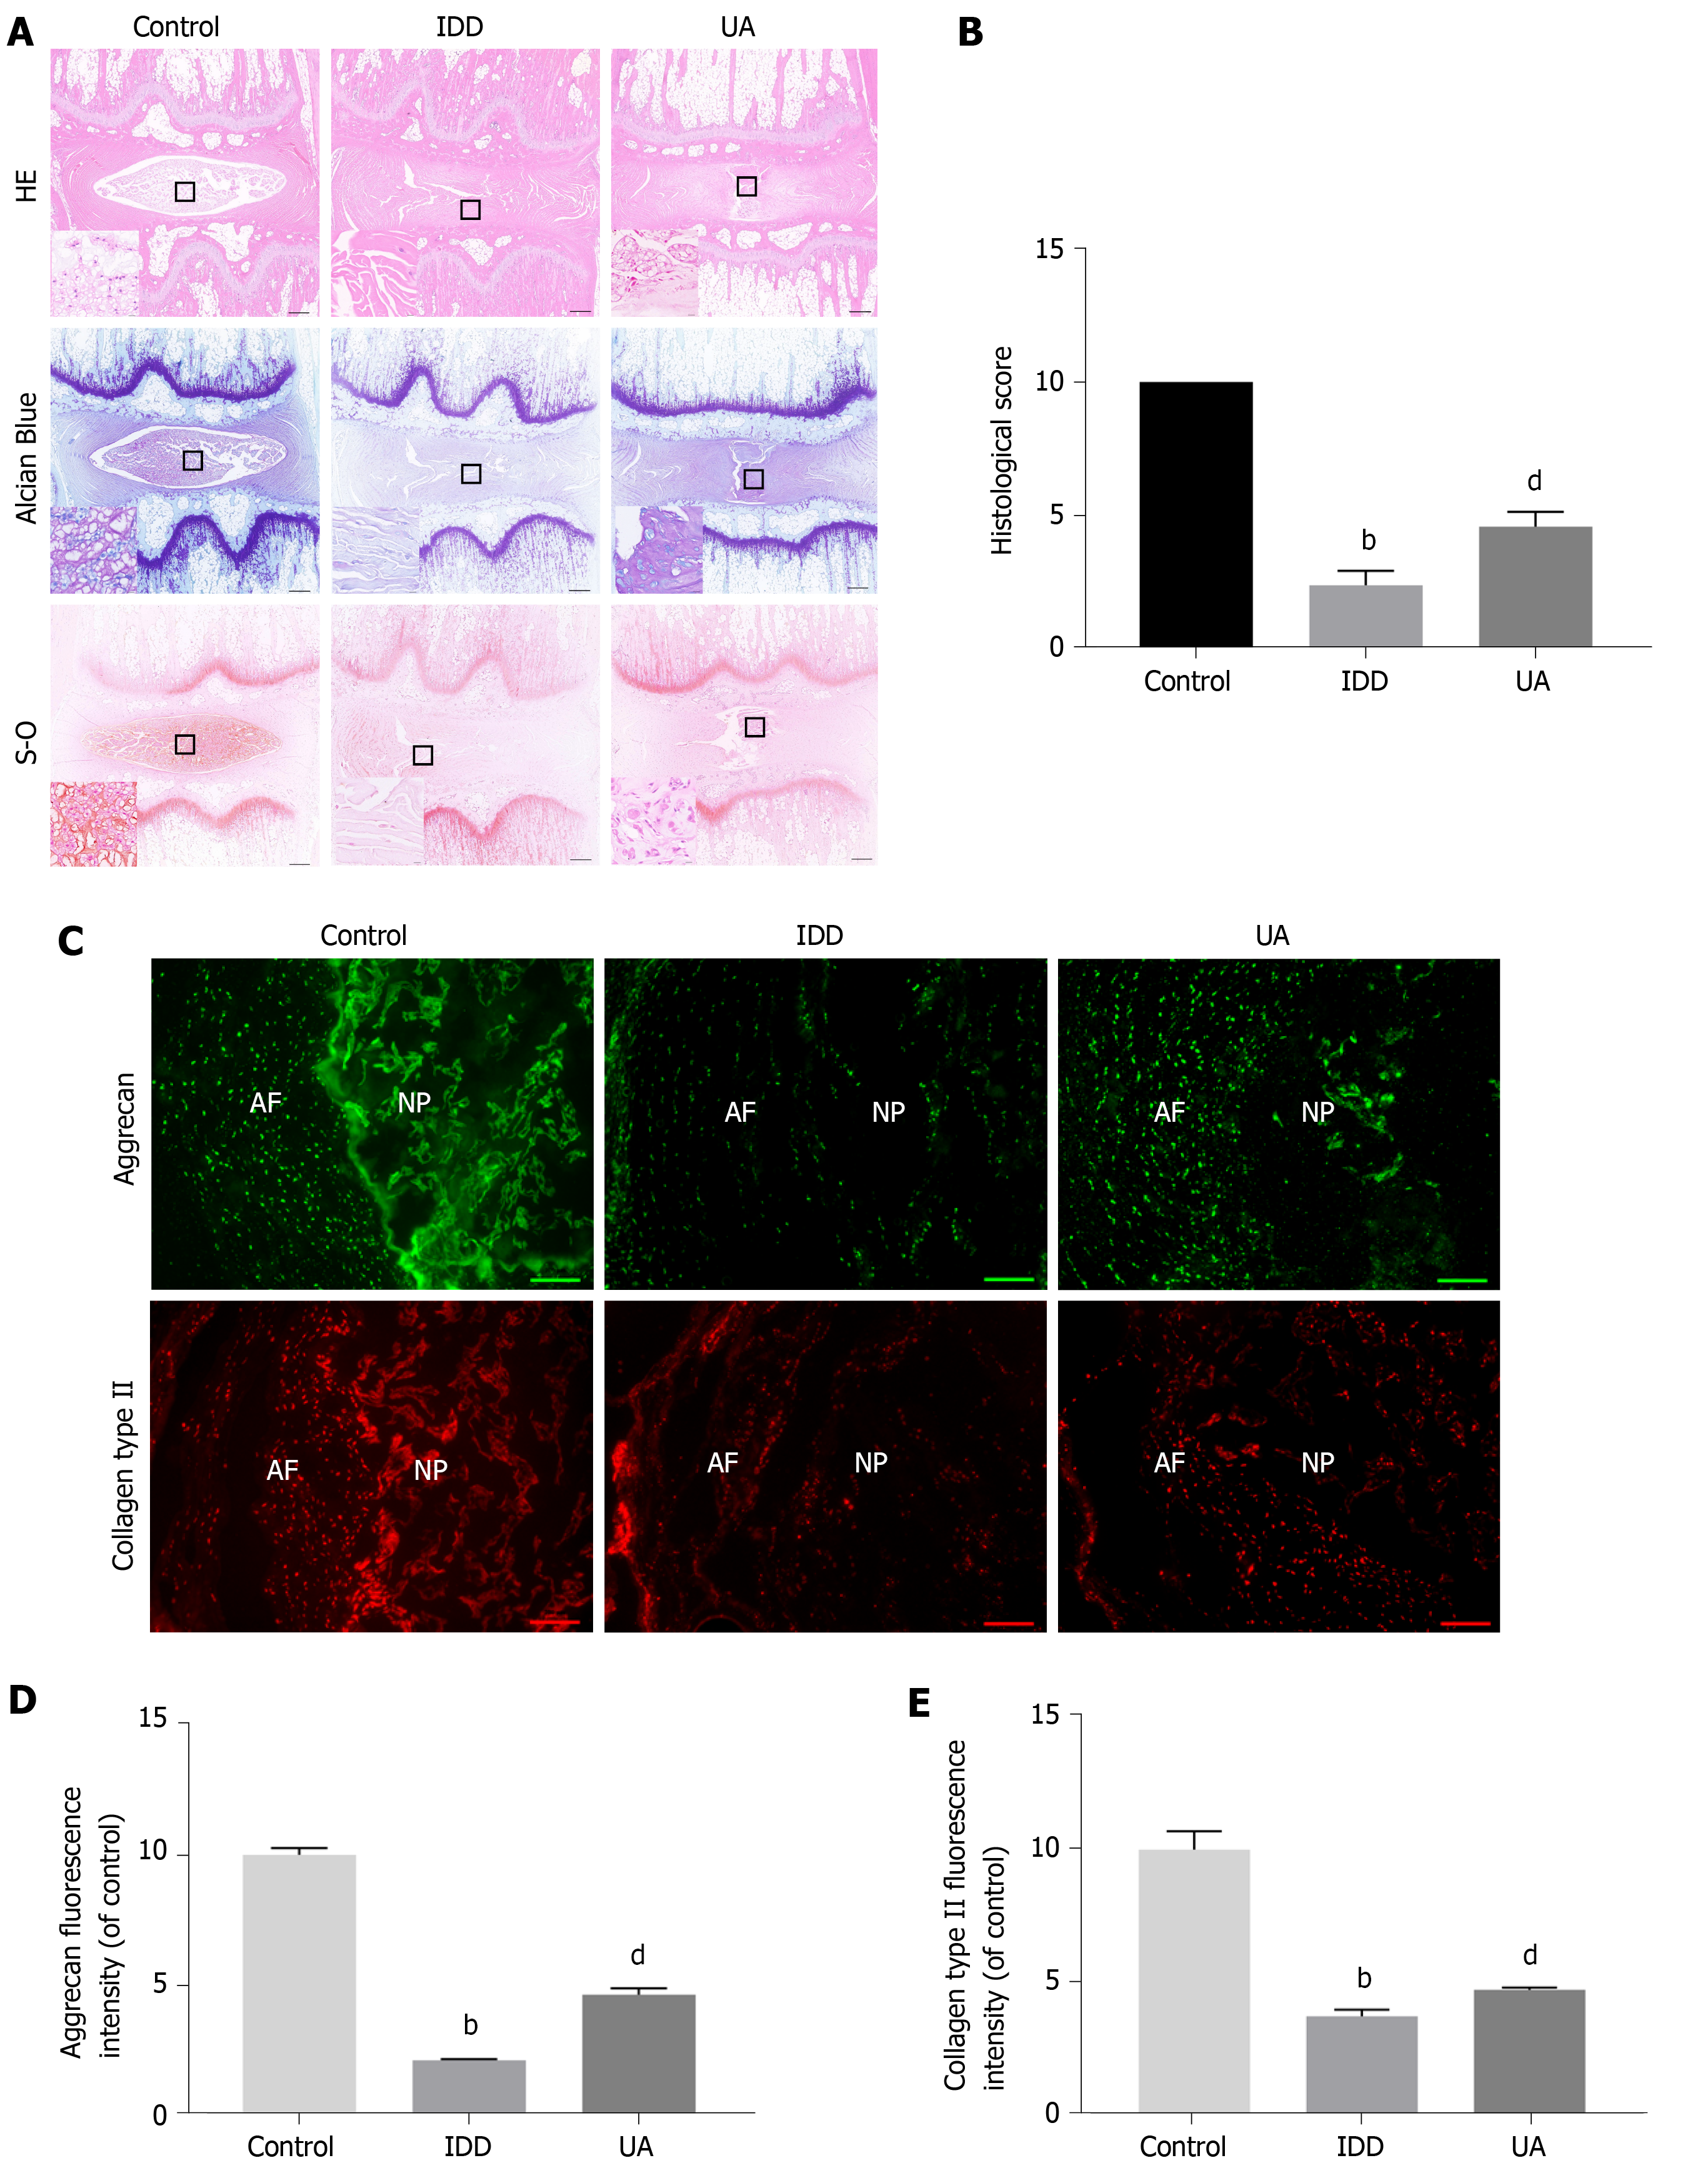
Figure 8 Hematoxylin-eosin, Safranin-O and Toluidine blue staining.
A: Hematoxylin-eosin staining at 4 wk after puncture in different groups; B: Quantitative analysis of histological score in different groups (scale bar = 1 mm); C: The expression of aggrecan and collagen type II in different groups (scale bar = 200 μm); D-E: Quantitative analysis of aggrecan and collagen type II in different groups. All data are expressed as the mean ± SD. aP < 0.05, bP < 0.01 compared with control group; cP < 0.05, dP < 0.01 compared with H2O2 group; eP < 0.05, fP < 0.01 compared with UA group. HE: Hematoxylin-eosin; NP: Nucleus pulposus; AF: Annulus fibrosus; IDD: Intervertebral disc degeneration; UA: Urolithin A.
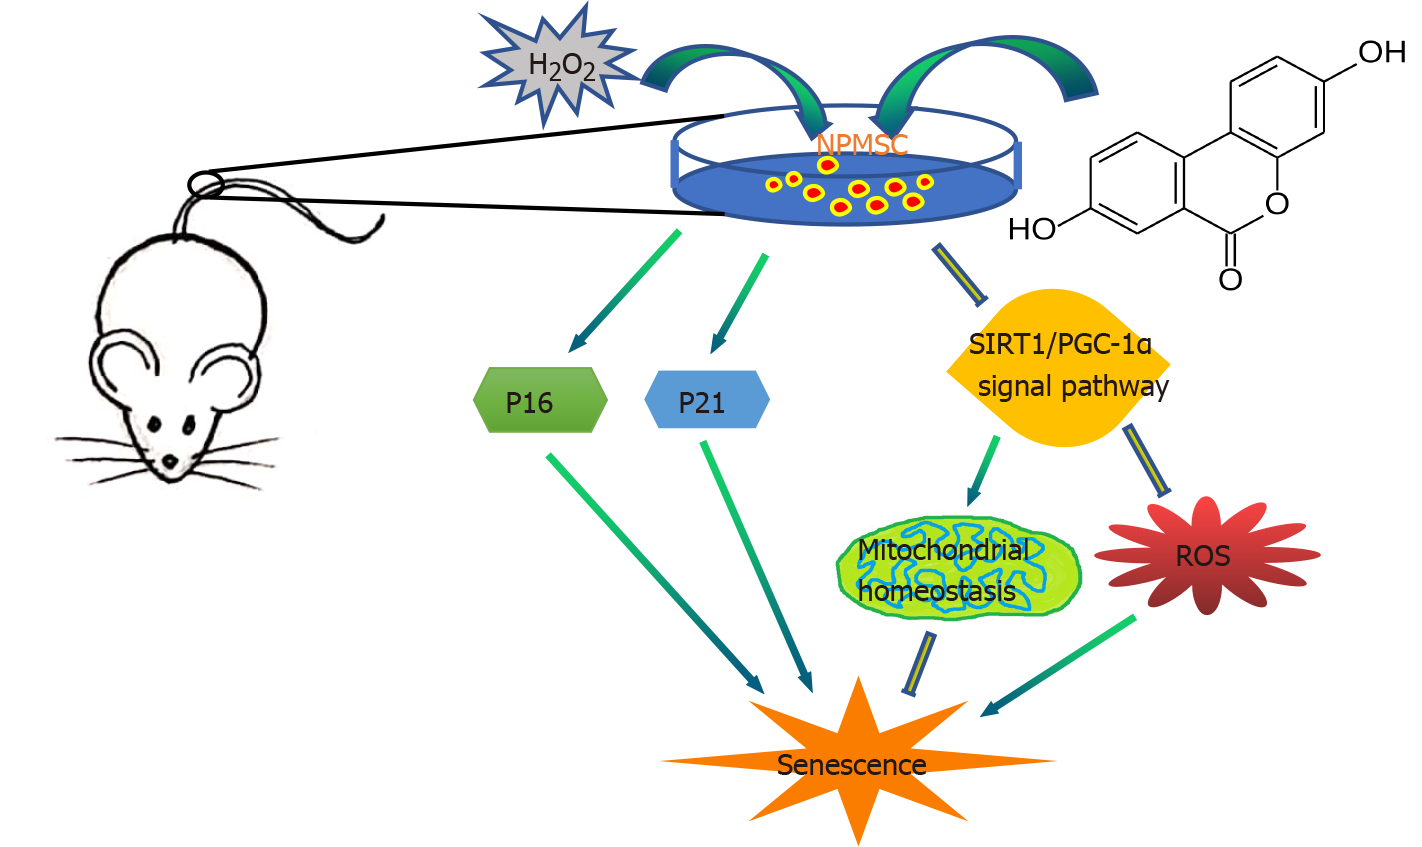
Figure 9 Schematic of protective effects of Urolithin A.
Urolithin A activates the SIRT1/PGC-1α signaling pathway to protect mitochondrial function, alleviate nucleus pulposus-derived mesenchymal stem cells senescence in vitro, and delay intervertebral disc degeneration in vivo. SIRT1/PGC-1α: Silent information regulator of transcription 1/PPAR gamma coactivator-1α; NPMSCs: Nucleus pulposus-derived mesenchymal stem cells; UA: Urolithin A.
- Citation: Shi PZ, Wang JW, Wang PC, Han B, Lu XH, Ren YX, Feng XM, Cheng XF, Zhang L. Urolithin a alleviates oxidative stress-induced senescence in nucleus pulposus-derived mesenchymal stem cells through SIRT1/PGC-1α pathway. World J Stem Cells 2021; 13(12): 1928-1946
- URL: https://www.wjgnet.com/1948-0210/full/v13/i12/1928.htm
- DOI: https://dx.doi.org/10.4252/wjsc.v13.i12.1928


