Copyright
©The Author(s) 2021.
World J Stem Cells. Dec 26, 2021; 13(12): 1905-1917
Published online Dec 26, 2021. doi: 10.4252/wjsc.v13.i12.1905
Published online Dec 26, 2021. doi: 10.4252/wjsc.v13.i12.1905
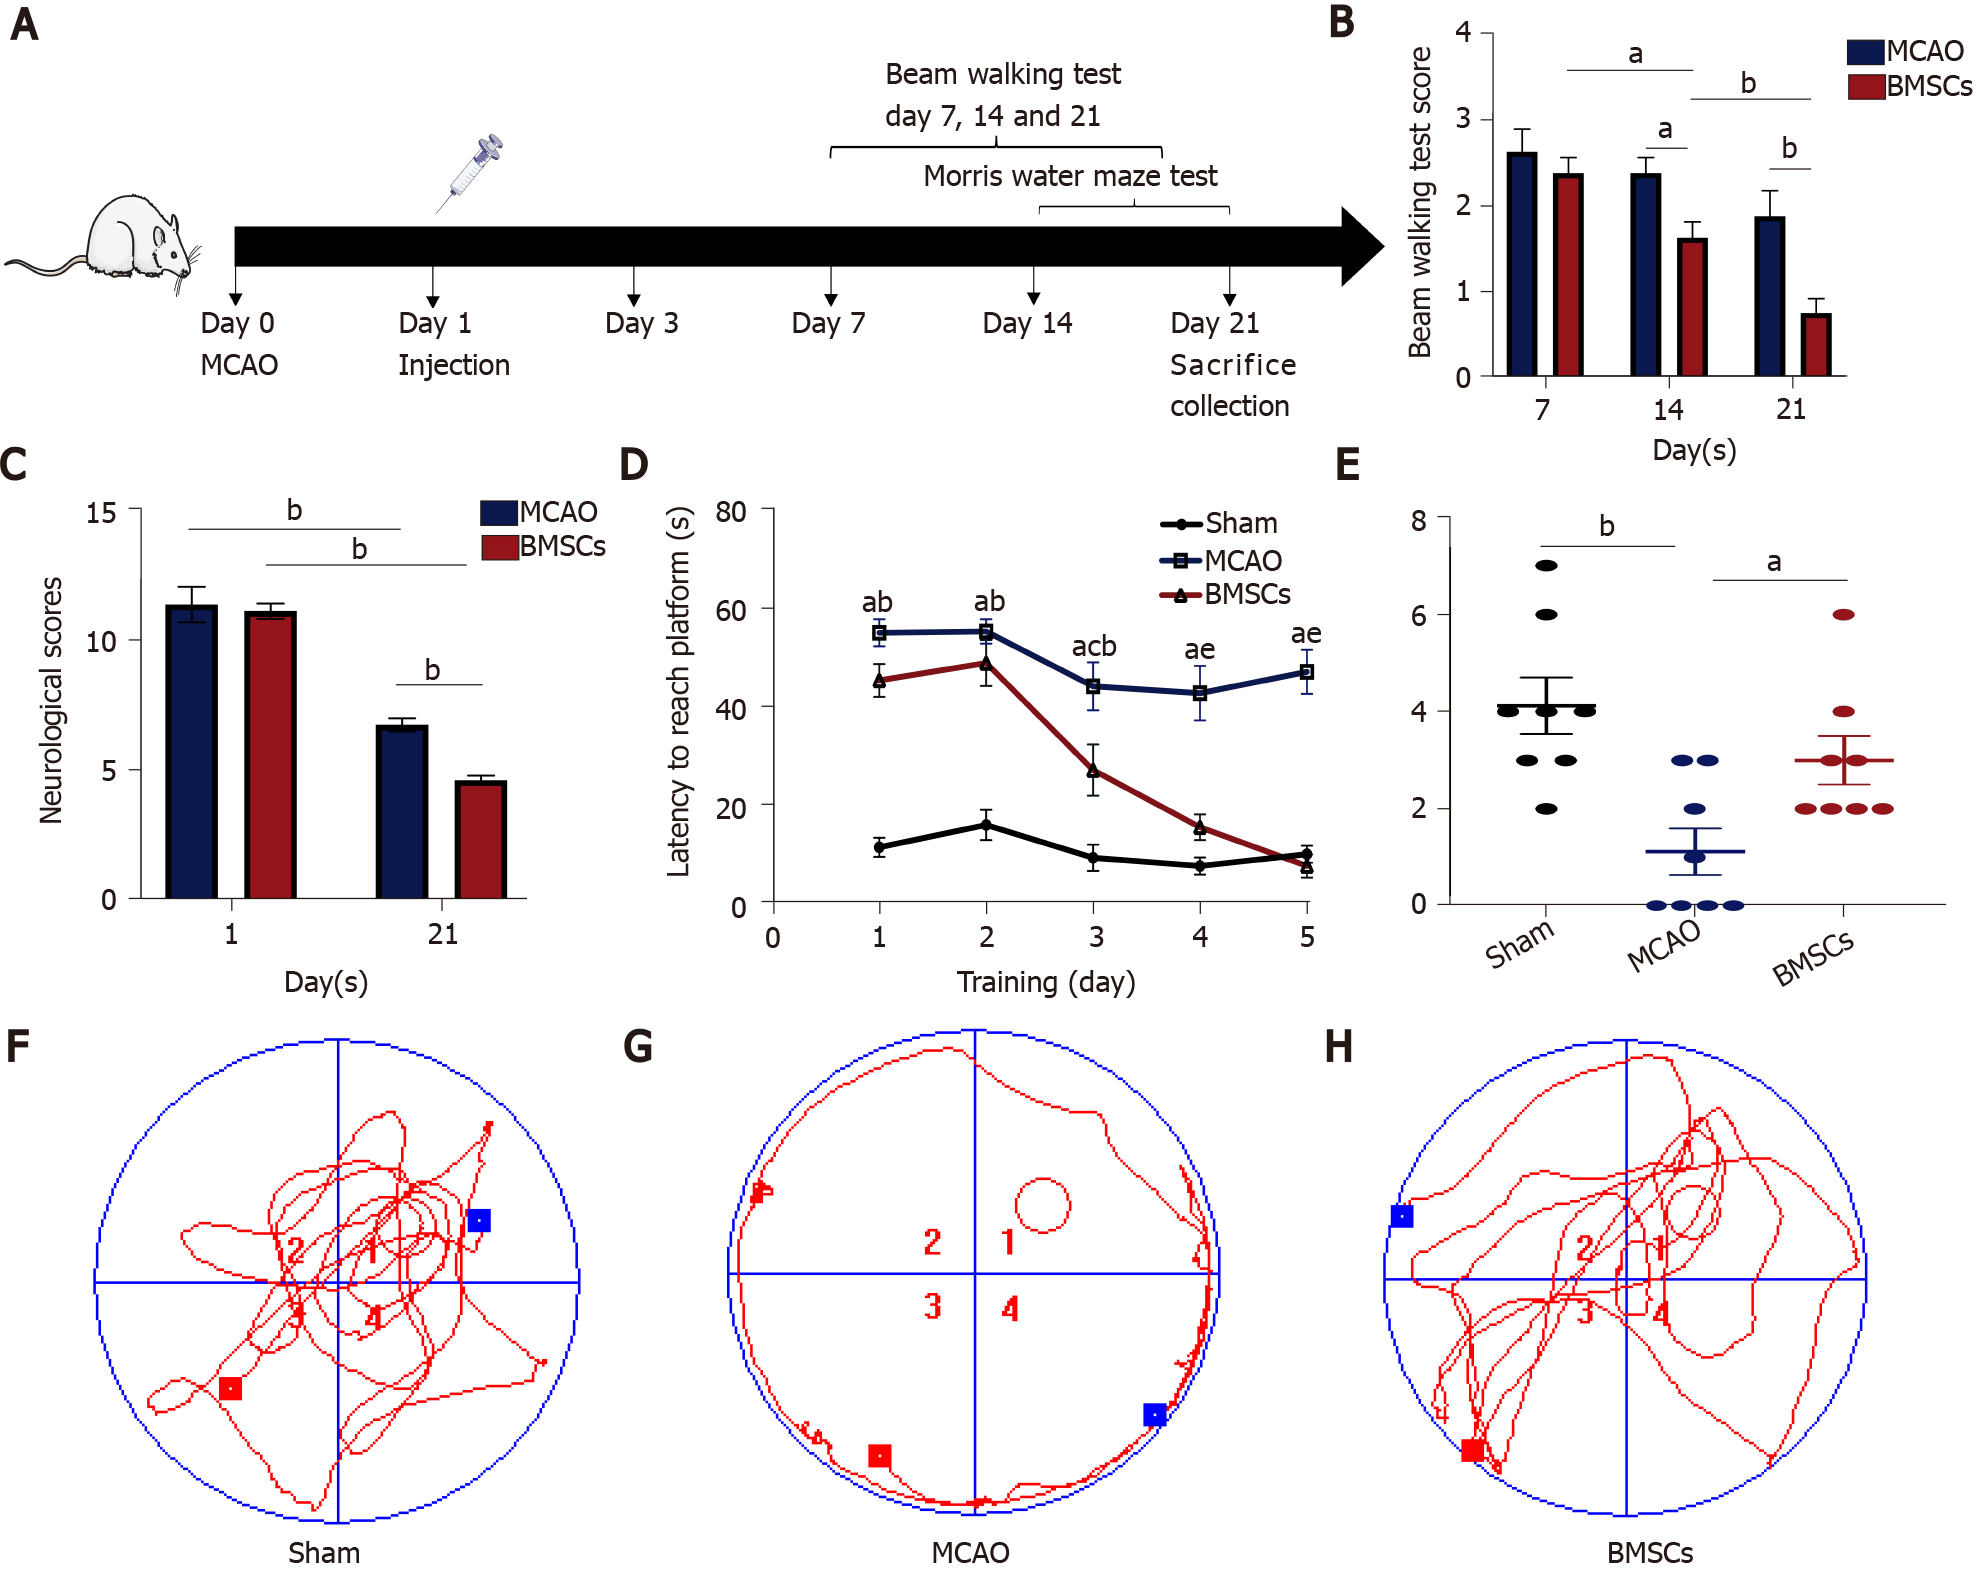
Figure 1 Bone marrow mesenchymal stem cells improve neurological function after stroke.
A: Experimental design. Rats (3-5 wk) were randomly divided into three groups: Sham, middle cerebral artery occlusion (MCAO), and bone marrow mesenchymal stem cells (BMSCs). BMSCs or PBS were injected through the tail vein 1 d after MCAO. The modified Neurological Severity Score (mNSS), the beam walking test, and the Morris water maze test were evaluated before rats were killed after 21 d of reperfusion; B: mNSS was performed at days 1 and 21 after MCAO (aP < 0.05; bP < 0.01); C: Beam walking test were performed at days 7, 14, and 21 after MCAO (bP < 0.01); D-H: Morris water maze test. The time that rats needed to escape latency to find the hidden platform (D). aP < 0.01 when Sham vs MCAO; bP < 0.01 when Sham vs BMSCs; cP < 0.01 when Sham vs BMSCs; dP < 0.01 when MCAO vs BMSCs; eP < 0.01 when MCAO vs BMSCs. The number of rats crossing over the target platform on the sixth day (aP < 0.05; bP < 0.01) (E). The data are expressed as the mean ± SEM (n = 10). The tracks of each group on the sixth day (F-H). BMSCs: Bone marrow mesenchymal stem cells; MCAO: Middle cerebral artery occlusion.
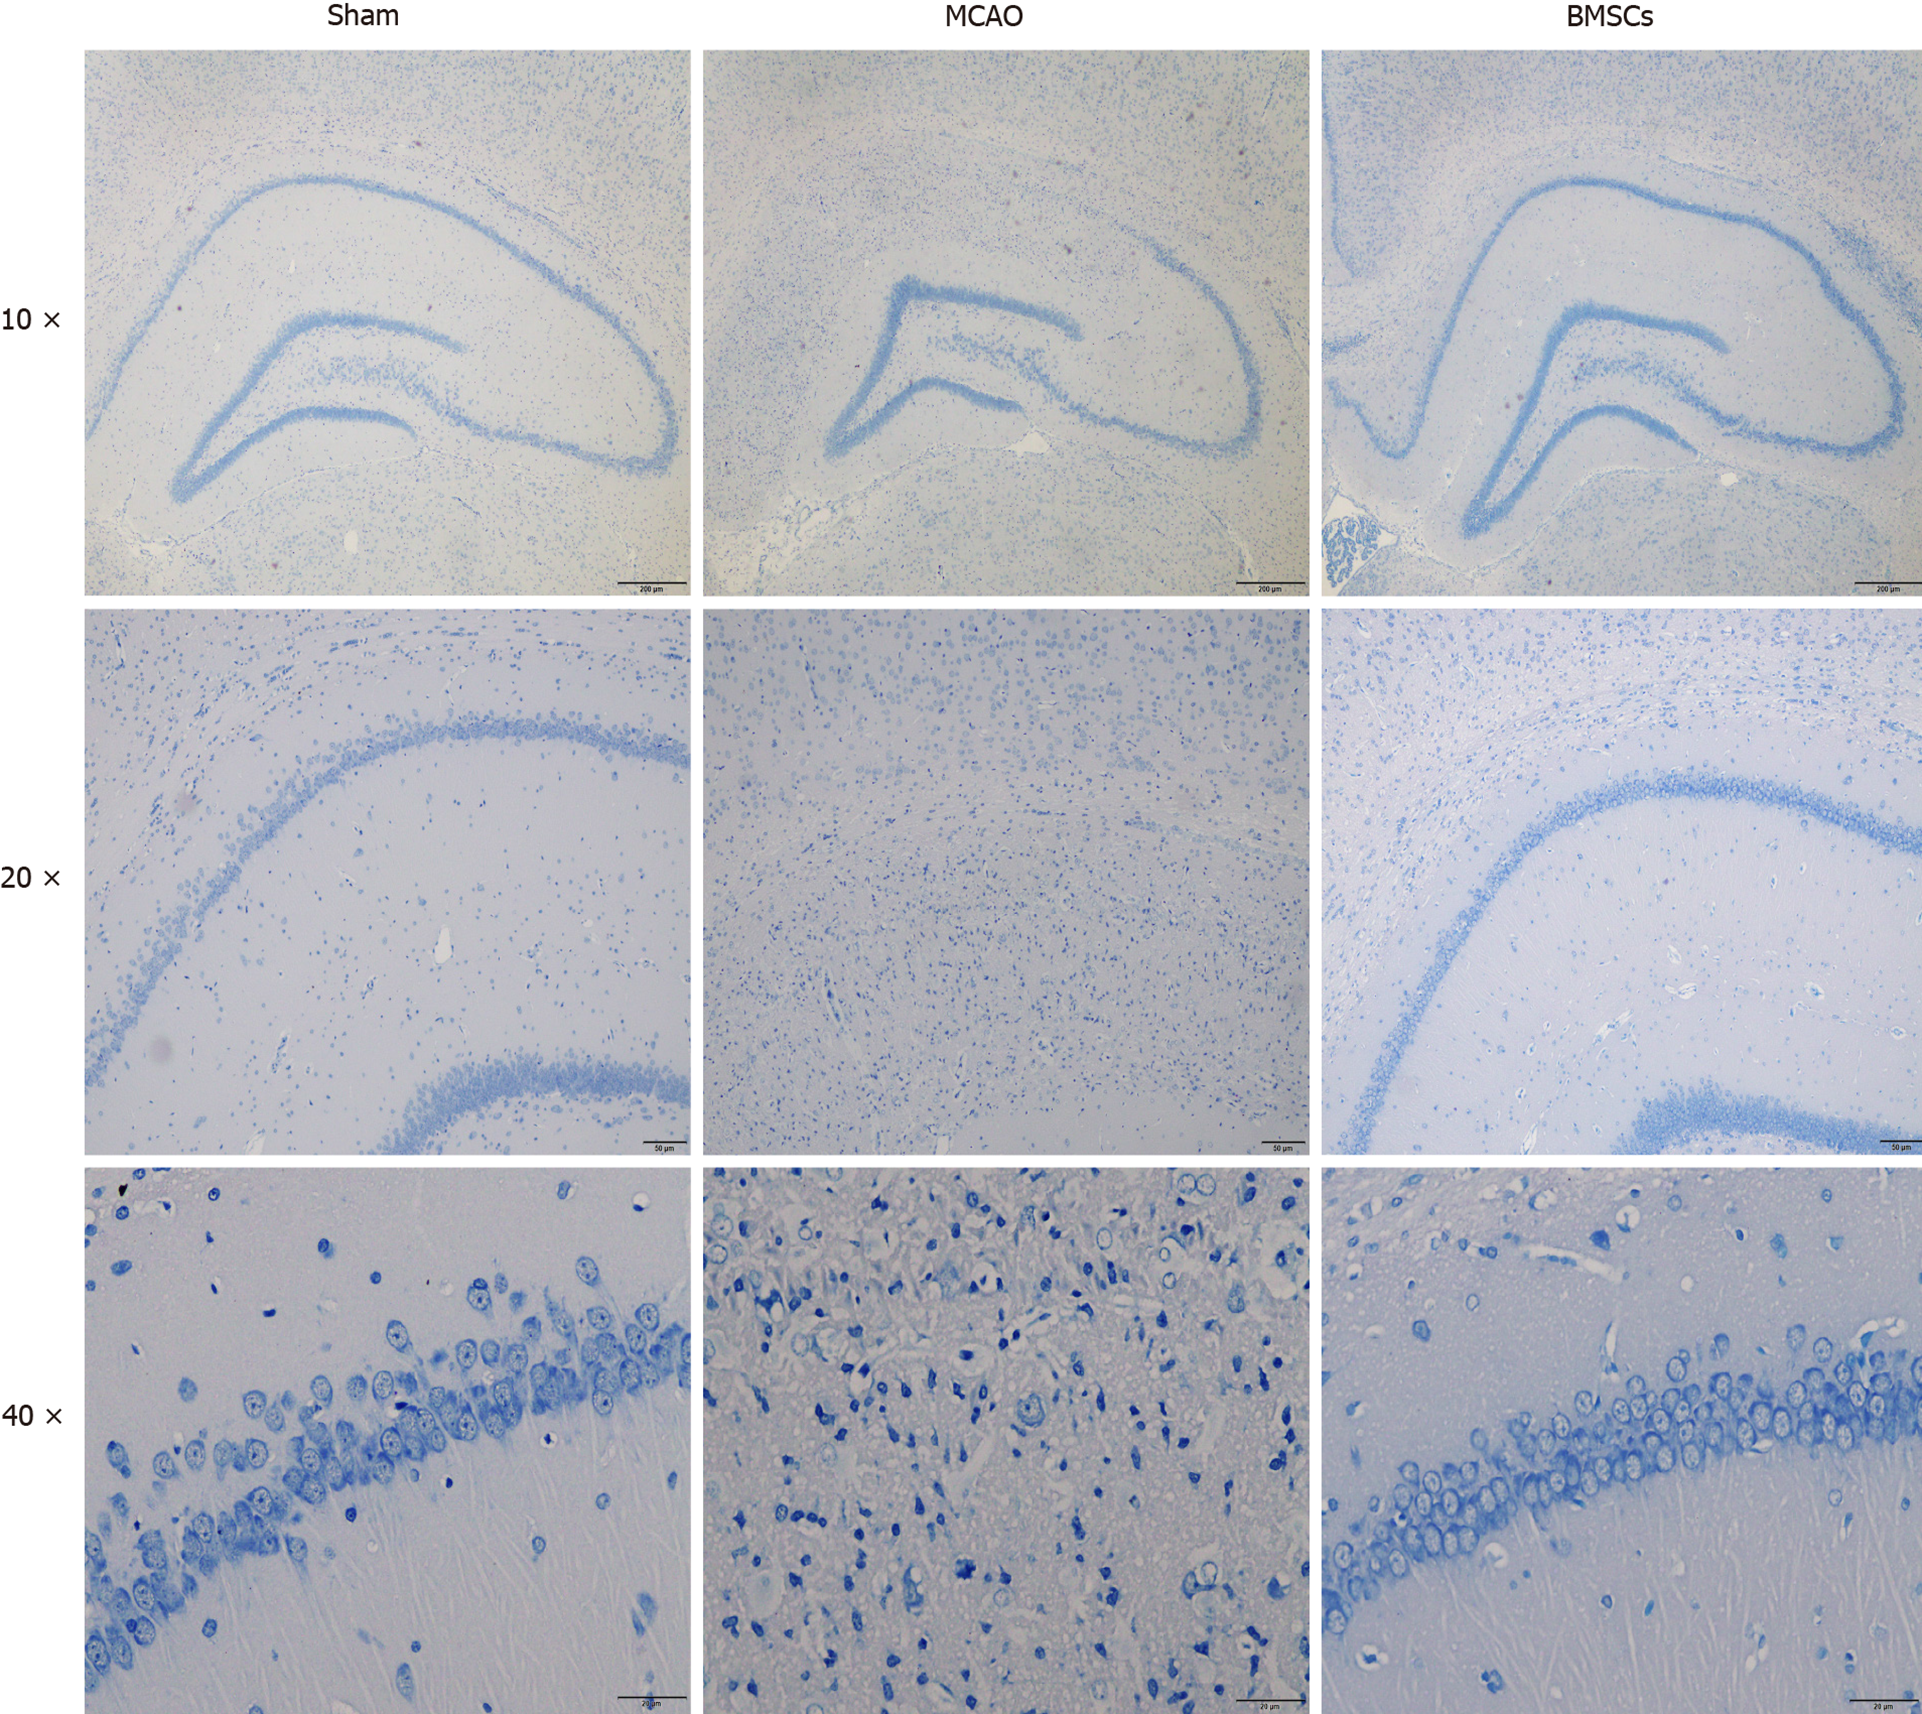
Figure 2 Histopathological changes in brain tissue of rats.
Nissl staining in the hippocampal CA1 region for the Sham, middle cerebral artery occlusion, and bone marrow mesenchymal stem cells group exhibited brain injury after 21 d post-stroke (n = 3). Pathological observation of the hippocampus (magnification, × 40). CA1 region of the hippocampus (magnification, × 100). The morphologies of neurons in the hippocampal CA1 region (magnification, × 400). BMSCs: Bone marrow mesenchymal stem cells; MCAO: Middle cerebral artery occlusion.
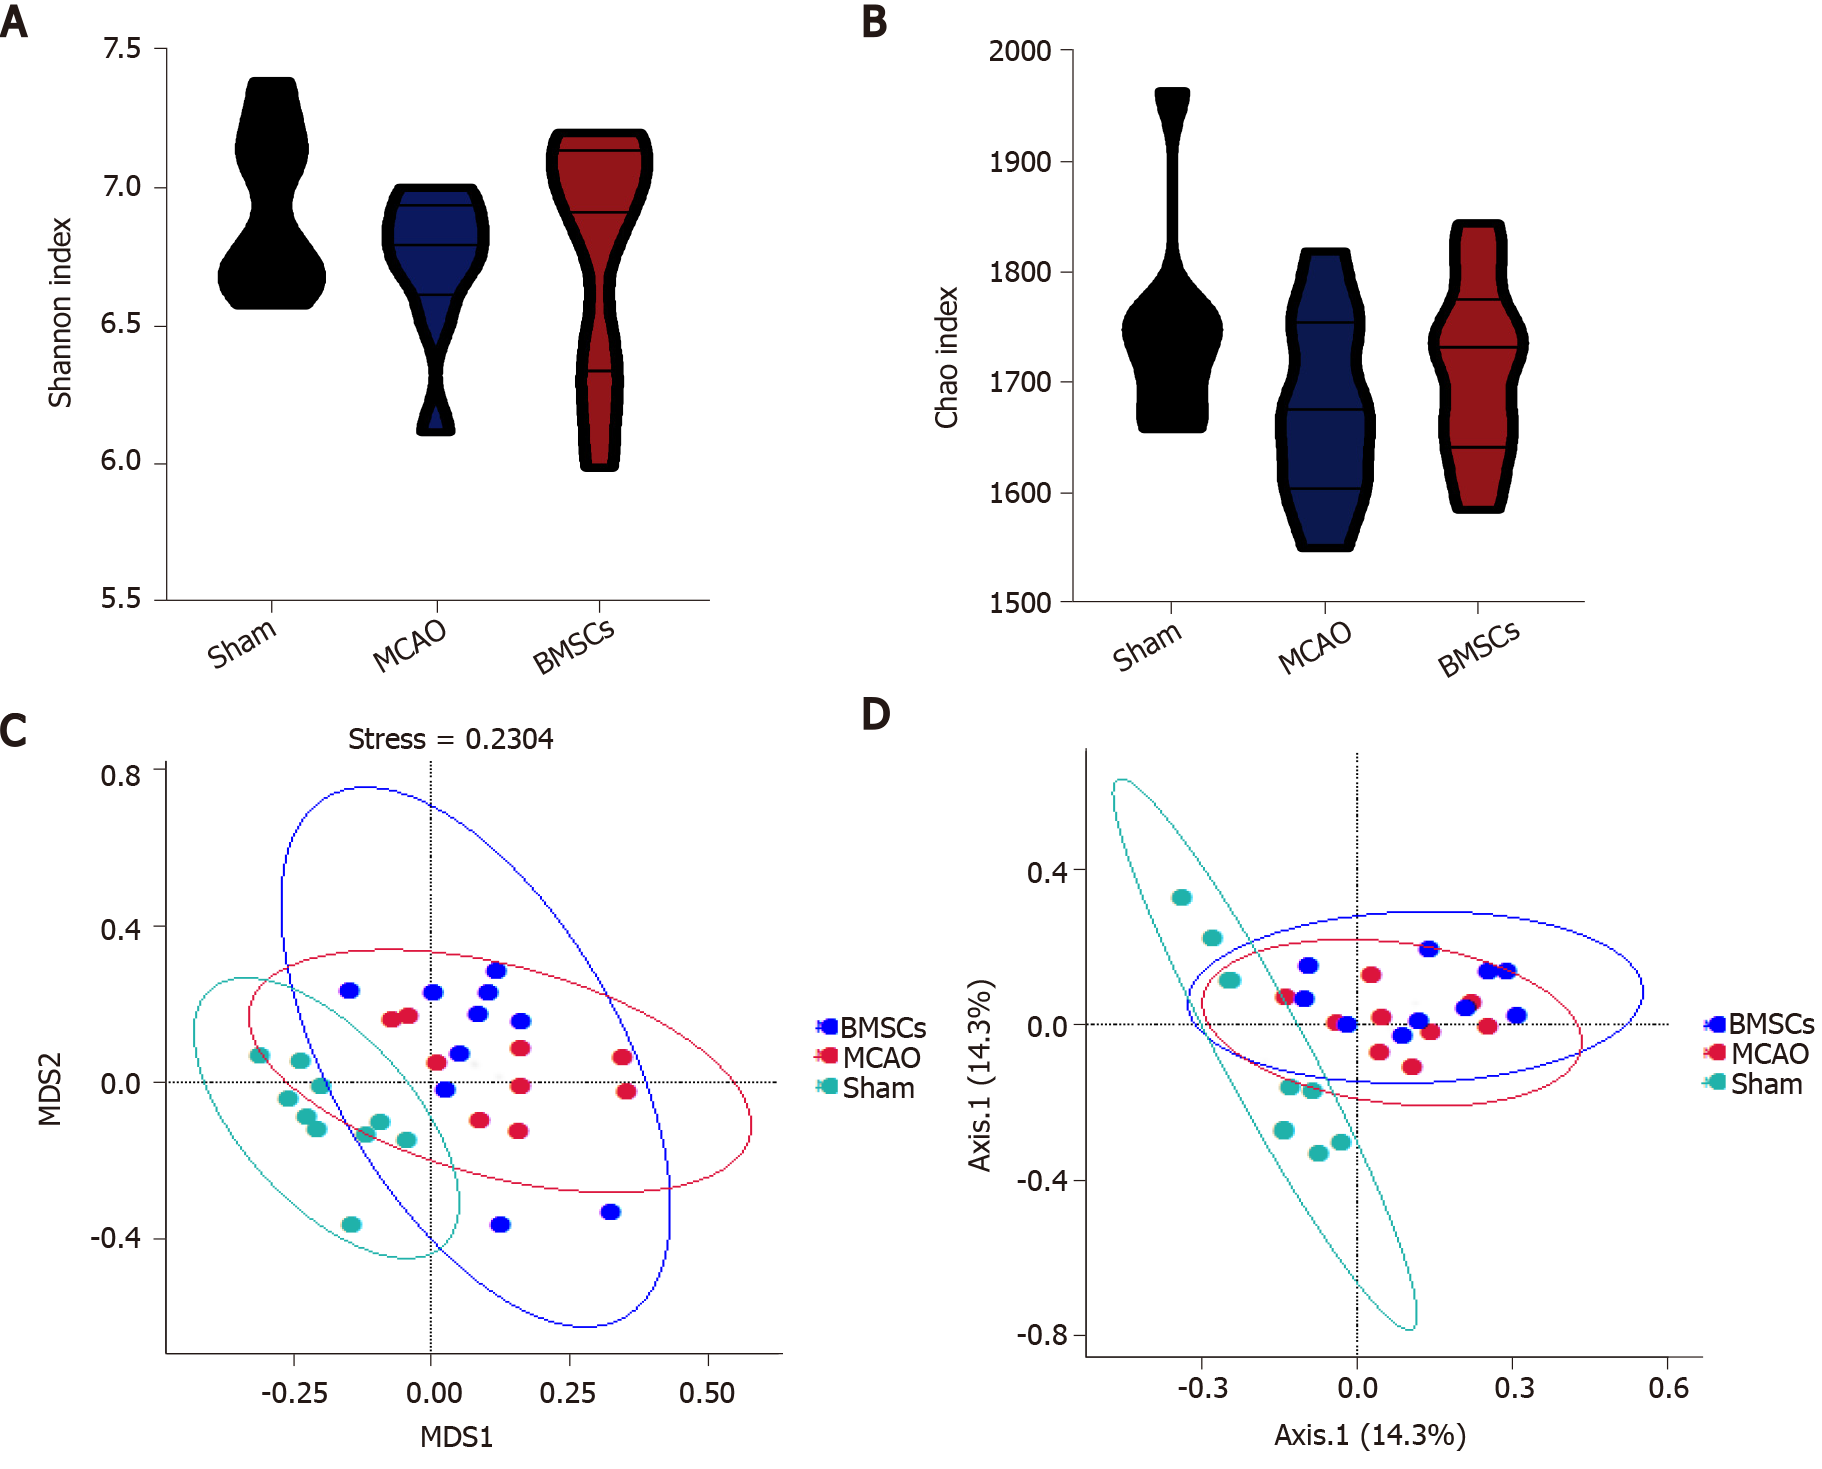
Figure 3 Abundance and structures analysis of intestinal microecology.
A and B: Shannon and Chao index to present α-diversity of gut microbiota; C and D: mNDS and PCoA plot to illustrate the dissimilarities among microbiota structures. BMSCs: Bone marrow mesenchymal stem cells; MCAO: Middle cerebral artery occlusion.
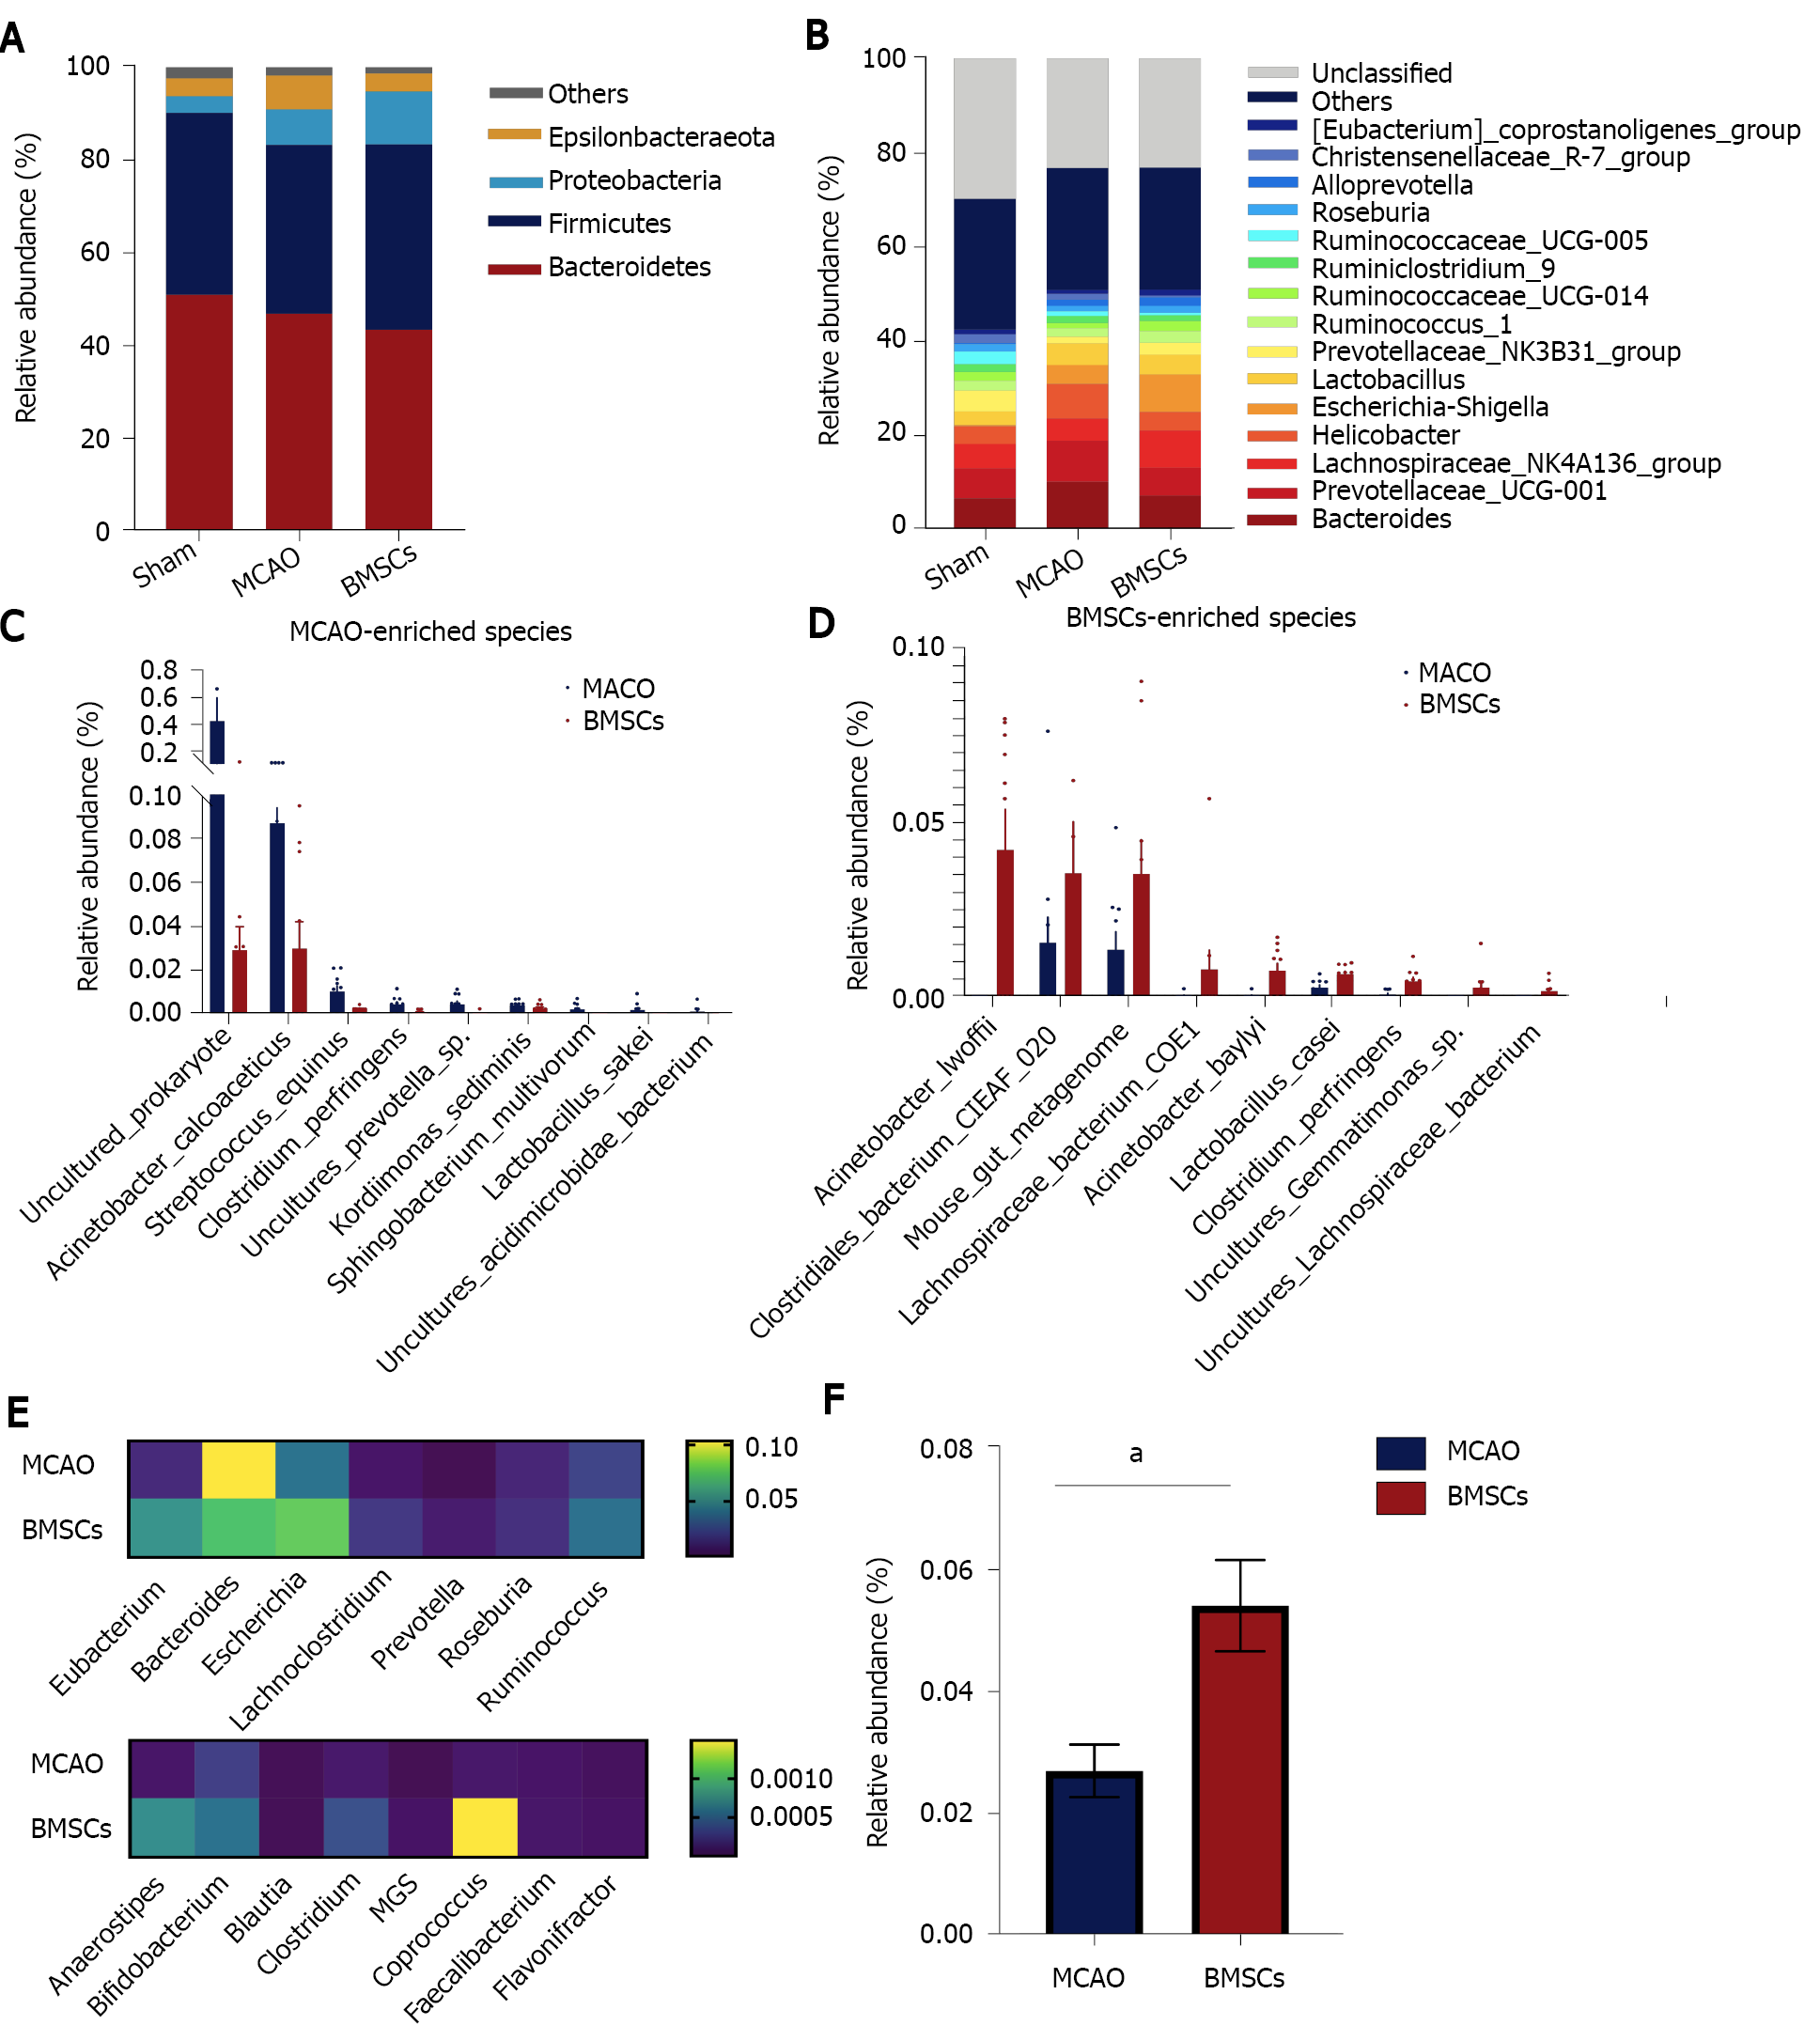
Figure 4 Bone marrow mesenchymal stem cells modulate the composition of gut microbiota.
A: Taxonomic composition at the phylum level; B: Taxonomic composition at the genus level; C and D: Significantly different abundances at the species level between middle cerebral artery occlusion (MCAO) and bone marrow mesenchymal stem cells groups; E: Comparison of the abundance of potential short-chain fatty acid-producing species in the MCAO and BH groups; F: Relative abundances of Lactobacillus at the genus level between the MCAO and BH groups (aP < 0.05). The data are expressed as the mean ± SEM (n = 10). BMSCs: Bone marrow mesenchymal stem cells; MCAO: Middle cerebral artery occlusion.
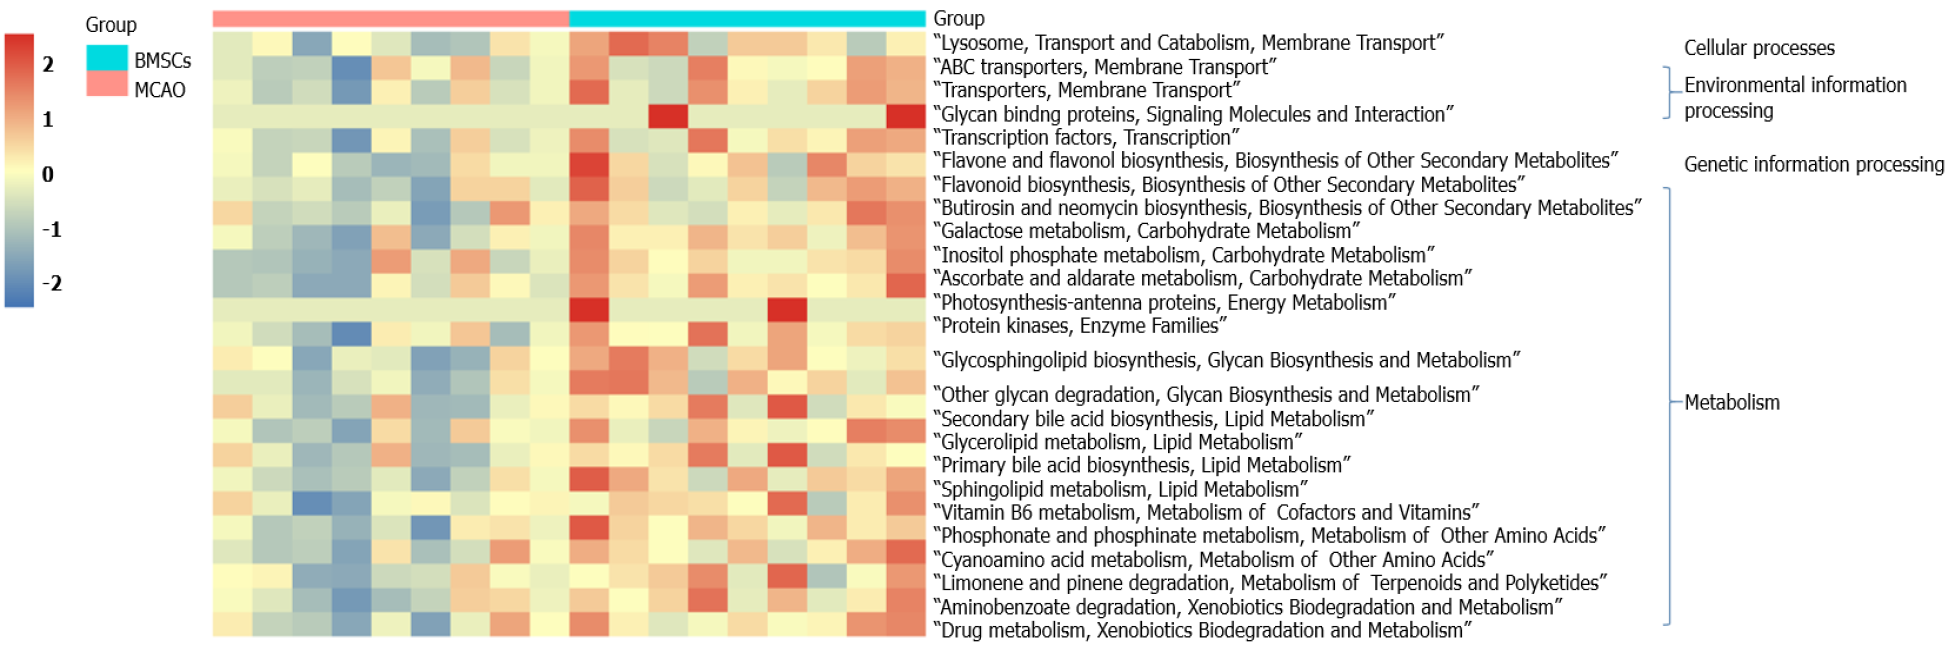
Figure 5 Alterations of microbial function.
Heatmap illustrates the difference of Kyoto Encyclopedia of Genes and Genomes (KEGG) pathways (KEGG level 3) between middle cerebral artery occlusion and bone marrow mesenchymal stem cells groups. Welch's t-test was used for statistical analysis, and the pathways is displayed when P< 0.05. BMSCs: Bone marrow mesenchymal stem cells; MCAO: Middle cerebral artery occlusion.
- Citation: Zhao LN, Ma SW, Xiao J, Yang LJ, Xu SX, Zhao L. Bone marrow mesenchymal stem cell therapy regulates gut microbiota to improve post-stroke neurological function recovery in rats. World J Stem Cells 2021; 13(12): 1905-1917
- URL: https://www.wjgnet.com/1948-0210/full/v13/i12/1905.htm
- DOI: https://dx.doi.org/10.4252/wjsc.v13.i12.1905


