Copyright
©The Author(s) 2021.
World J Stem Cells. Oct 26, 2021; 13(10): 1595-1609
Published online Oct 26, 2021. doi: 10.4252/wjsc.v13.i10.1595
Published online Oct 26, 2021. doi: 10.4252/wjsc.v13.i10.1595
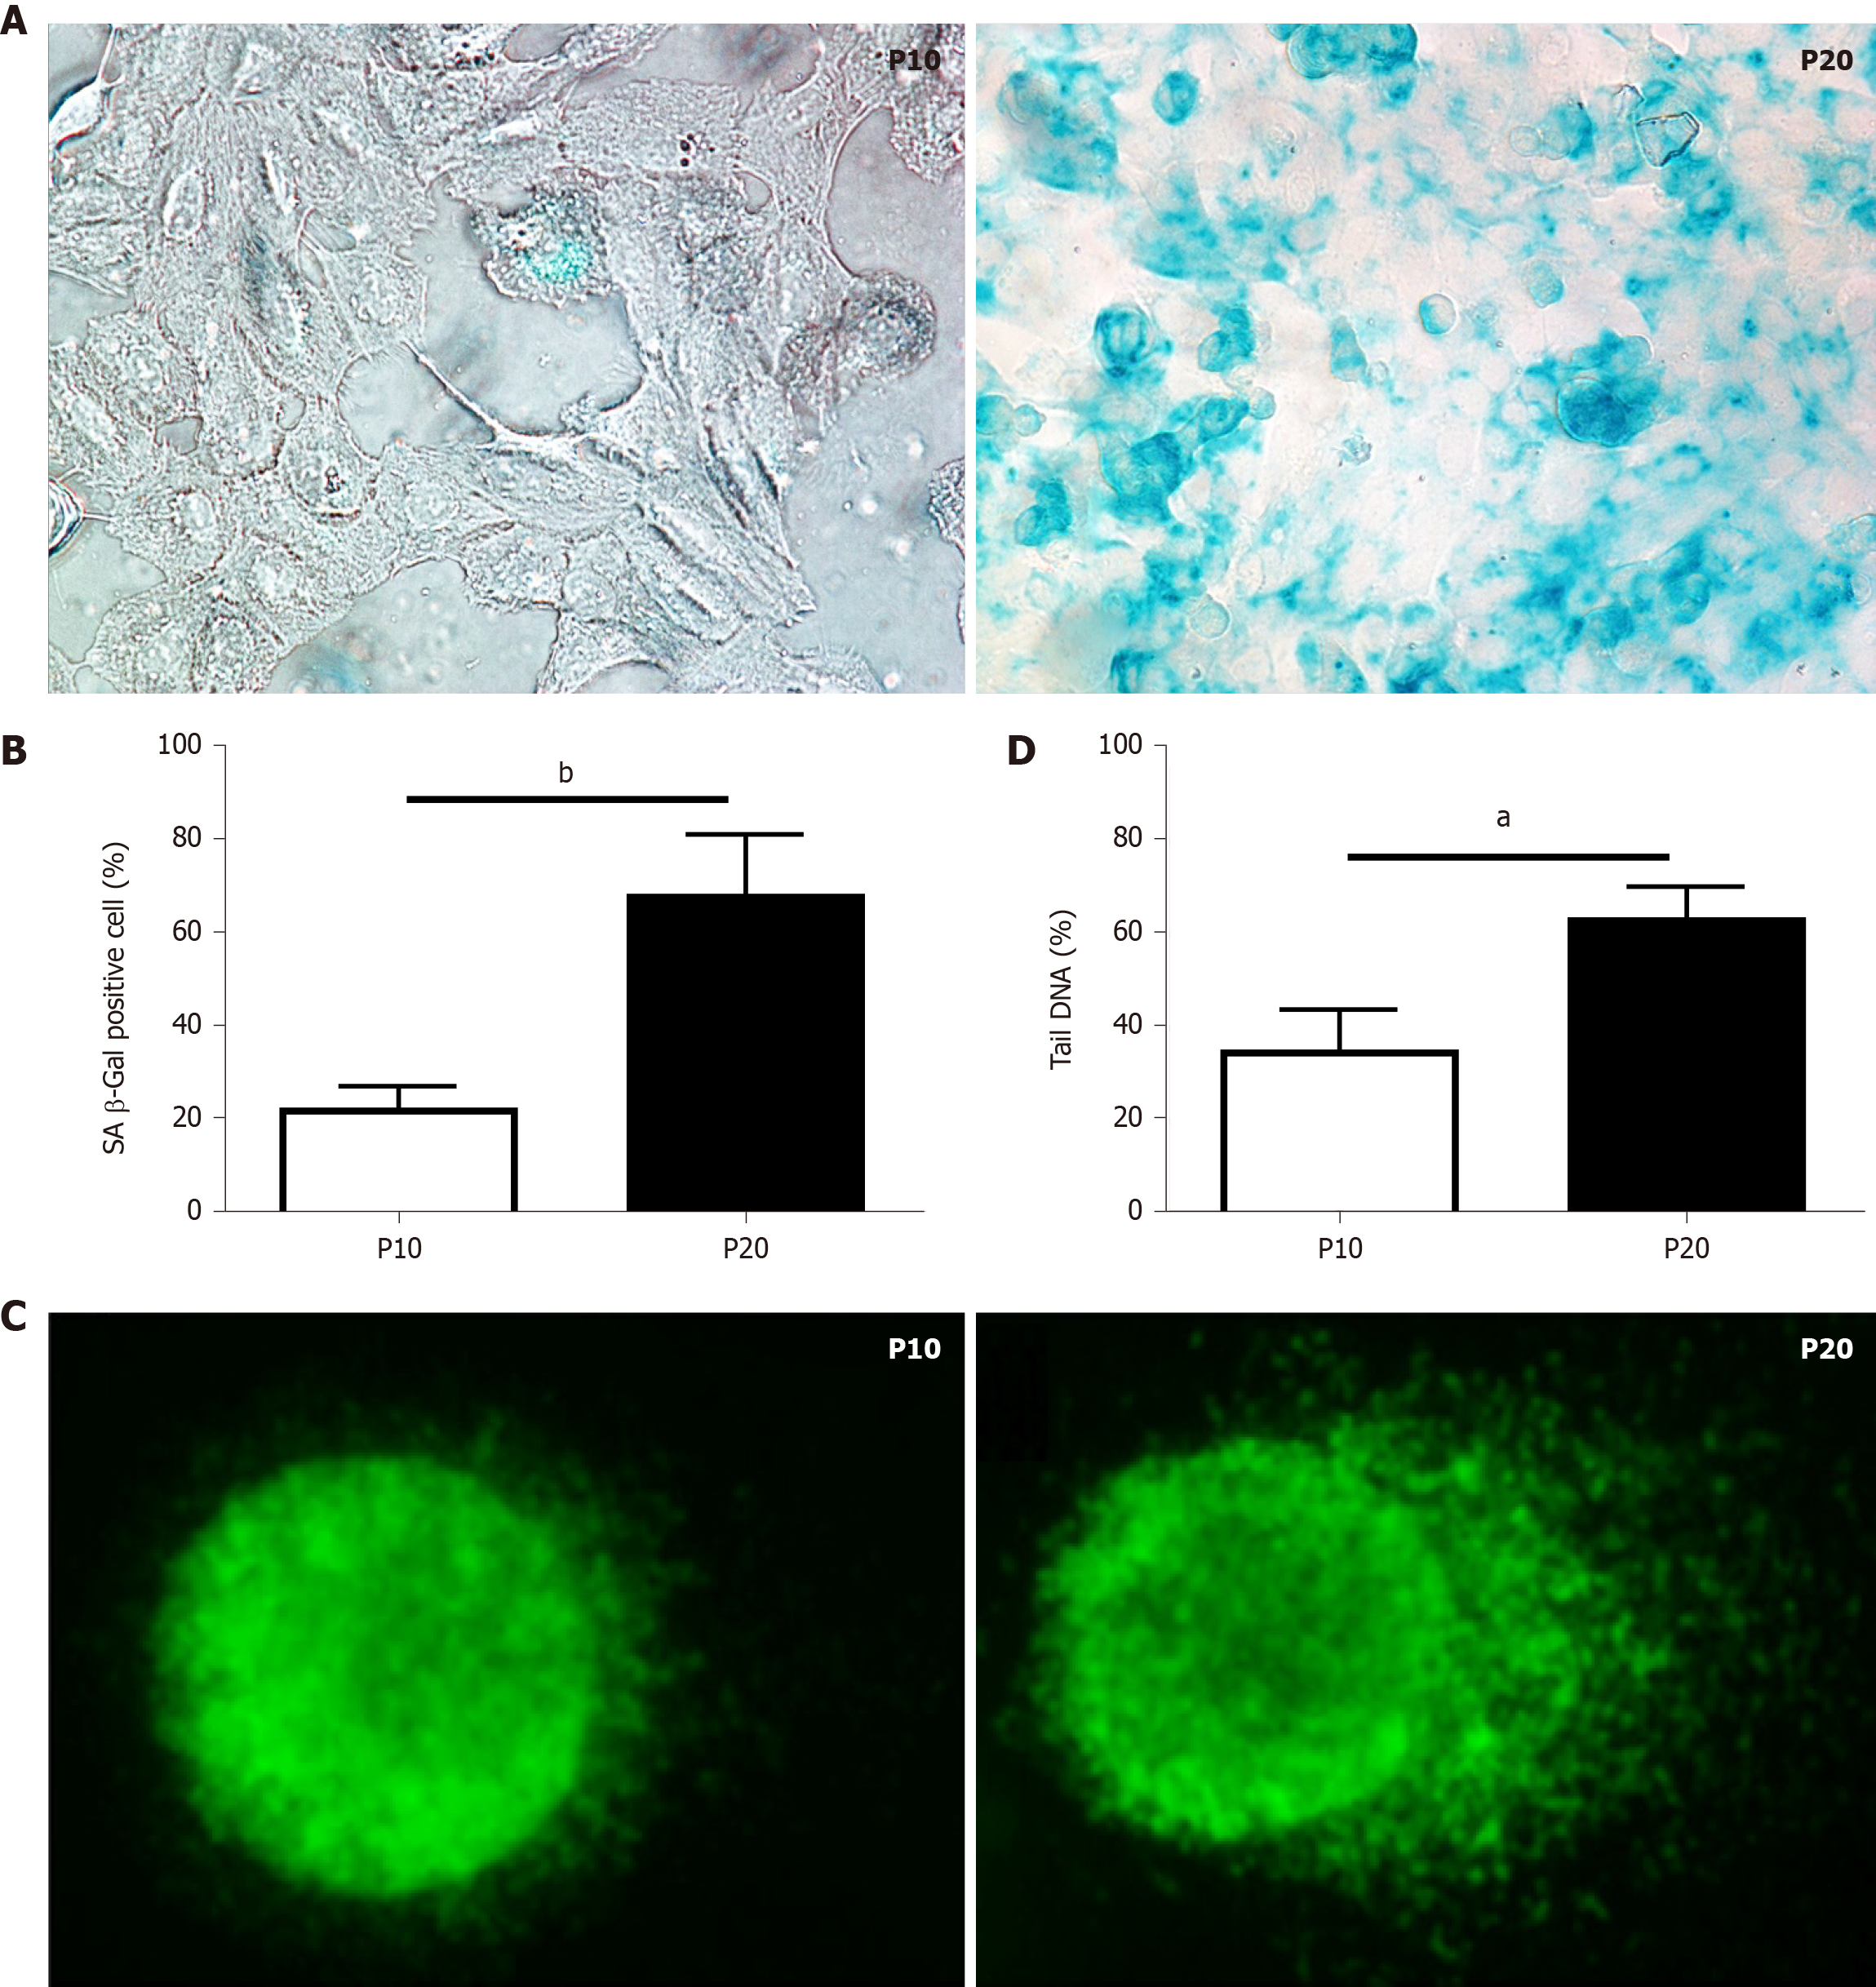
Figure 1 Characterization of markers of cellular senescence in HepaRG cells.
A: Senescence-associated β-galactosidase staining of HepaRG cells at passage 10 (P10) or P20. After staining, the cells were imaged by phase contrast microscopy. Micrographs are shown at magnification 200 ×; B: Quantitative analysis of positive β-galactosidase-stained cells in P10 and P20 HepaRG cells; C: Representative images of DNA damage analysis by the comet assay in P10 and P20 HepaRG cells. After staining, the cells were imaged by fluorescence microscopy. Micrographs are shown at magnification 600 ×; D: Quantitative analysis of DNA tails from 100 cells. Data in the graphs are represented as the mean ± SD of three independent experiments. Statistical differences were assessed by the Student’s t-test. aP < 0.05 vs P10; bP < 0.01 vs P10.
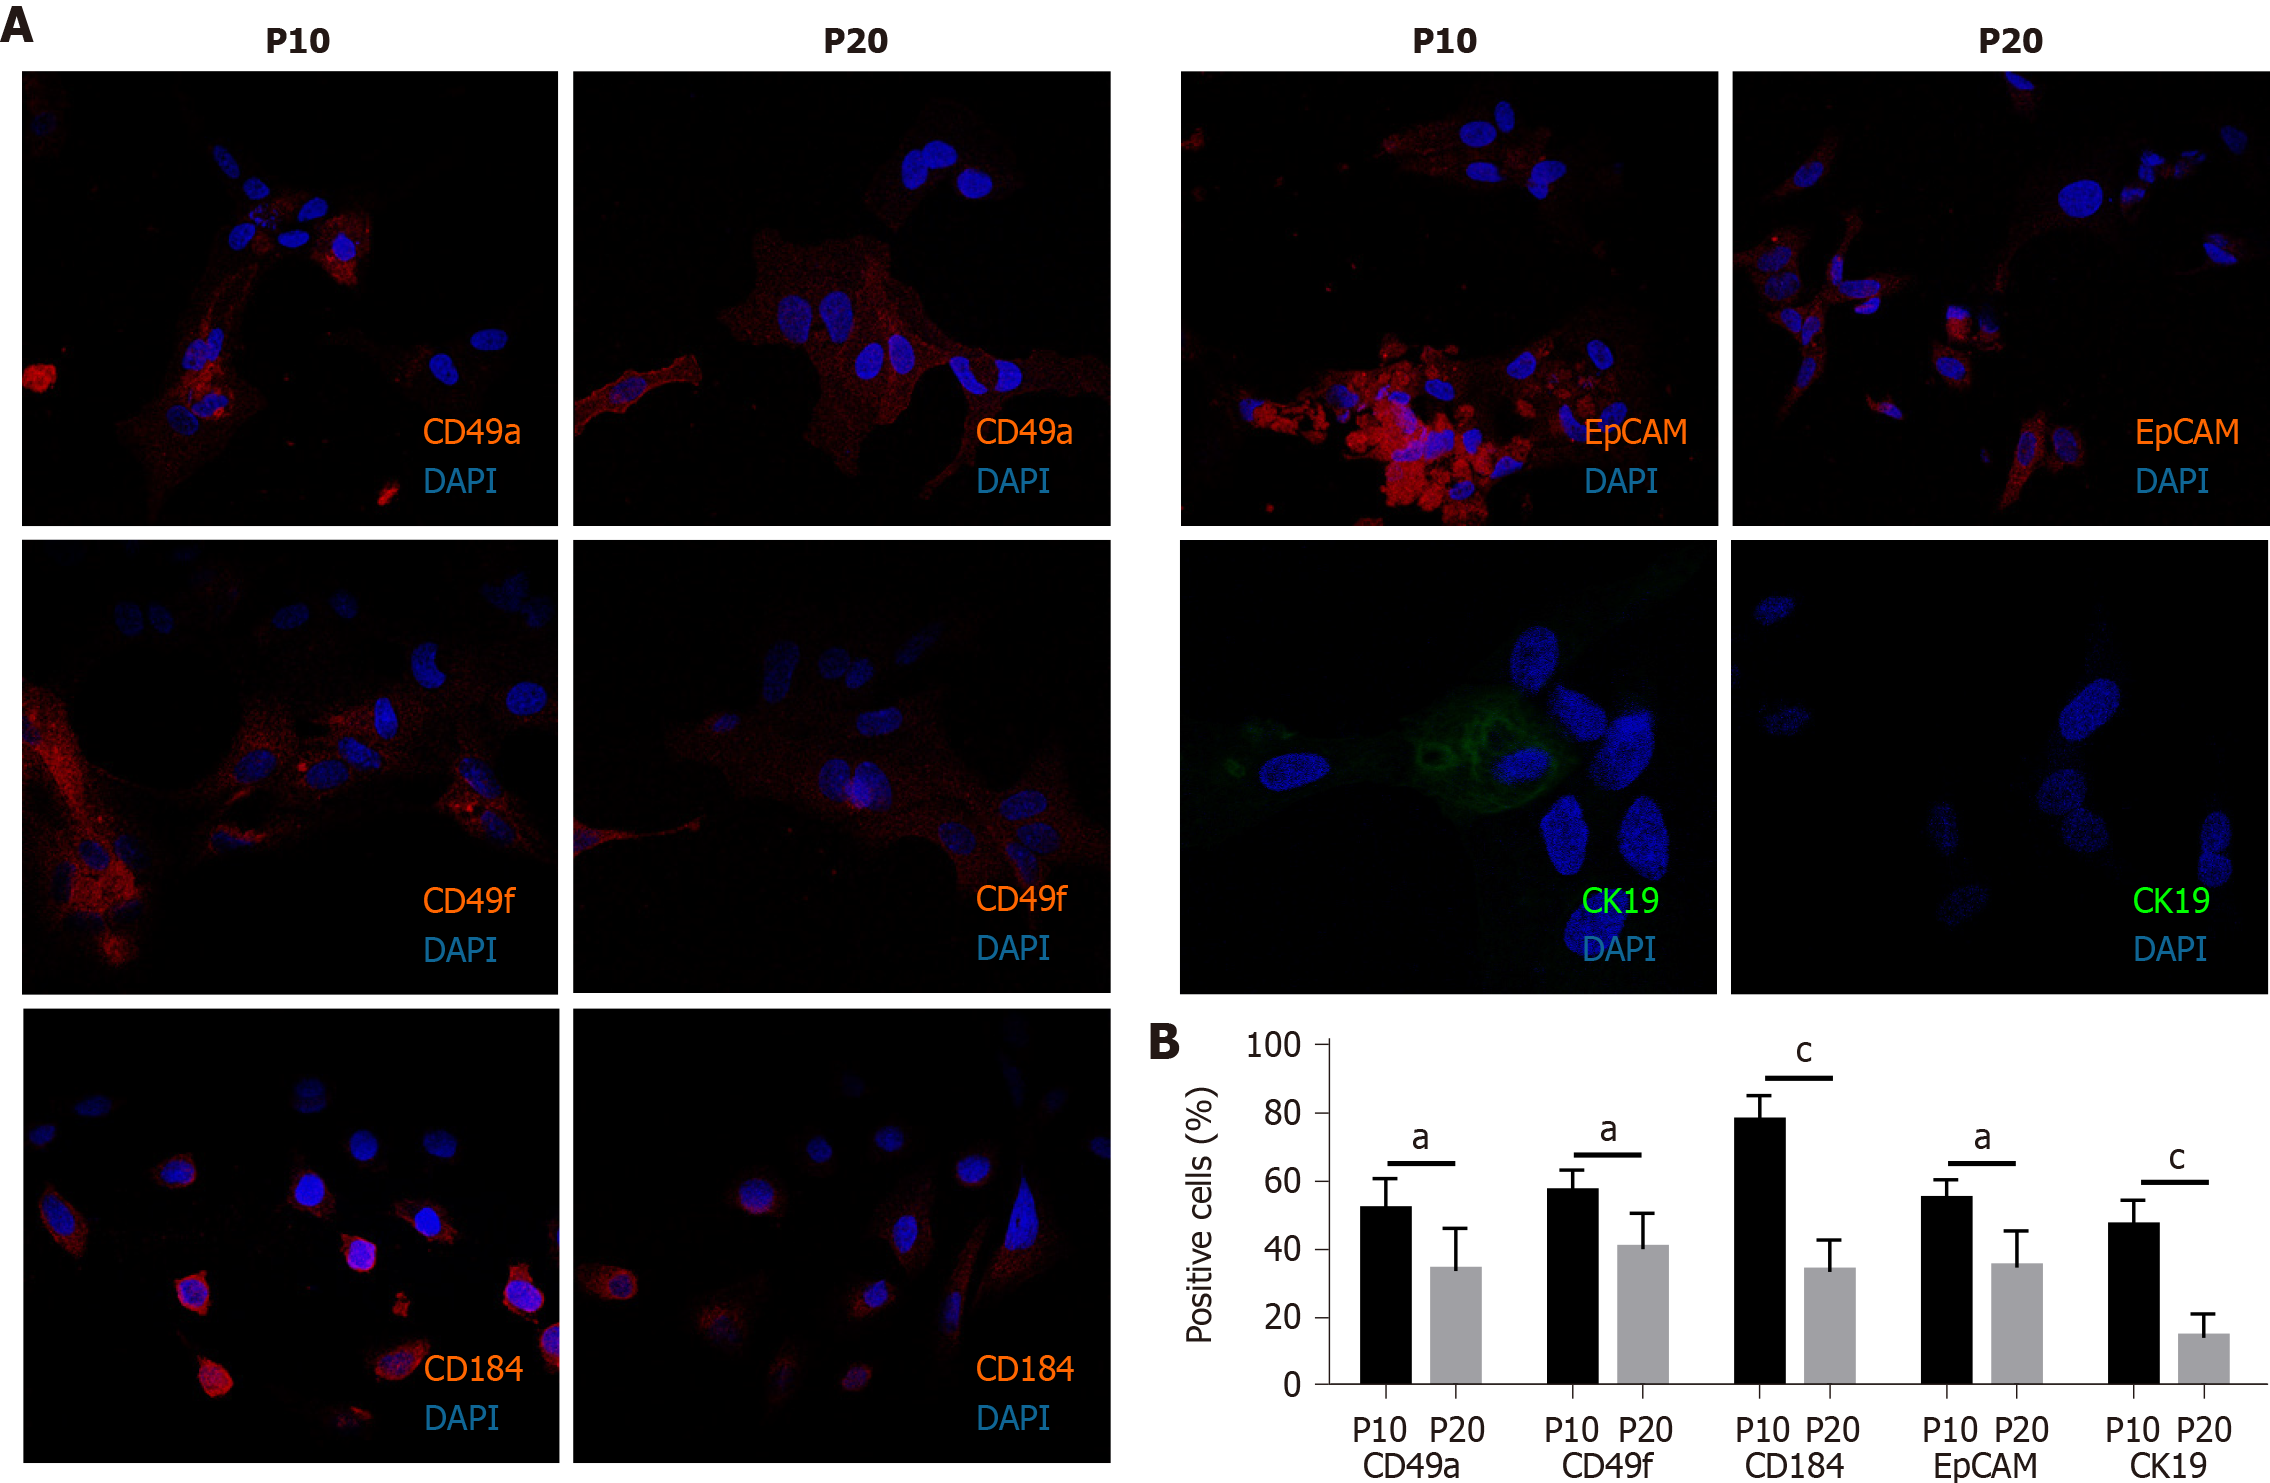
Figure 2 Expression of progenitor markers in HepaRG cells after the transdifferentiation process.
A: Representative immunofluorescence images of HepaRG cells at passage 10 (P10) or P20. After staining, the cells were imaged by confocal microscopy. Micrographs are shown at magnification 200 ×; B: Quantitative analysis of positively stained cells in P10 and P20 HepaRG cells. Data in the graphs are represented as the mean ± standard deviation of three independent experiments. Statistical differences were assessed by the Student’s t-test. aP < 0.05 vs P10; cP < 0.001 vs P10.
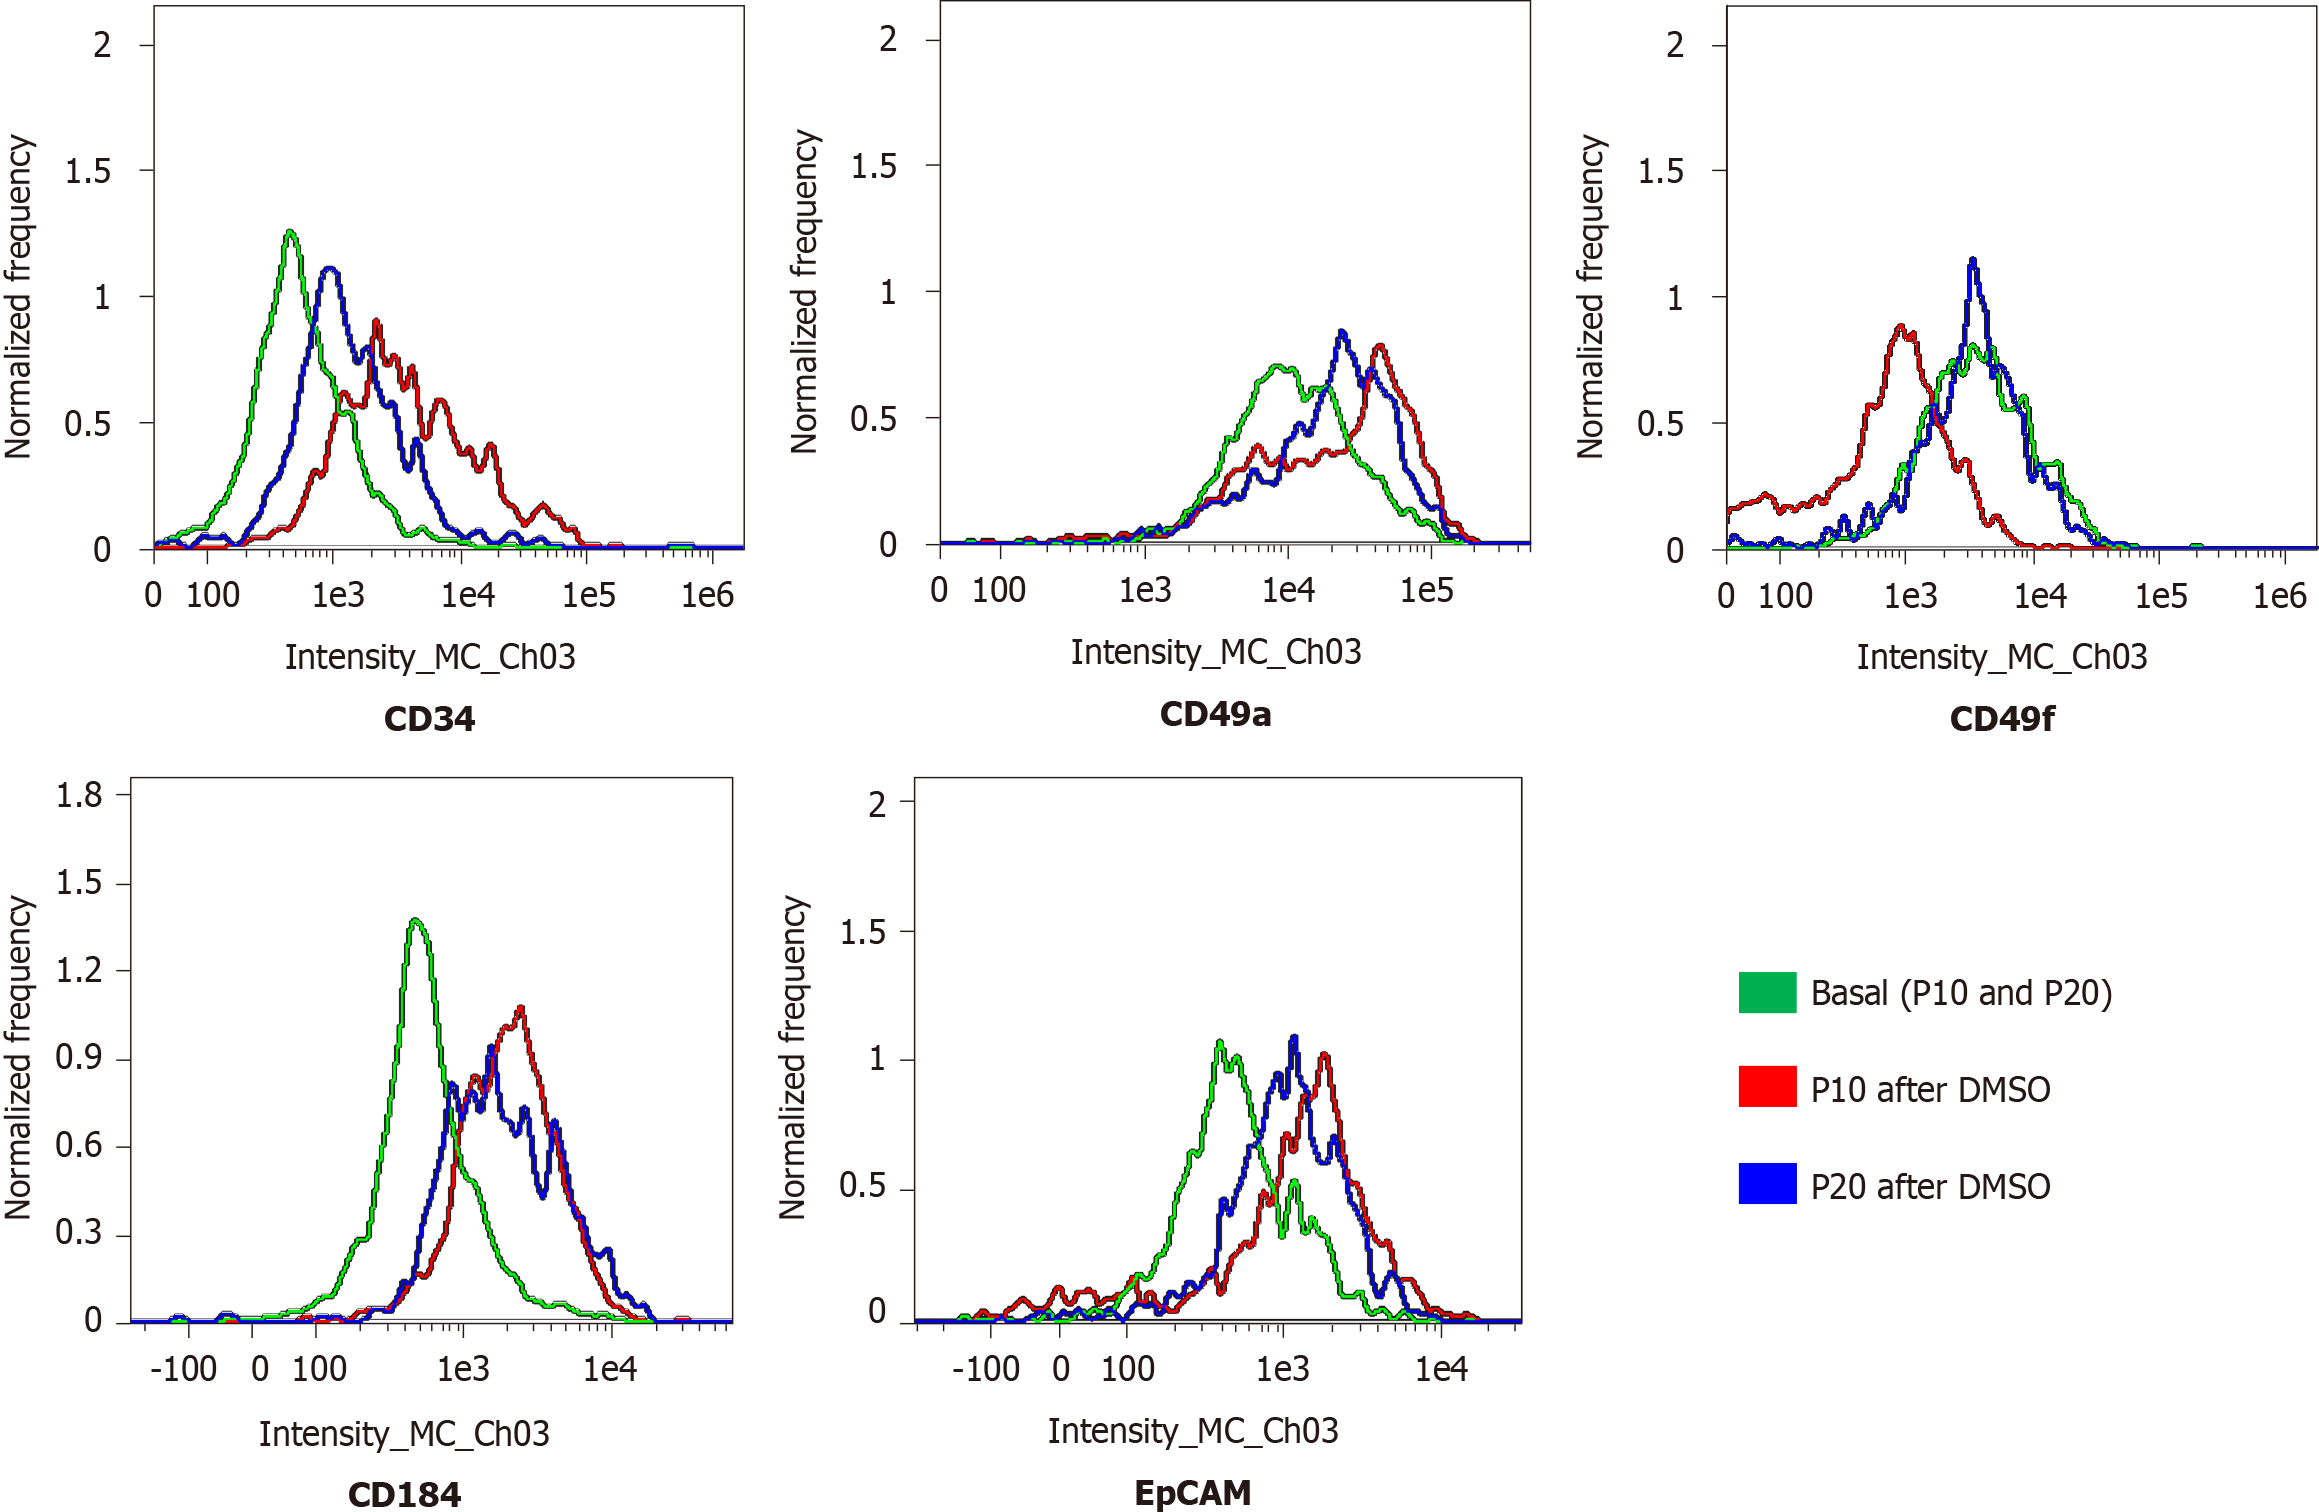
Figure 3 Expression of progenitor markers in HepaRG cells before and after the transdifferentiation process.
Flow cytometry histograms of HepaRG cells at passage 10 (P10) or P20 in basal conditions or after the transdifferentiation protocol (dimethyl sulfoxide). After staining, the cells were analyzed with flow cytometry.
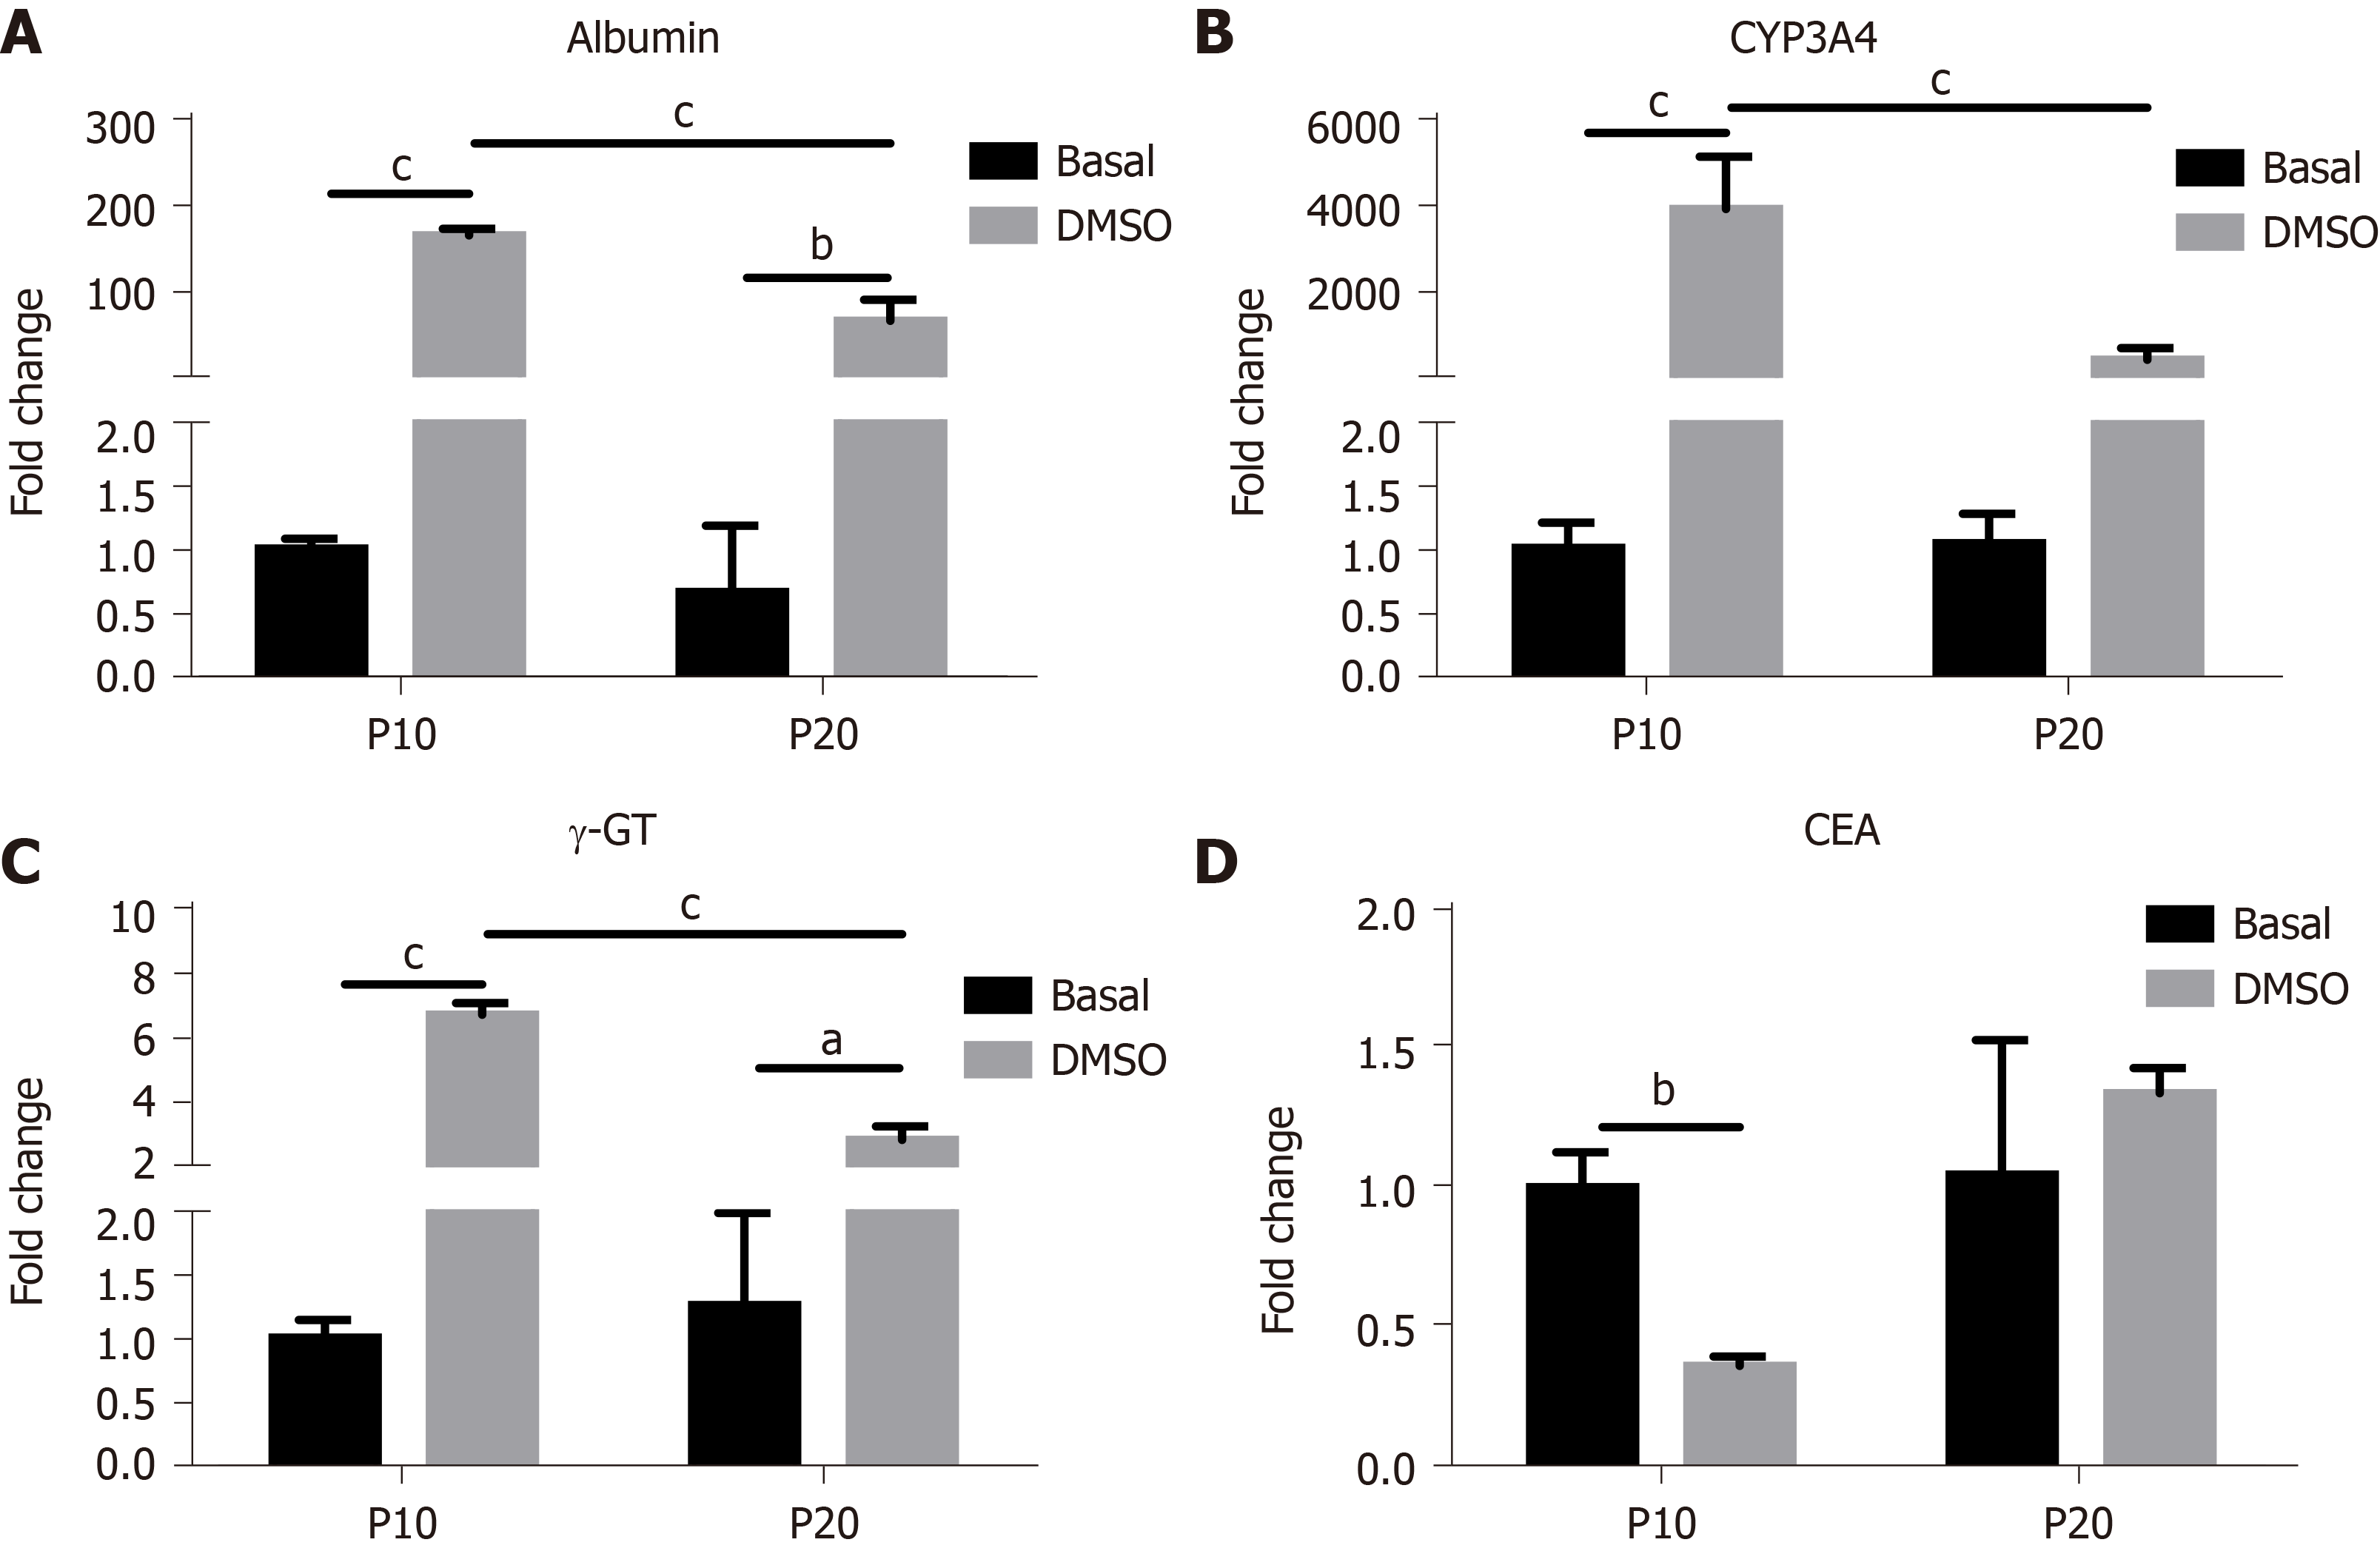
Figure 4 Gene expression analysis in HepaRG cells at passage 10 or passage 20 in basal conditions or after the transdifferentiation protocol (dimethyl sulfoxide).
A: mRNA level of albumin; B: Cytochrome P350 3A4 (CYP3A4); C: Gamma-glutamyl transpeptidase (γ-GT); D: Carcinoembryonic antigen (CEA) measured by reverse transcription-polymerase chain reaction. Data in the graphs are represented as the mean ± standard deviation of three independent experiments. Statistical differences were assessed by two-way analysis of variance followed by the Tukey test as the post hoc test. aP < 0.05; bP < 0.01; cP < 0.001. P10: Passage 10; P20: Passage 20; DMSO: Dimethyl sulfoxide.
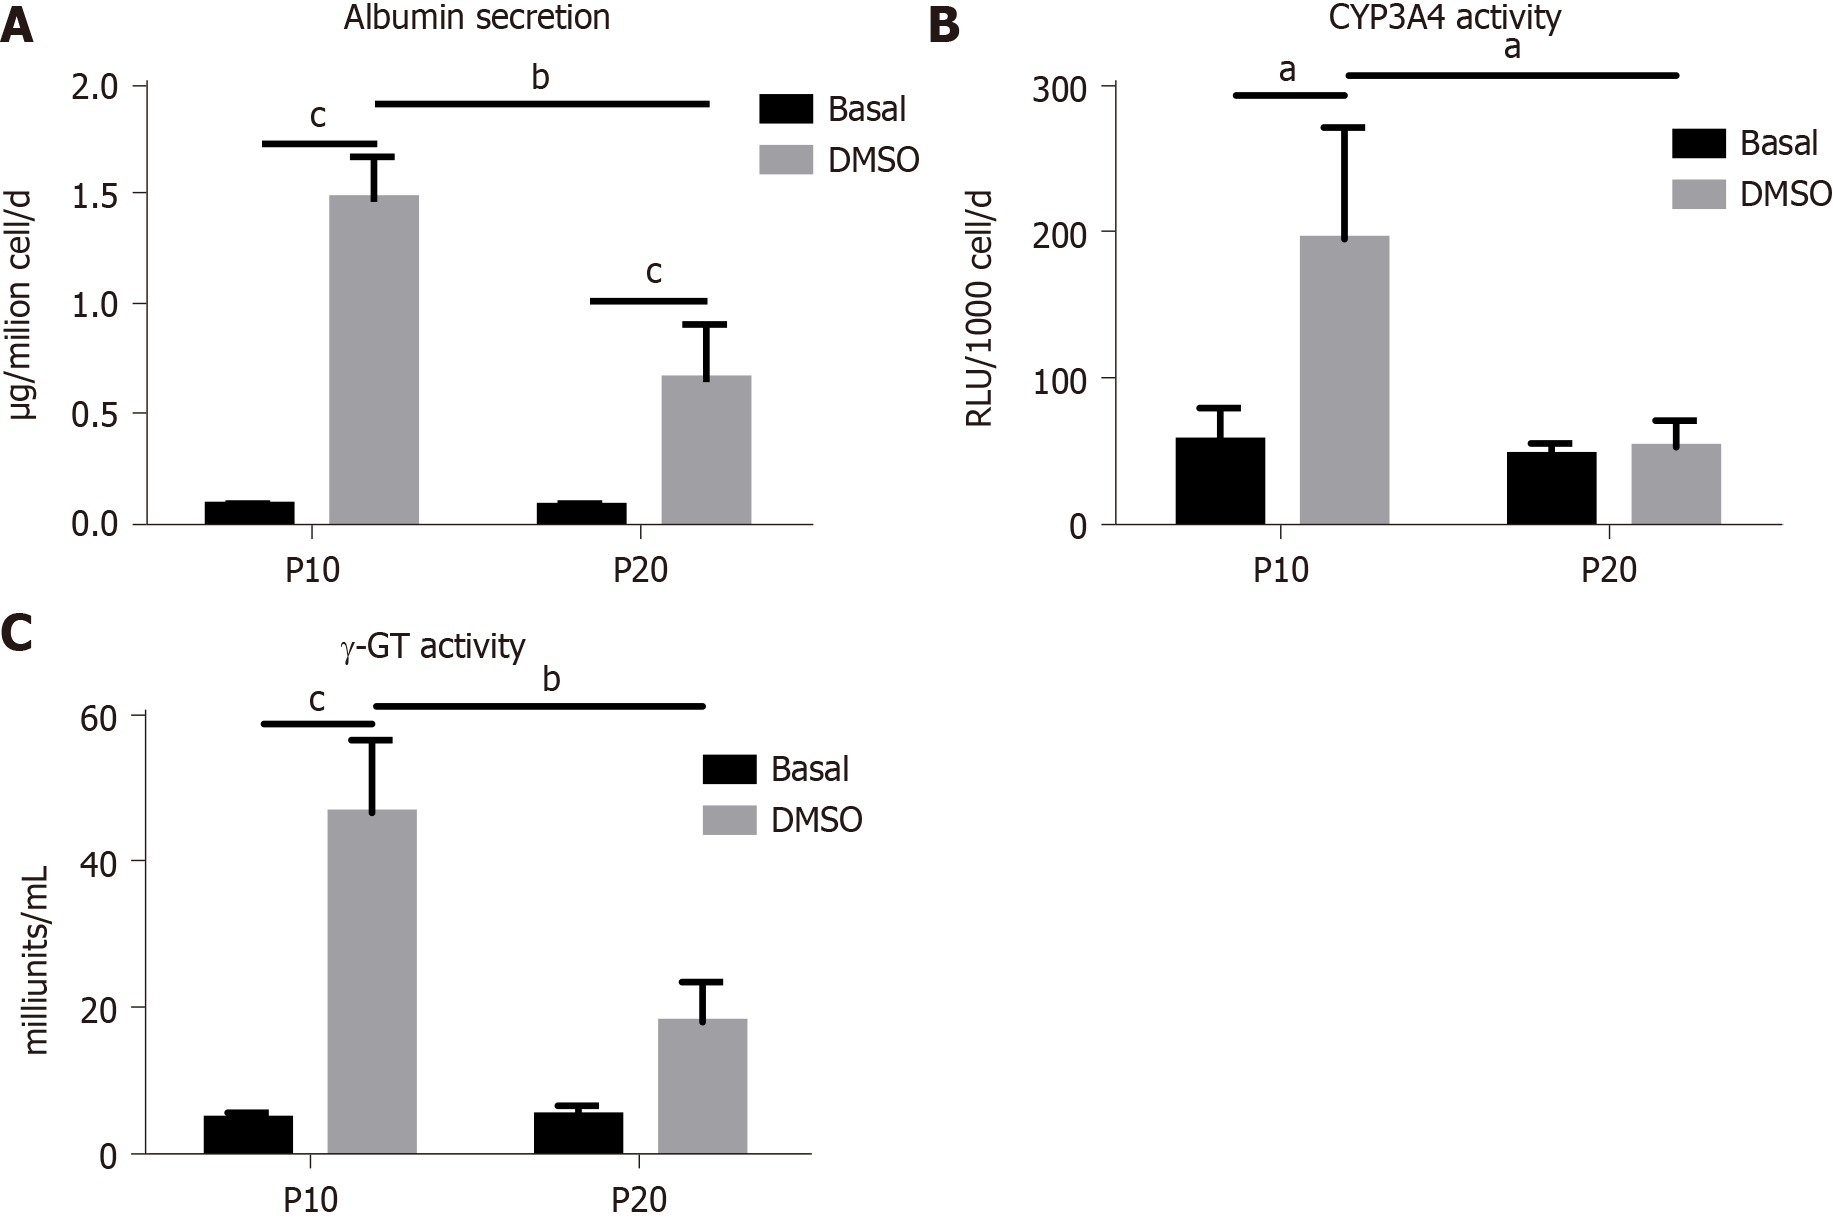
Figure 5 Functional tests in HepaRG cells at passage 10 or passage 20) in basal conditions or after the transdifferentiation protocol (dimethyl sulfoxide).
A: Albumin secretion; B: Cytochrome P350 3A4 (CYP3A4); C: Gamma-glutamyl transpeptidase (γ-GT) activities. Data in the graphs are represented as the mean ± standard deviation of three independent experiments. Statistical differences were assessed by two-way analysis of variance followed by the Tukey test as the post hoc test. aP < 0.05; bP < 0.01; cP < 0.001. P10: Passage 10; P20: Passage 20; DMSO: Dimethyl sulfoxide.
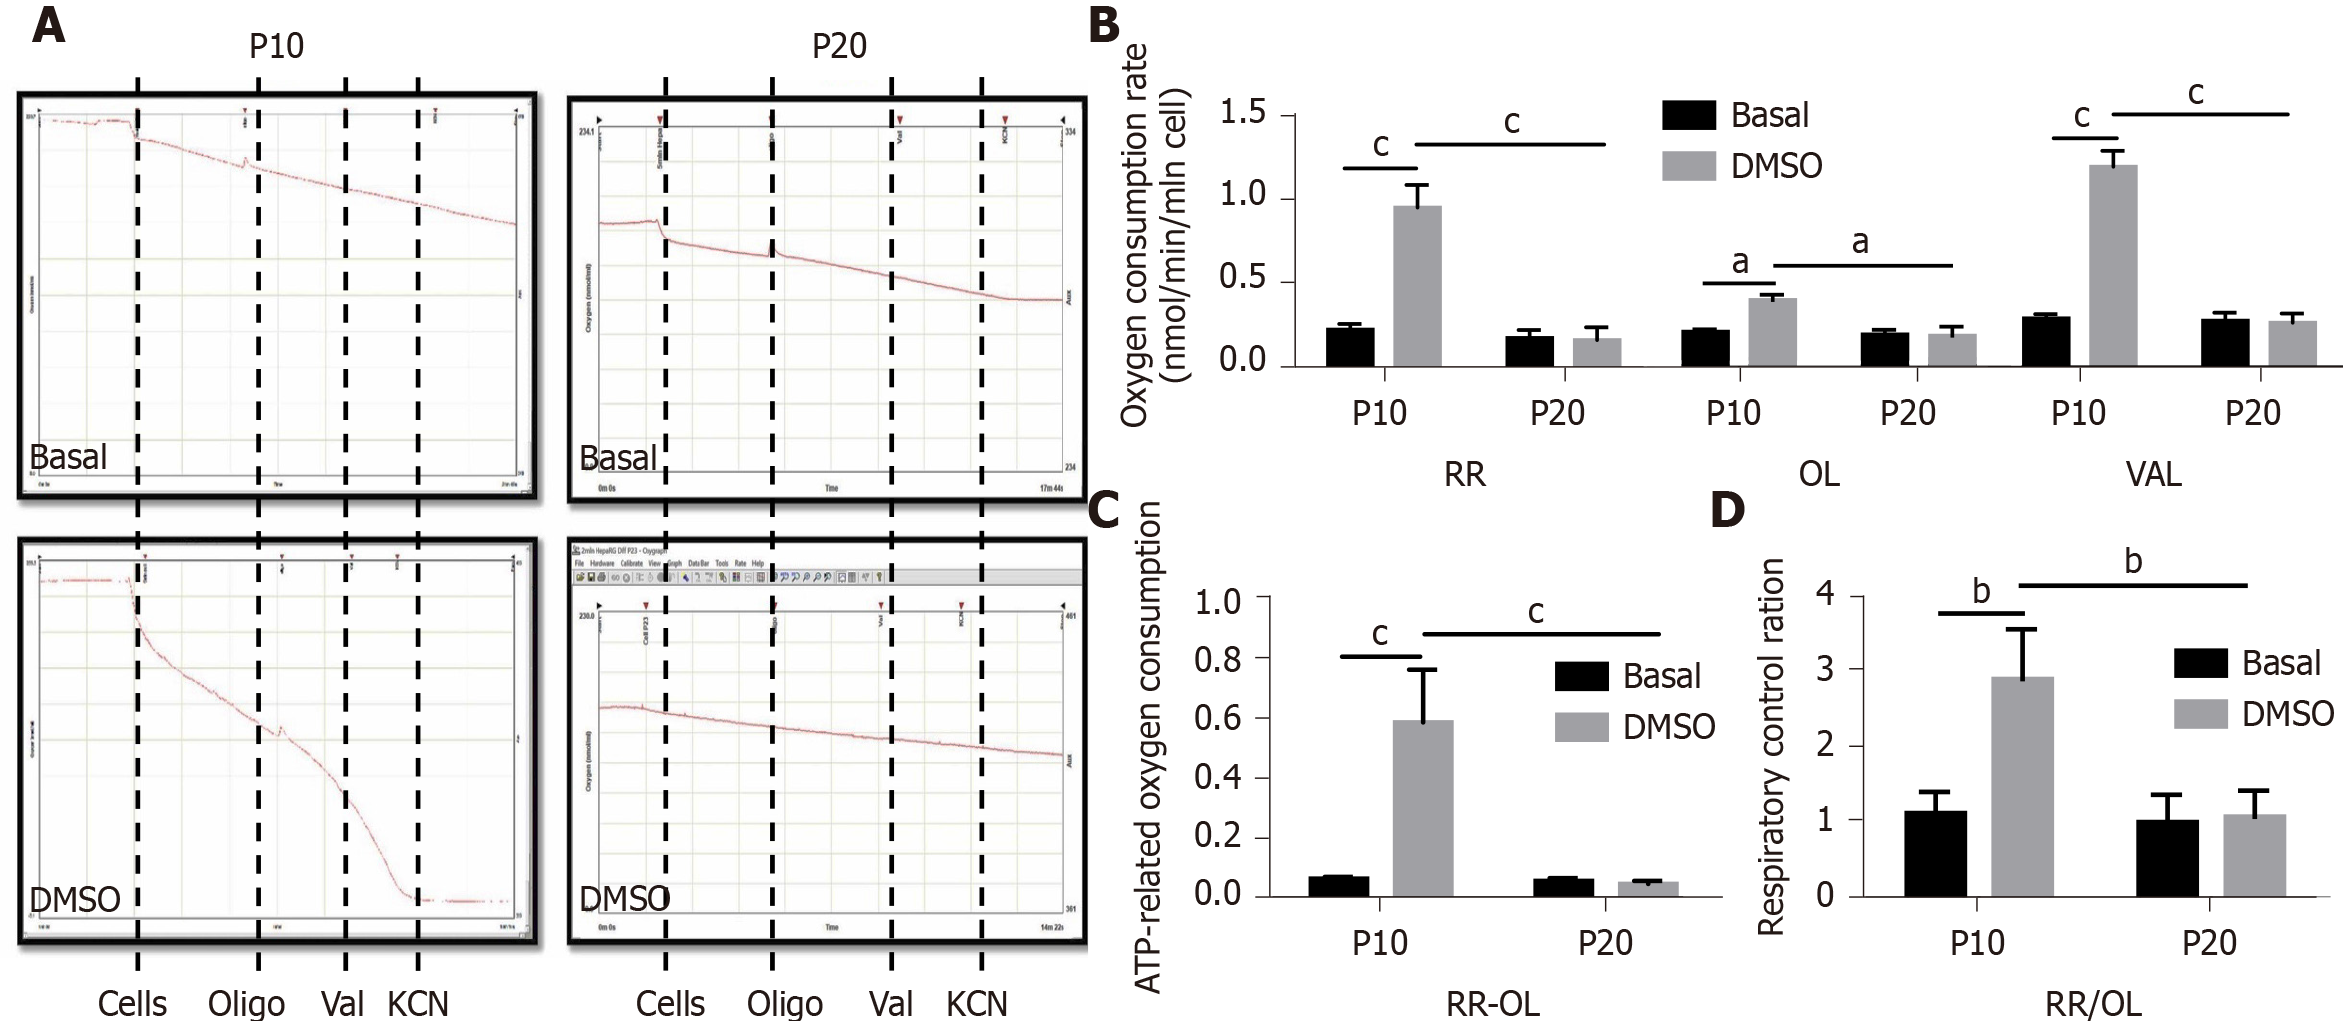
Figure 6 Measurement of mitochondrial respiration in HepaRG cells at passage 10 or passage 20 in basal conditions or after the transdifferentiation protocol (dimethyl sulfoxide).
A: Representative oxymetric traces of mitochondrial respiration in HepaRG cells. Where indicated, the following were added: 4 × 10⁶ HepaRG cells, 8 μg/mL oligomycin (OL), 2 μg/mL valinomycin (VAL), 3 mmol/L potassium cyanide (KCN). The continuous line represents the oxygen concentration measured every 0.1 s throughout the time-course of the assay; B: Representative graph of the normalized and KCN-insensitive-corrected oxygen consumption rates measured under resting respiration (RR) conditions, in the presence of OL and in the presence of VAL (see panel A); C: ATP-dependent oxygen consumption measured as absolute difference between that obtained in the absence and that in the presence of oligomycin (RR-OL); D: Respiratory control ratios obtained dividing the oxygen consumption rates measured under resting conditions by that in the presence of oligomycin (RR/OL). Data in the graphs are represented as the mean ± standard deviation of three independent experiments. Statistical differences were assessed by two-way analysis of variance followed by the Tukey’s test as the post hoc test. aP < 0.05; bP < 0.01; cP < 0.001. DMSO: Dimethyl sulfoxide; P10: Passage 10; P20: Passage 20.
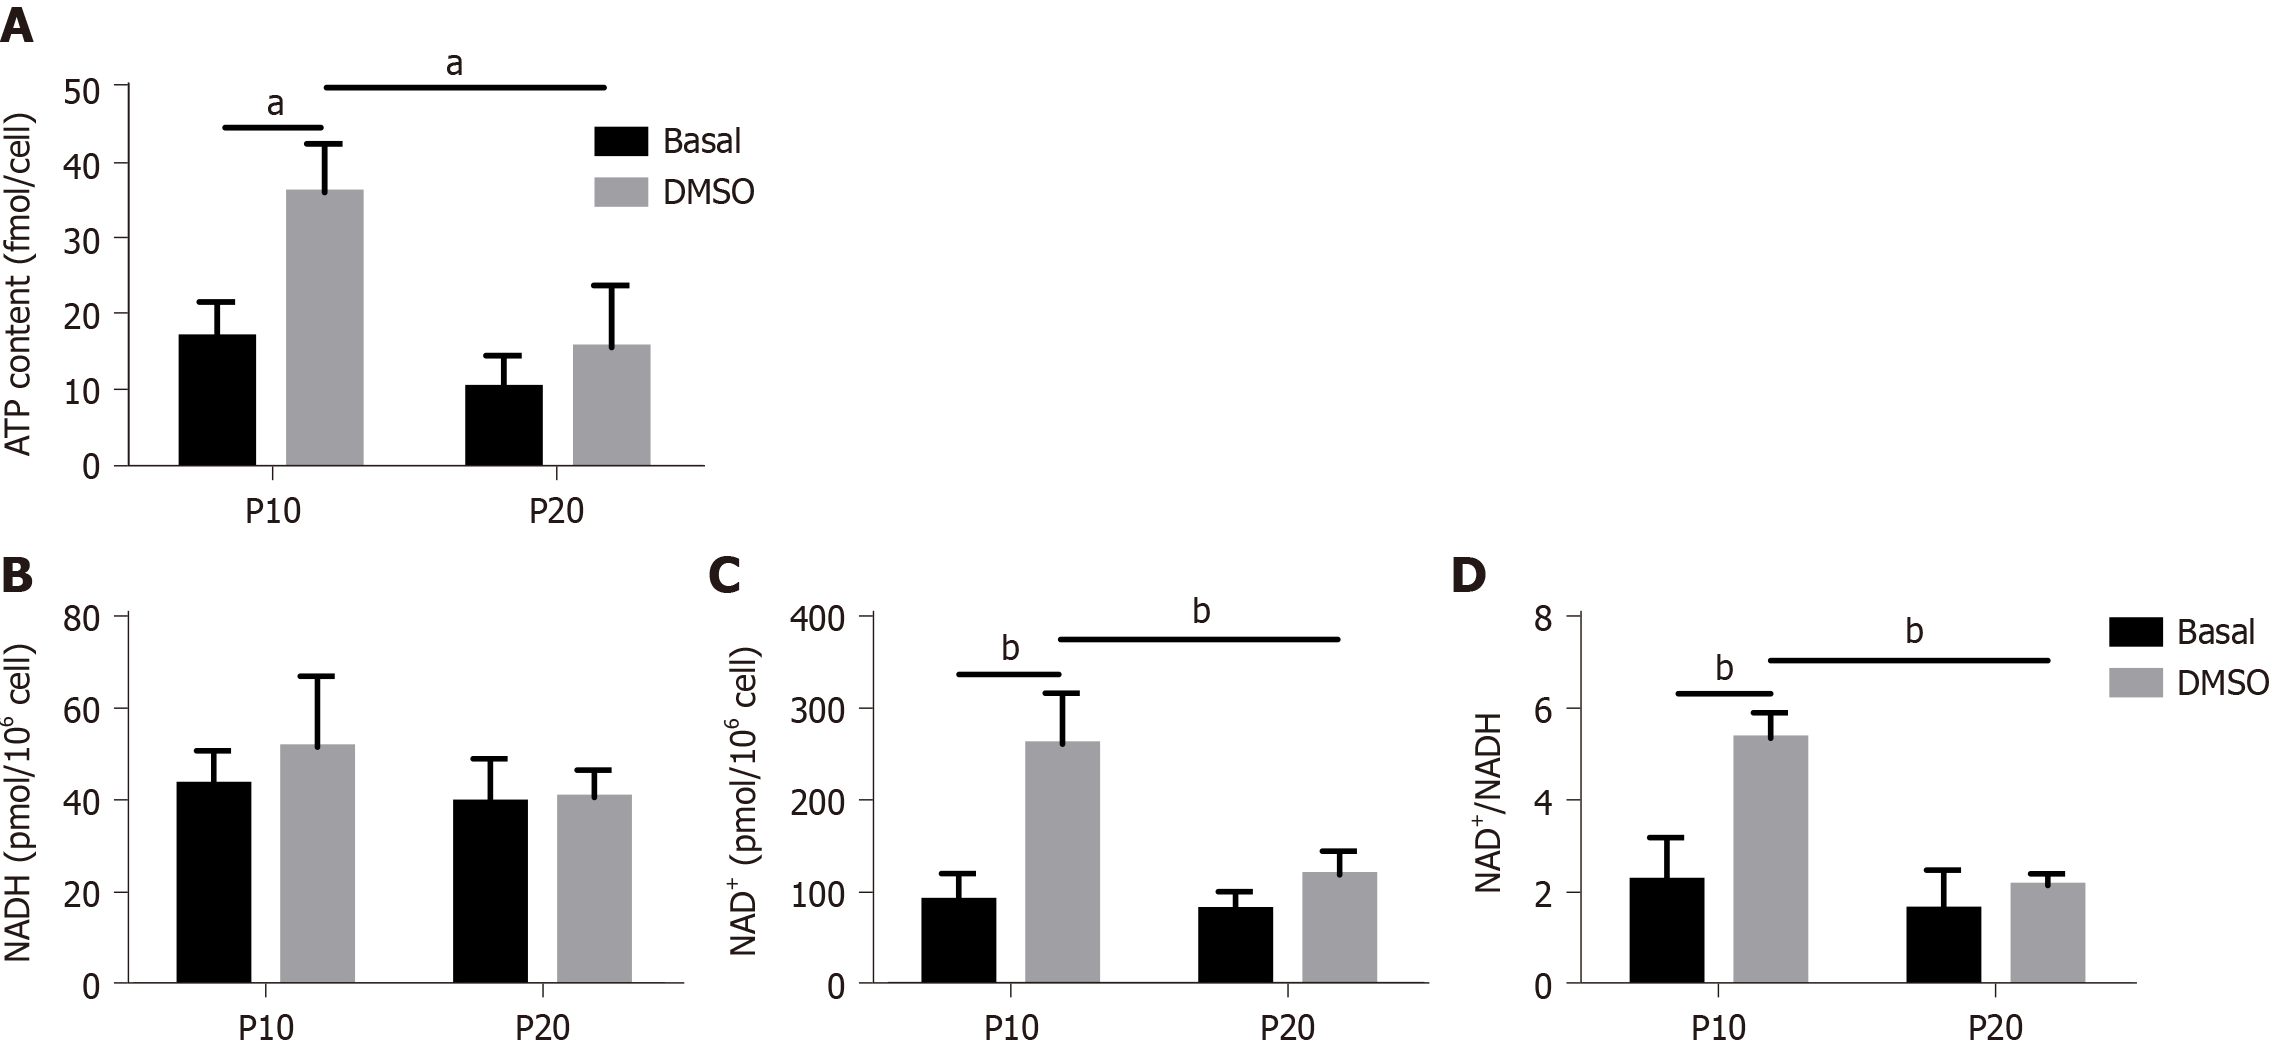
Figure 7 ATP and nicotinamide adenine dinucleotide (NAD)/NAD with hydrogen content in HepaRG cells at passage 10 or passage 20 in basal conditions or after the transdifferentiation protocol (dimethyl sulfoxide).
A: Cellular ATP content was expressed as ATP concentration/cells; B: Intracellular nicotinamide adenine dinucleotide (NAD+) and NAD with hydrogen (NADH) were extracted, and NAD+ and NADH levels were measured using a microplate reader. NAD+/NADH ratio was calculated based on the concentration of NAD+ and NADH. Data in the graphs are represented as the mean ± standard deviation of three independent experiments. Statistical differences were assessed by two-way analysis of variance followed by the Tukey’s test as the post hoc test. aP < 0.05; bP < 0.01. DMSO: Dimethyl sulfoxide; P10: Passage 10; P20: Passage 20.
- Citation: Bellanti F, di Bello G, Tamborra R, Amatruda M, Lo Buglio A, Dobrakowski M, Kasperczyk A, Kasperczyk S, Serviddio G, Vendemiale G. Impact of senescence on the transdifferentiation process of human hepatic progenitor-like cells. World J Stem Cells 2021; 13(10): 1595-1609
- URL: https://www.wjgnet.com/1948-0210/full/v13/i10/1595.htm
- DOI: https://dx.doi.org/10.4252/wjsc.v13.i10.1595


