Copyright
©The Author(s) 2021.
World J Stem Cells. Oct 26, 2021; 13(10): 1580-1594
Published online Oct 26, 2021. doi: 10.4252/wjsc.v13.i10.1580
Published online Oct 26, 2021. doi: 10.4252/wjsc.v13.i10.1580
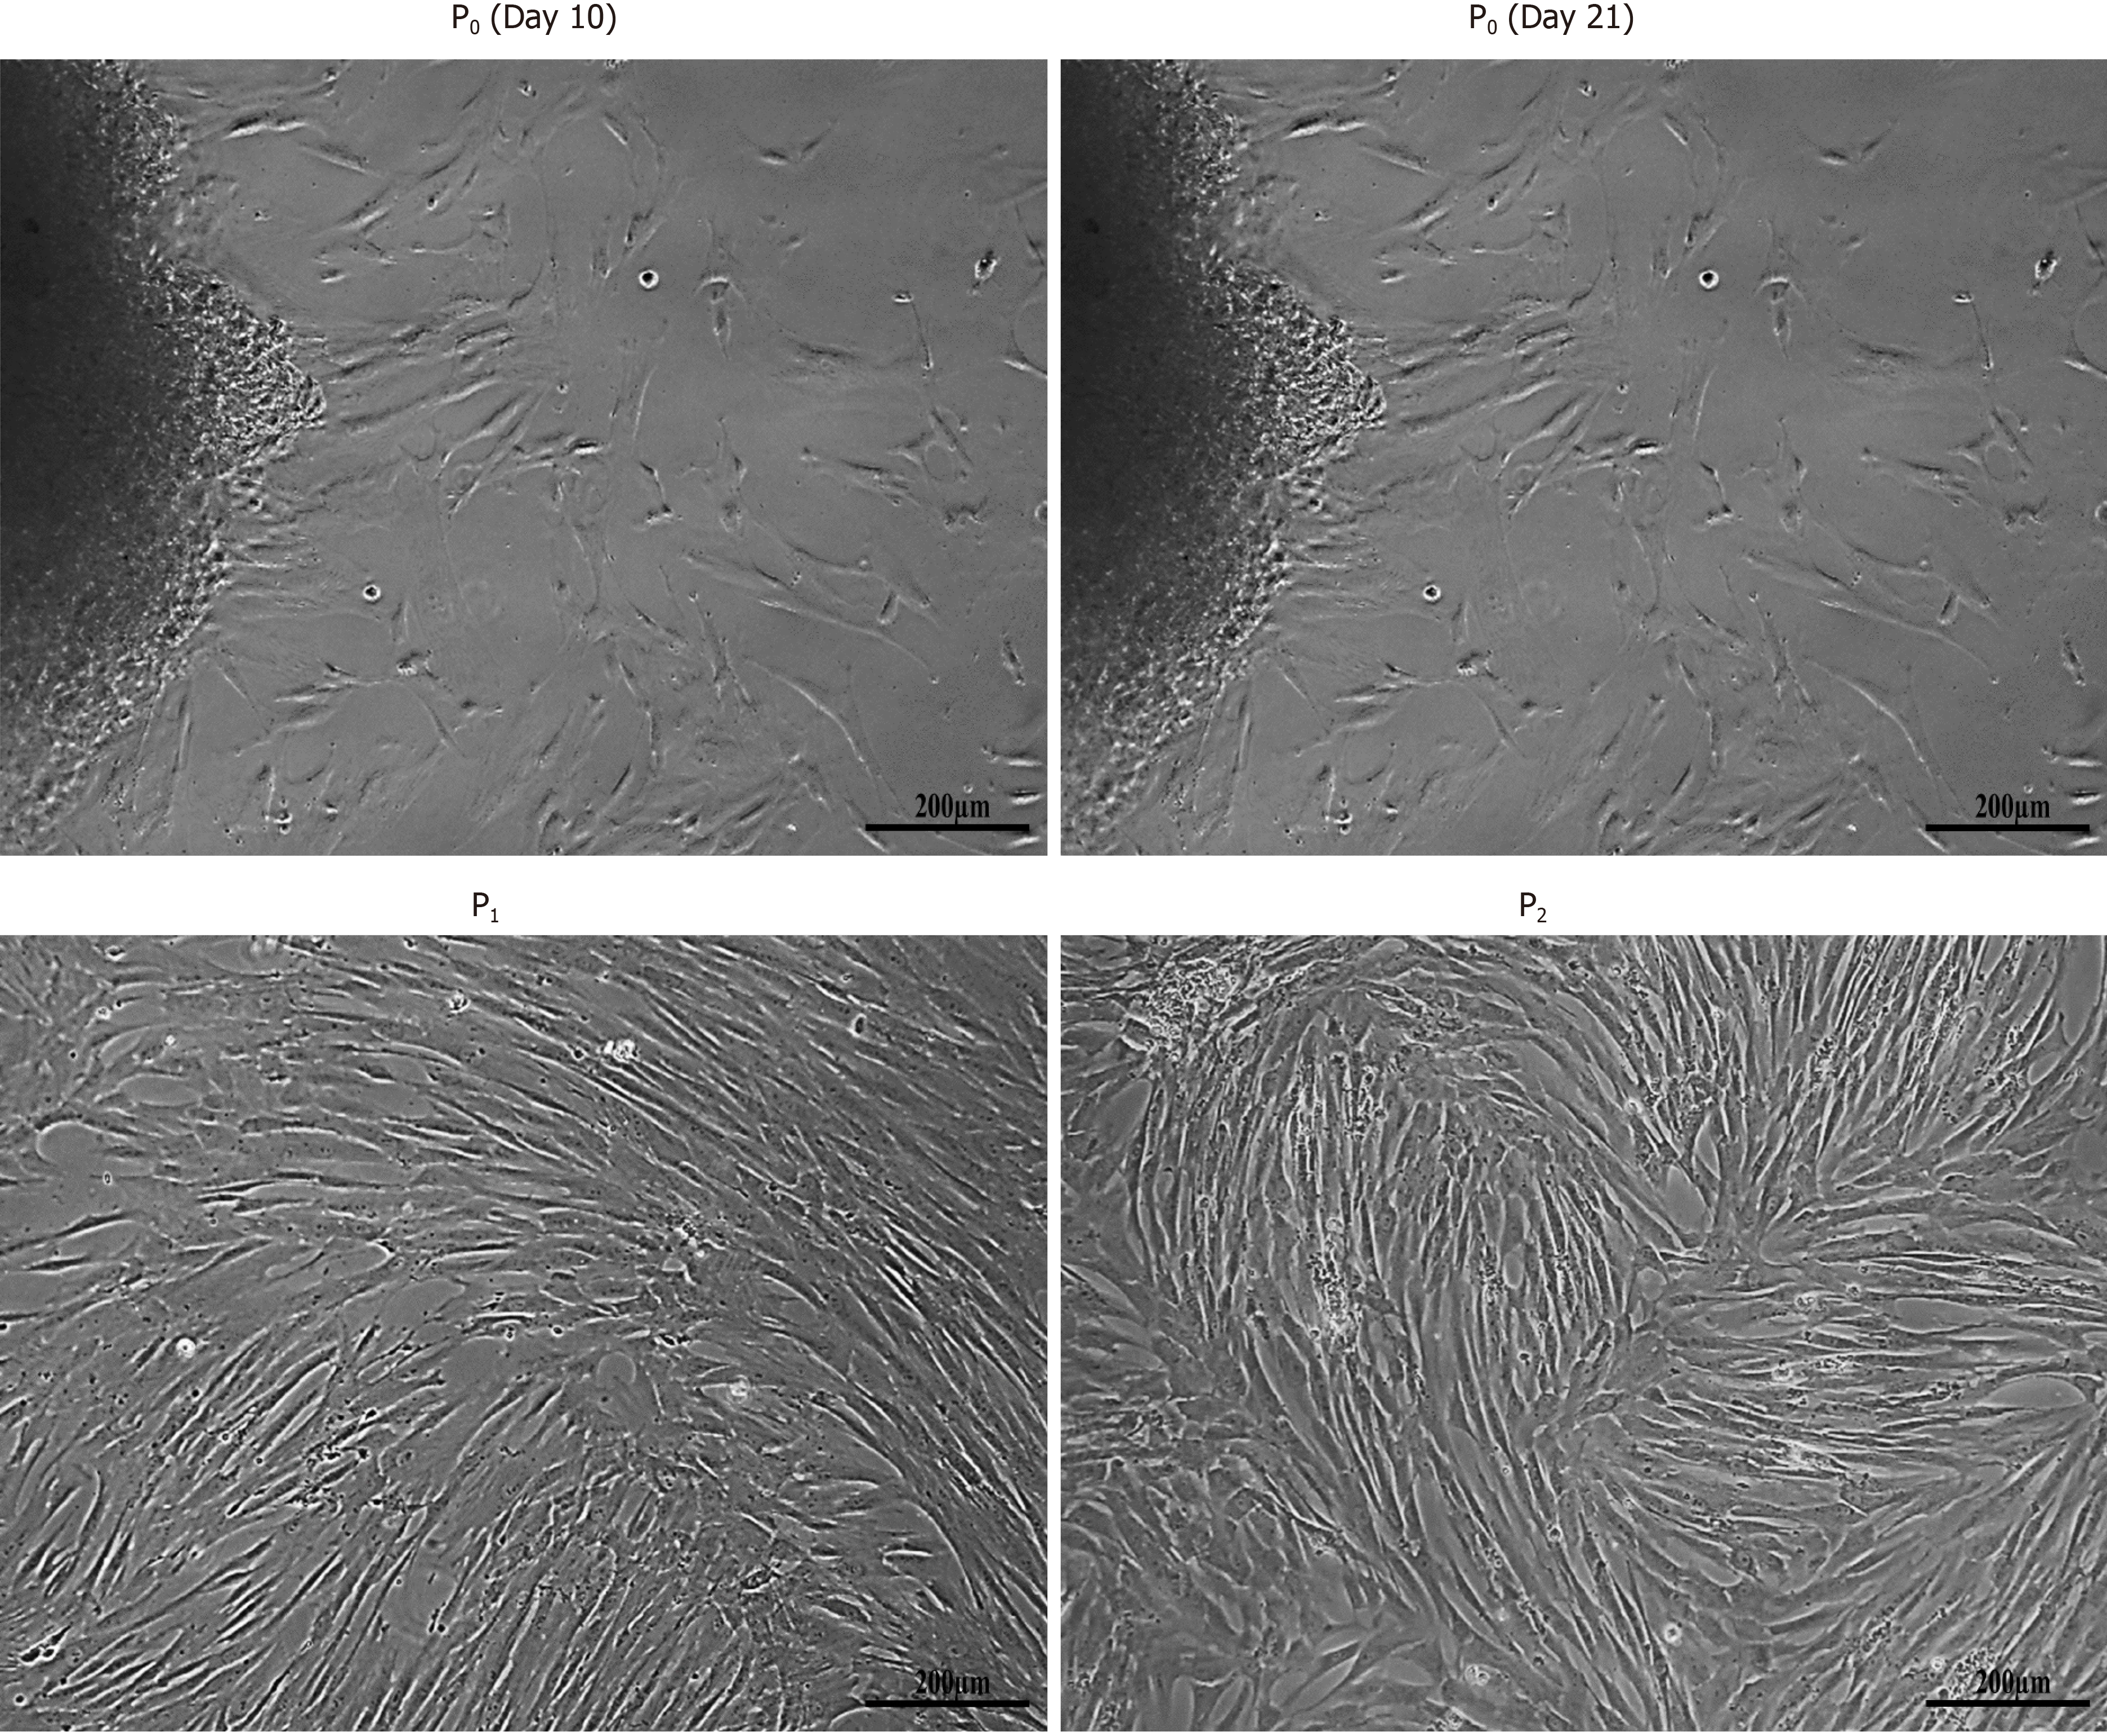
Figure 1 Isolation of human umbilical cord-mesenchymal stem cells.
Morphological observations of human umbilical cord-mesenchymal stem cells showing passage 0 (P0) cells at day 10 and day 21 with cells migrating towards the periphery of the adherent tissue, and passage 1 (P1) and passage 2 (P2) cells with homogeneous population showing fusiform- and fibroblast-like appearance after sub-culturing. All images were taken under phase contrast at 10× magnification.
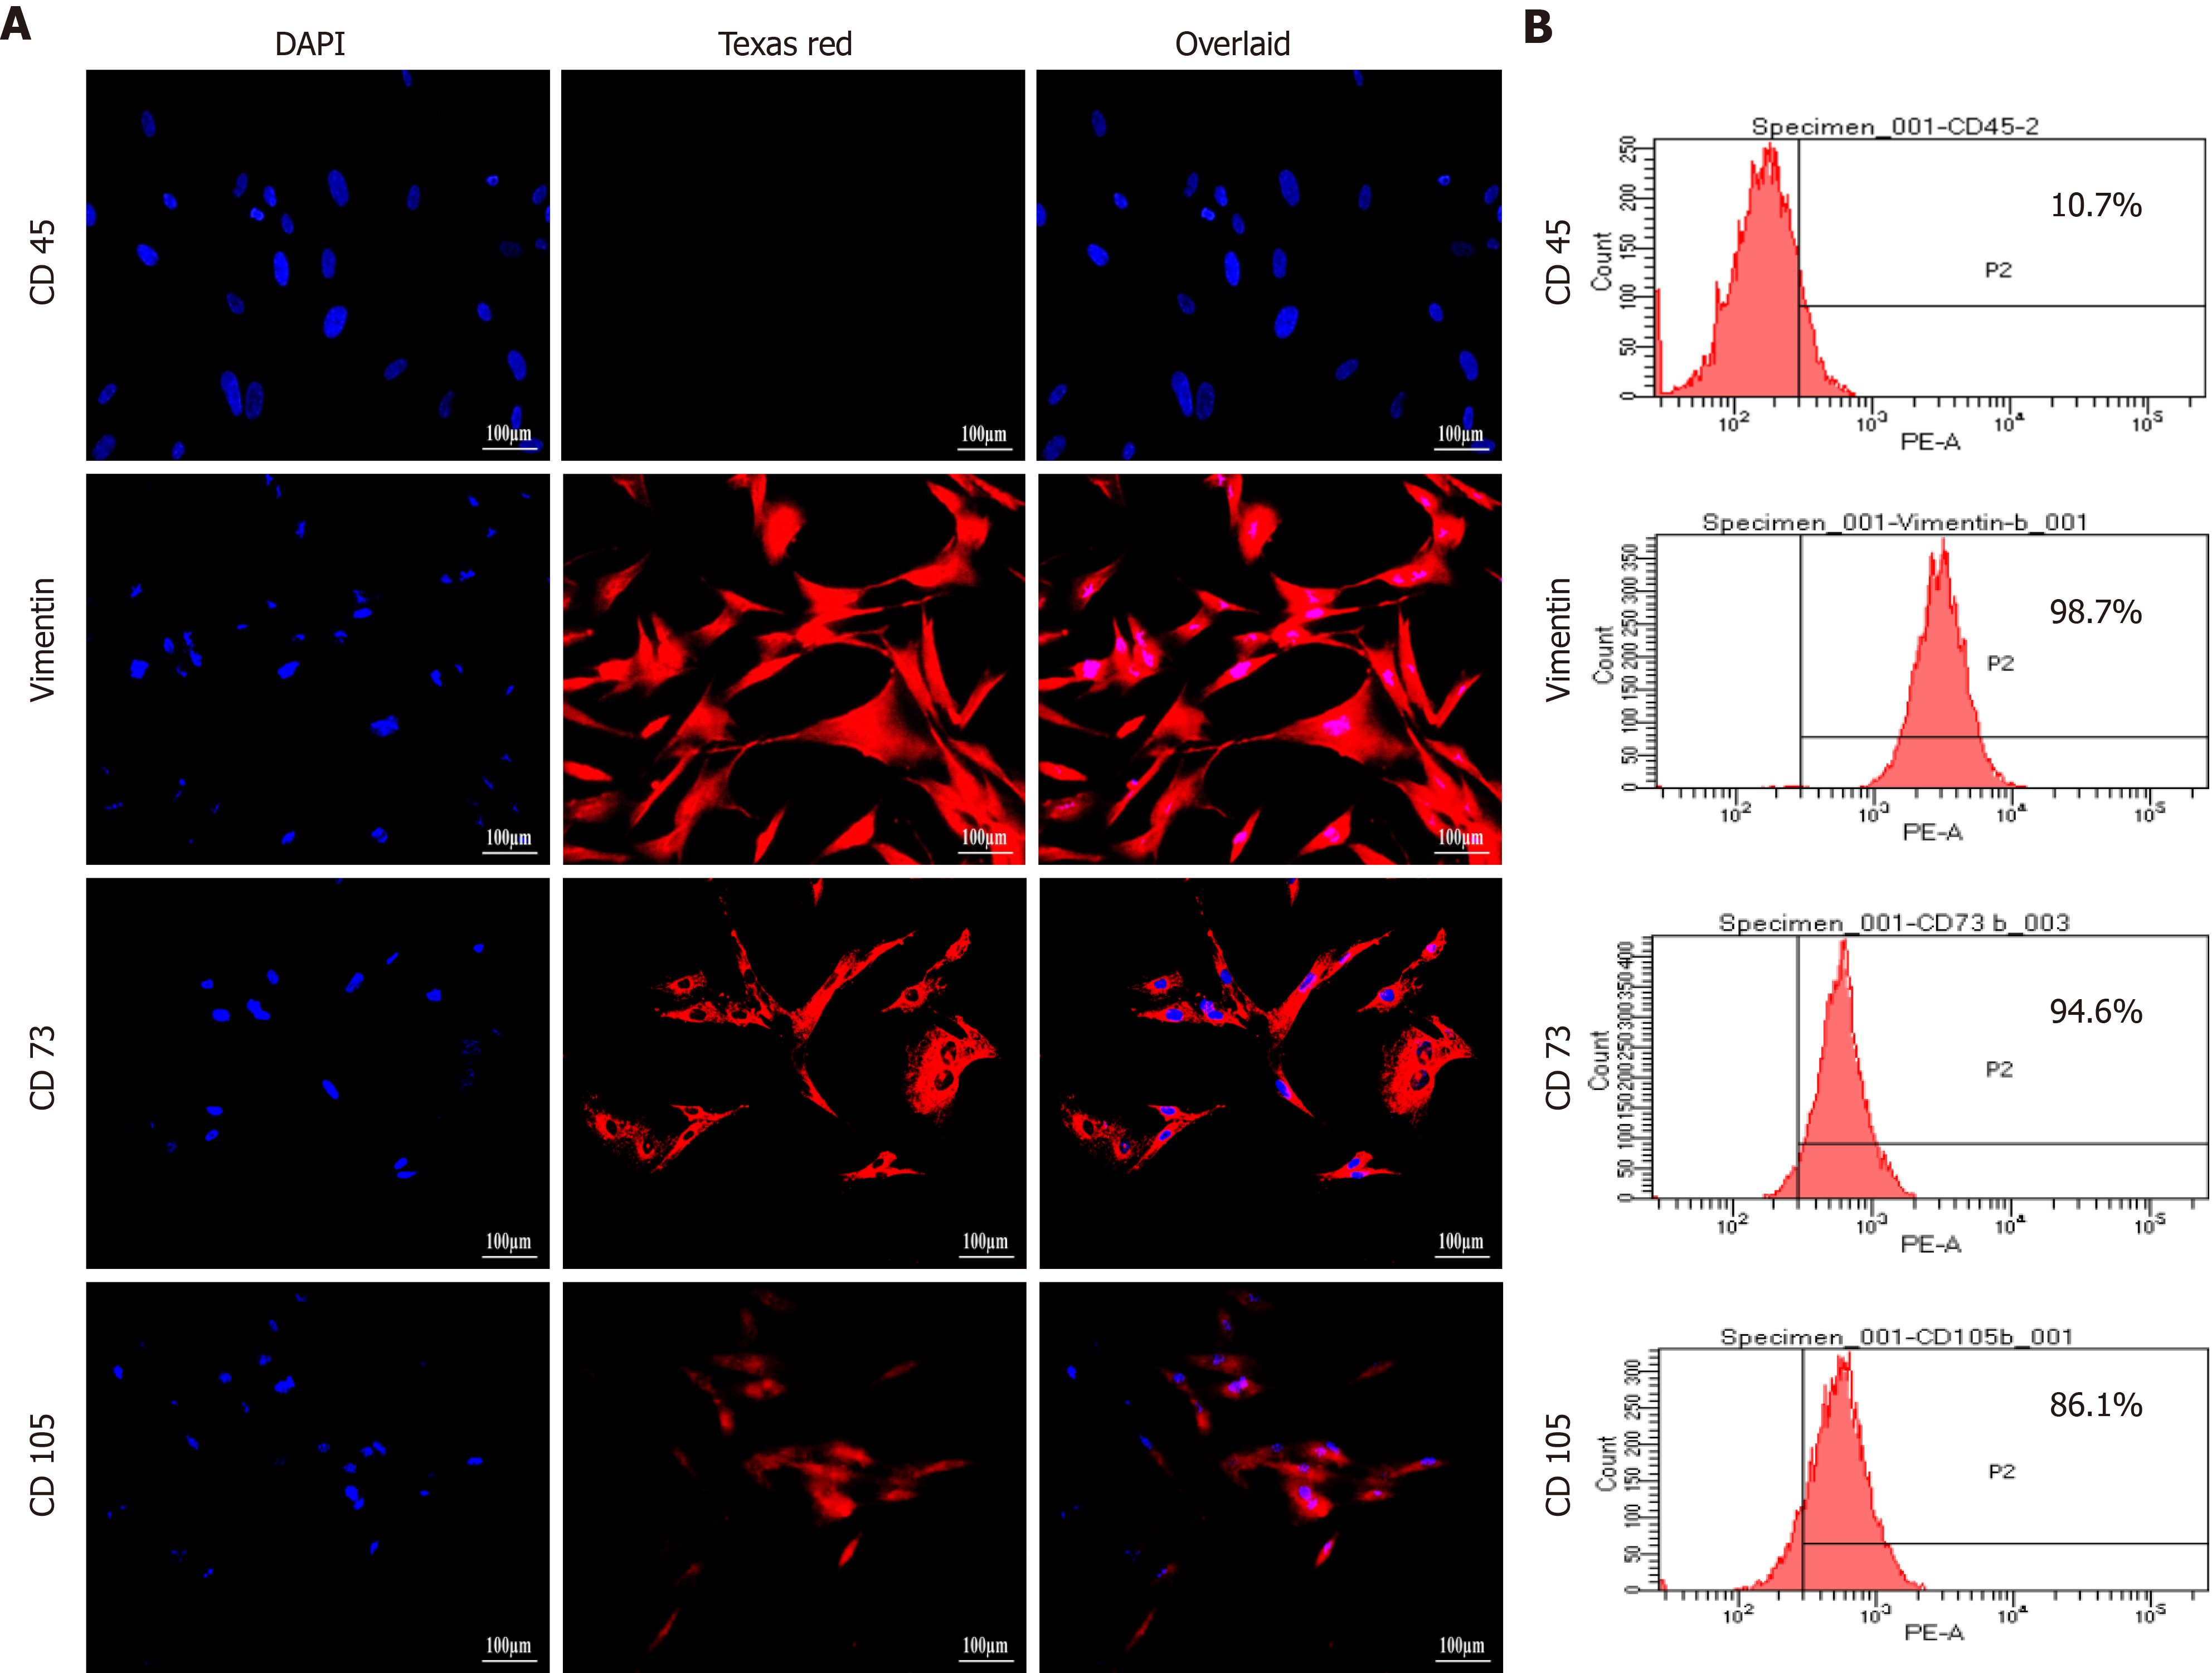
Figure 2 Characterization of human umbilical cord-mesenchymal stem cells by immunocytochemical analysis and flow cytometry.
A: Immunocytochemical analysis showing positive expression of mesenchymal markers, CD73, CD105, and vimentin, and negative expression of hematopoietic marker CD45. Fluorescent micrographs were captured at 20 × magnification; B: Flow cytometric analysis showing mesenchymal markers CD73, CD105, and vimentin having more than 85% positive cells. Data were analyzed using Cell Quest Pro software.
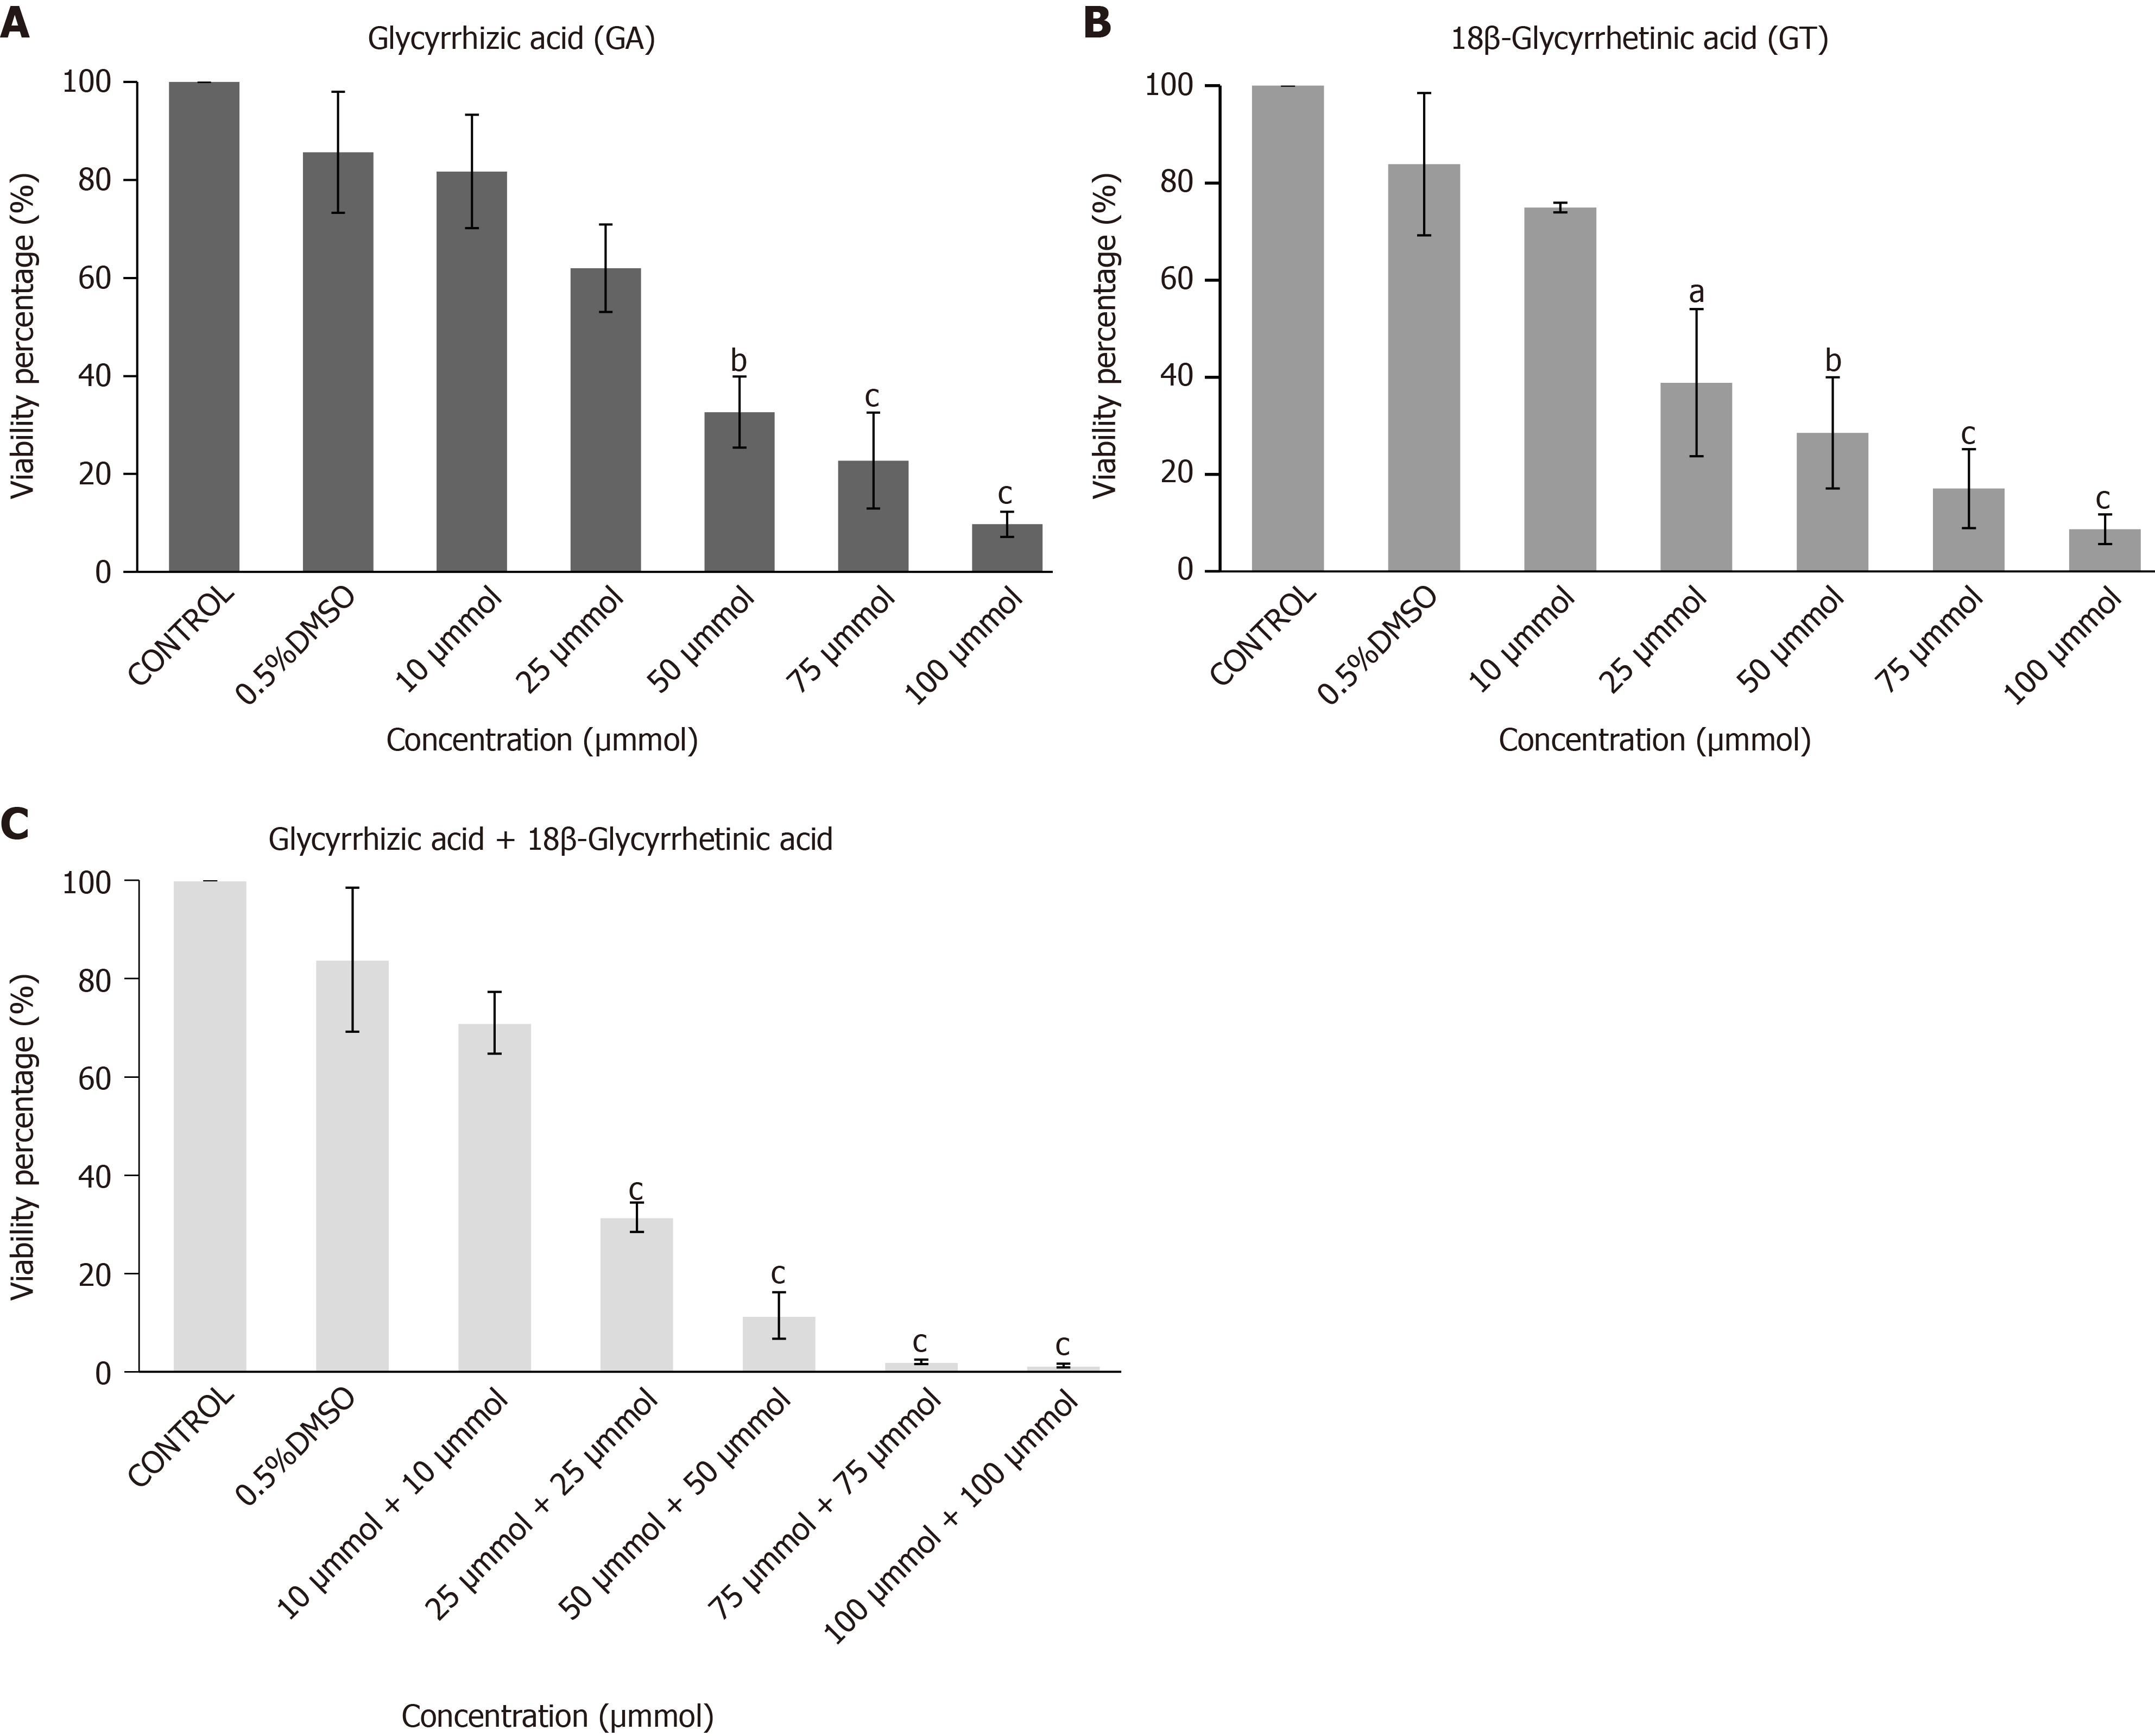
Figure 3 Cytotoxicity analysis of human umbilical cord-mesenchymal stem cells by MTT Assay.
Bar graphs showing percent viability of human umbilical cord-mesenchymal stem cells treated with A: glycyrrhizic acid (GA), B: 18β-glycyrrhetinic acid (GT), and C: their combination (GA + GT) at different concentrations. A decrease in percent (%) cell viability is observed with increasing concentrations of GA, GT and their combination. Statistical analysis was conducted by One-way ANOVA and Post-Hoc Bonferroni tests. Results are expressed as mean ± SEM (n = 3); level of significance aP ≤ 0.05 (where aP ≤ 0.05, bP ≤ 0.01, and
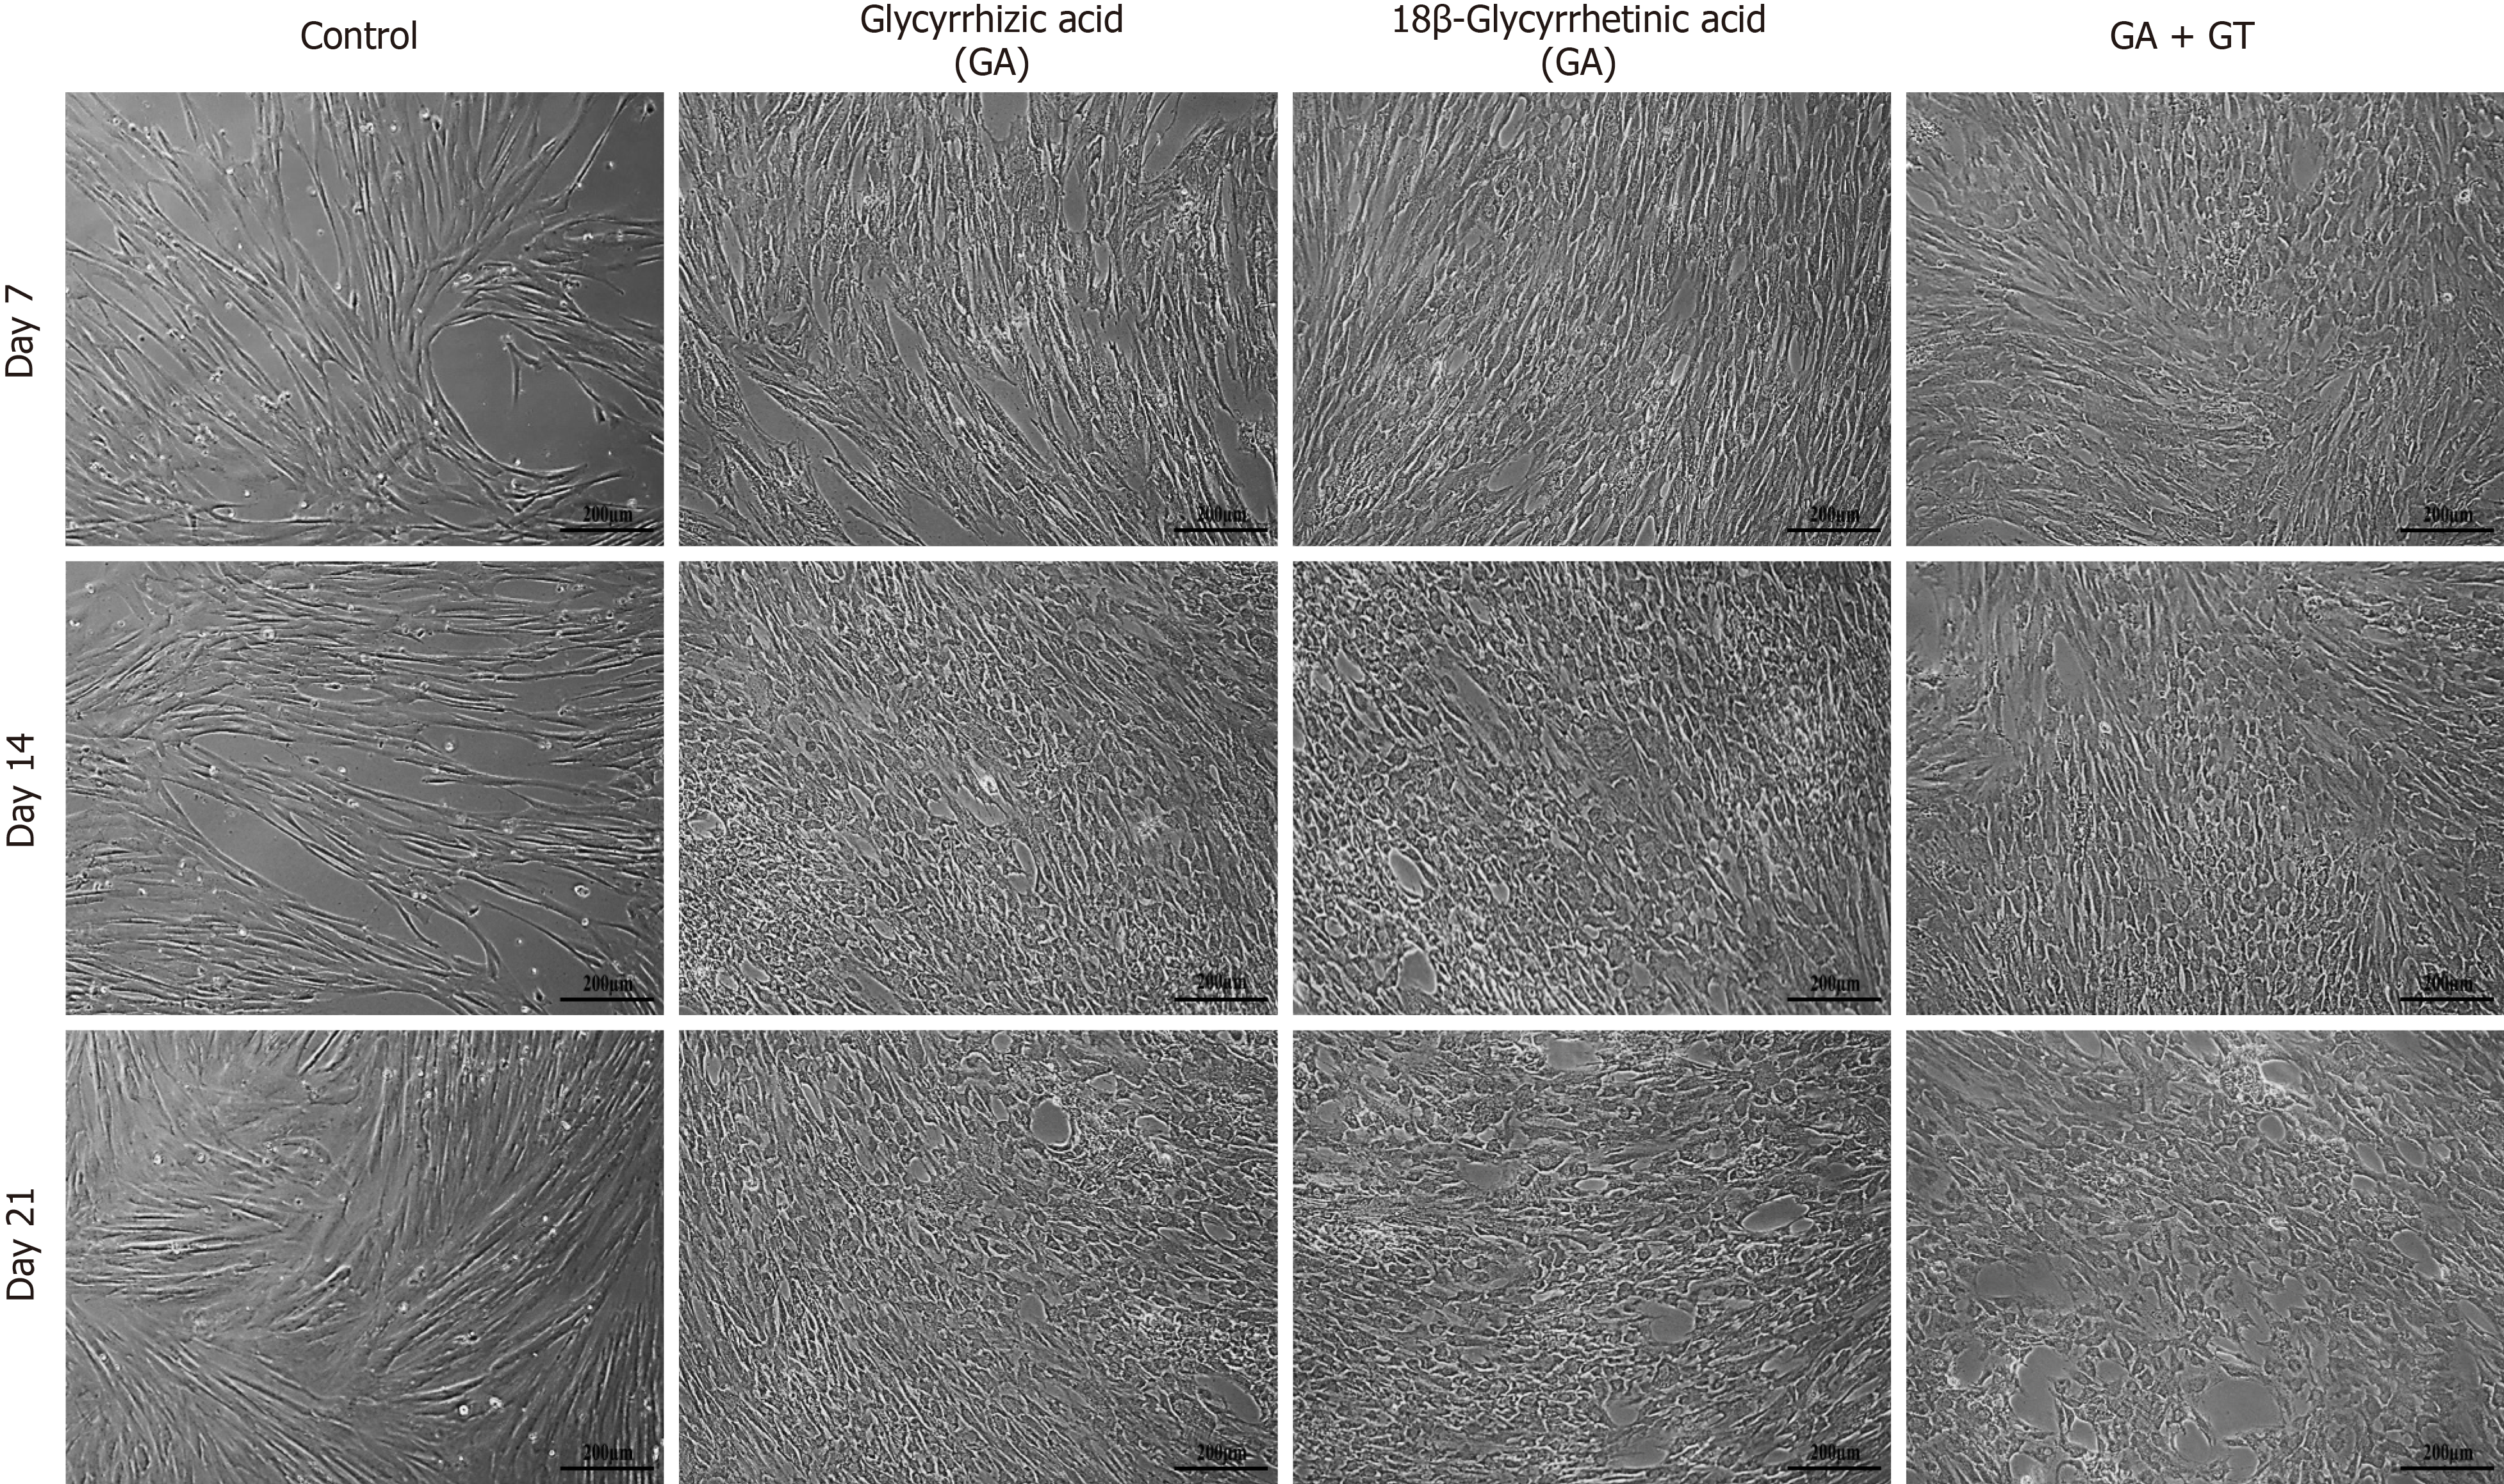
Figure 4 Morphological features of human umbilical cord-mesenchymal stem cells treated with glycyrrhizic acid (GA), 18β-glycyrrhetinic acid (GT), and their combination (GA + GT).
At day 7, GA and GT treated MSCs became slightly shorter, flattened, and broader in appearance with retracted ends, while in the combination group, cells began to appear polygonal in shape. At day 14, changes were more apparent and cells progressively decreased in size and transformed into irregular or polygonal shape and by day 21, majority of the cells developed into more compact and polygonal morphology like that of hepatocytes exhibiting tight interactions between the cells in all treatment groups as compared to the untreated control. All images were taken under phase contrast at 10× magnification.
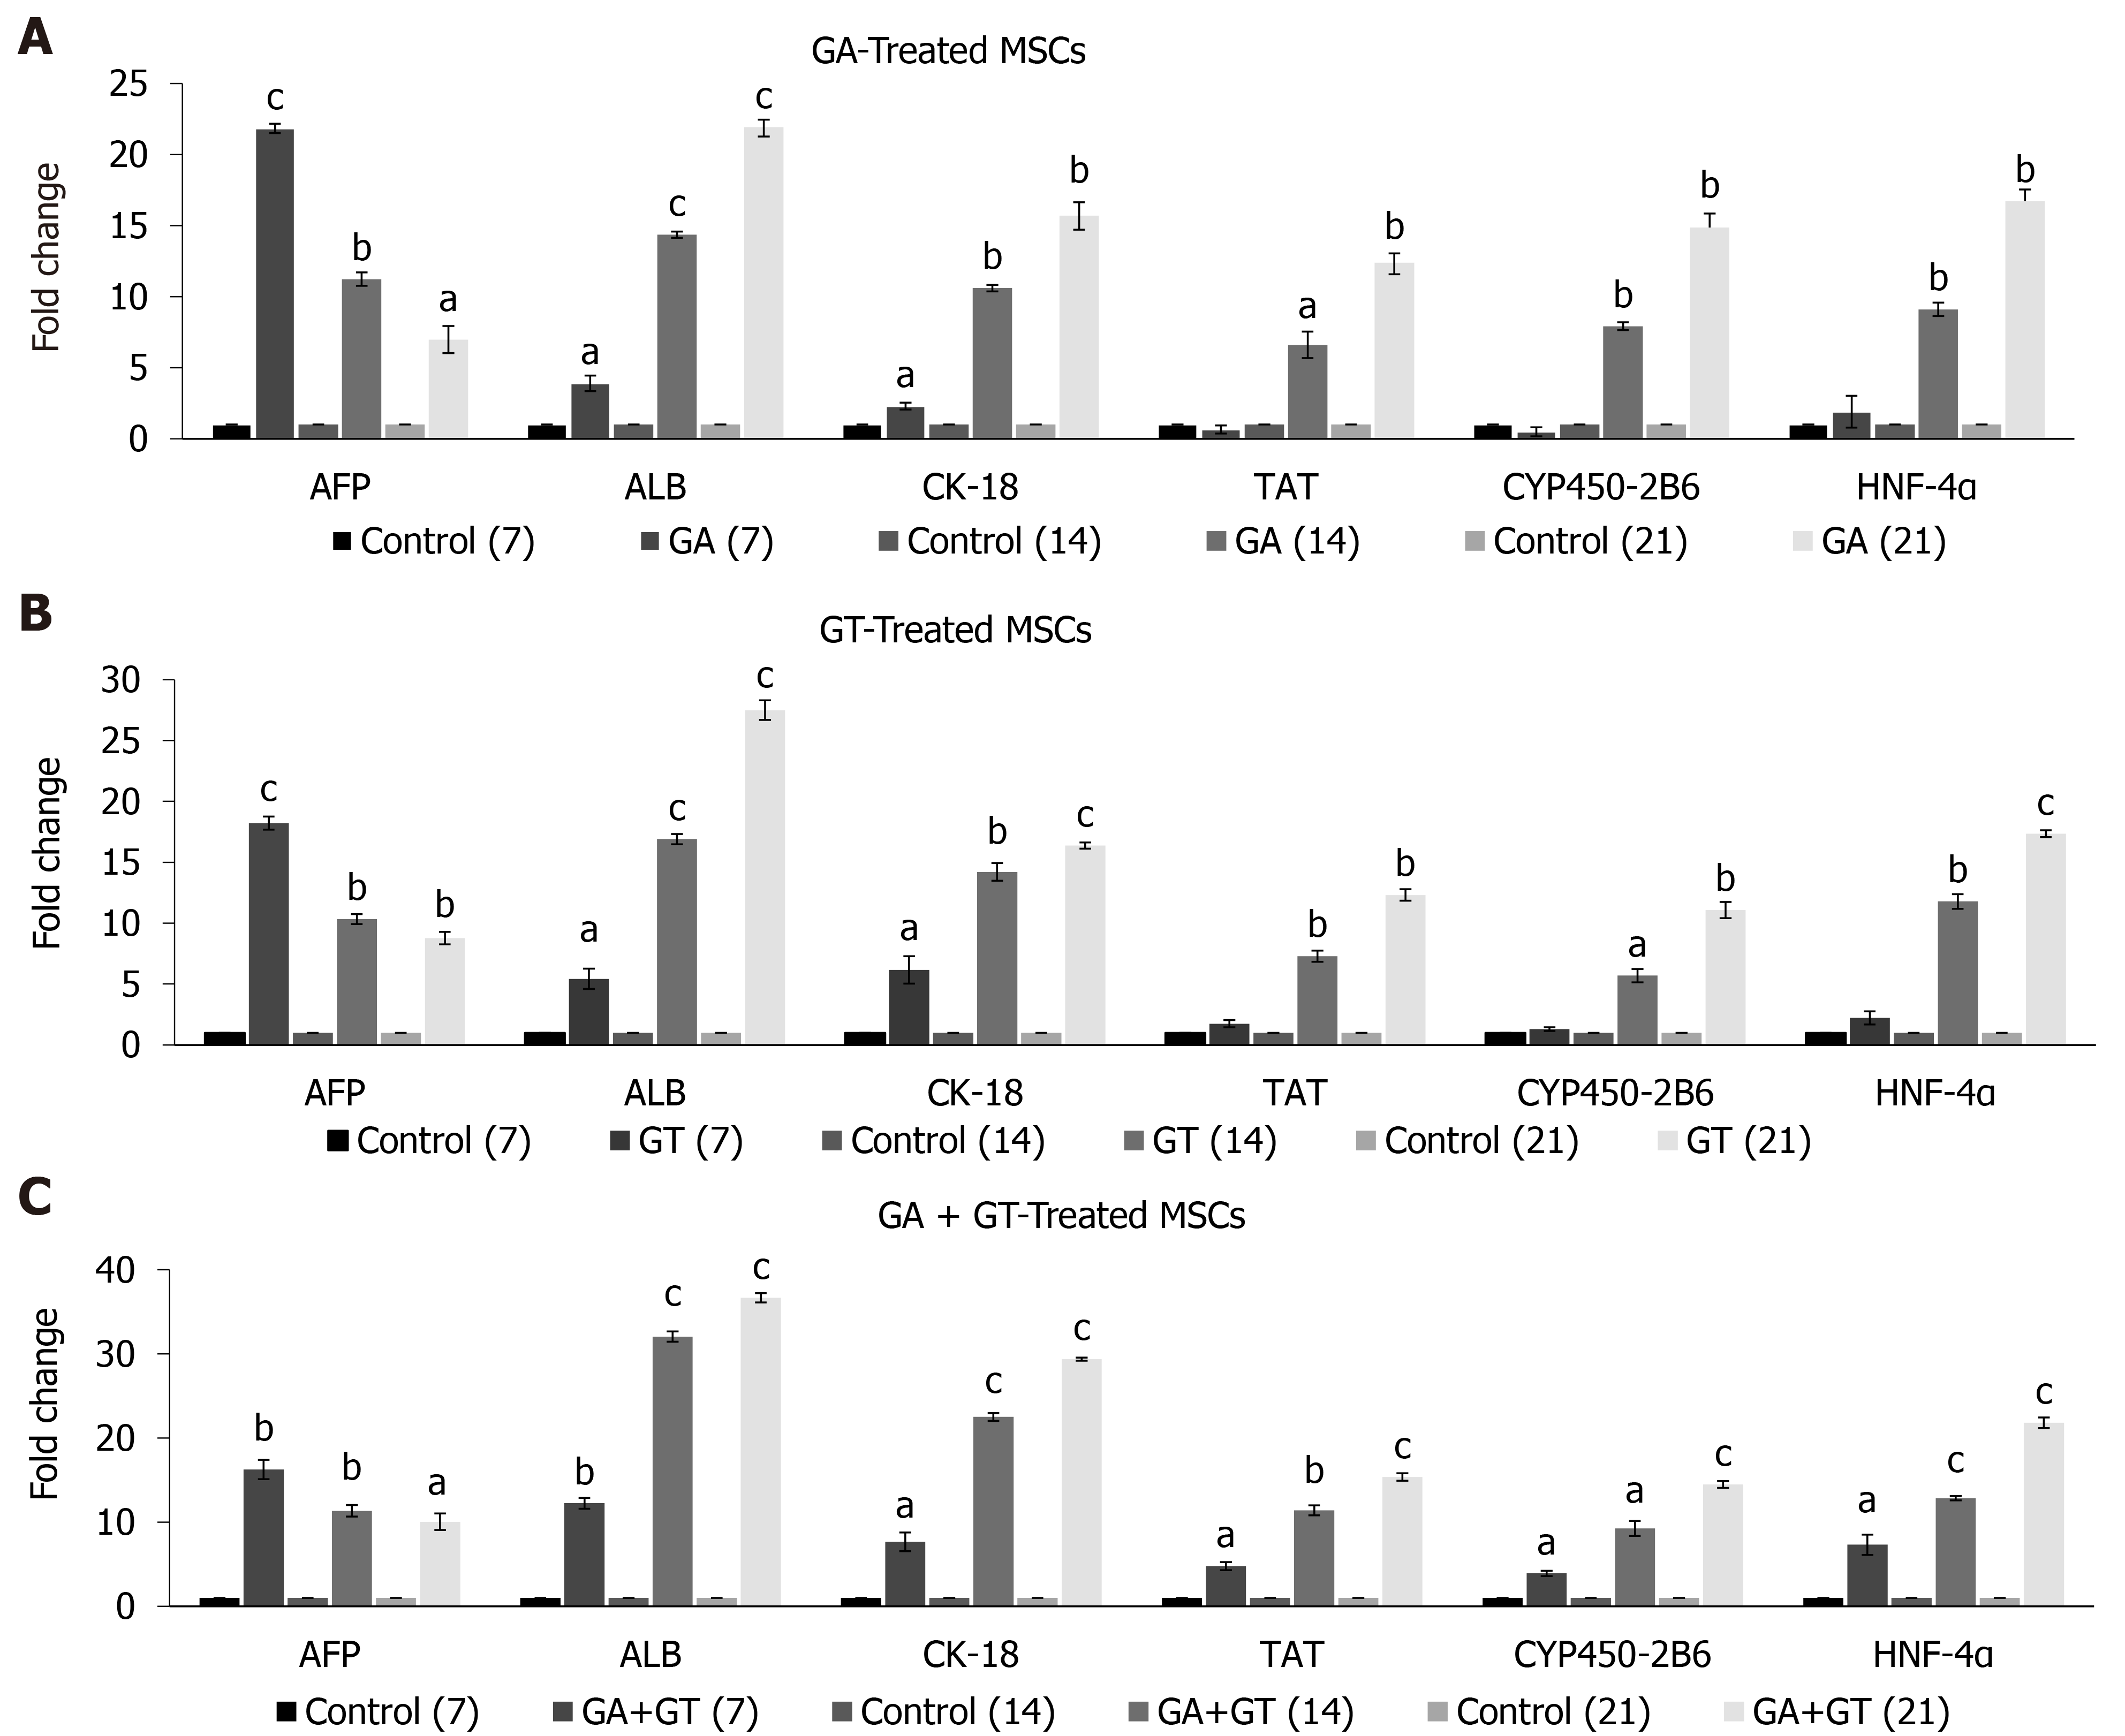
Figure 5 Expression of hepatic genes in human umbilical cord-mesenchymal stem cells treated with glycyrrhizic acid, 18β-glycyrrhetinic acid, and their combination.
A and B: Glycyrrhizic acid (GA)- and 18β-glycyrrhetinic acid (GT)-treated mesenchymal stem cells showed significant expression of early hepatocyte marker AFP at all time points. Highest expression was observed at day 7 but it declined in a time-dependent manner. Significant expression levels of ALB and CK-18 were detected at all time points. Late hepatic markers, TAT, CYP450-2B6, and HNF-4α were not detectable at day 7 but were significantly up-regulated at day 14 and 21, as compared to the untreated control; C: GA + GT-treated MSCs revealed significant up-regulation of AFP at all time points. Highest expression was observed at day 7 but it declined with treatment time. Significant expression levels of ALB, CK-18, TAT, CYP450-2B6, and HNF-4α were observed at all time points and their expression increased with time of differentiation, as compared to the untreated control. Statistical analysis was conducted by independent sample t-test. Results are expressed as mean ± SEM (n = 3); level of significance aP ≤ 0.05 (where aP ≤ 0.05, bP ≤ 0.01, and cP ≤ 0.001).
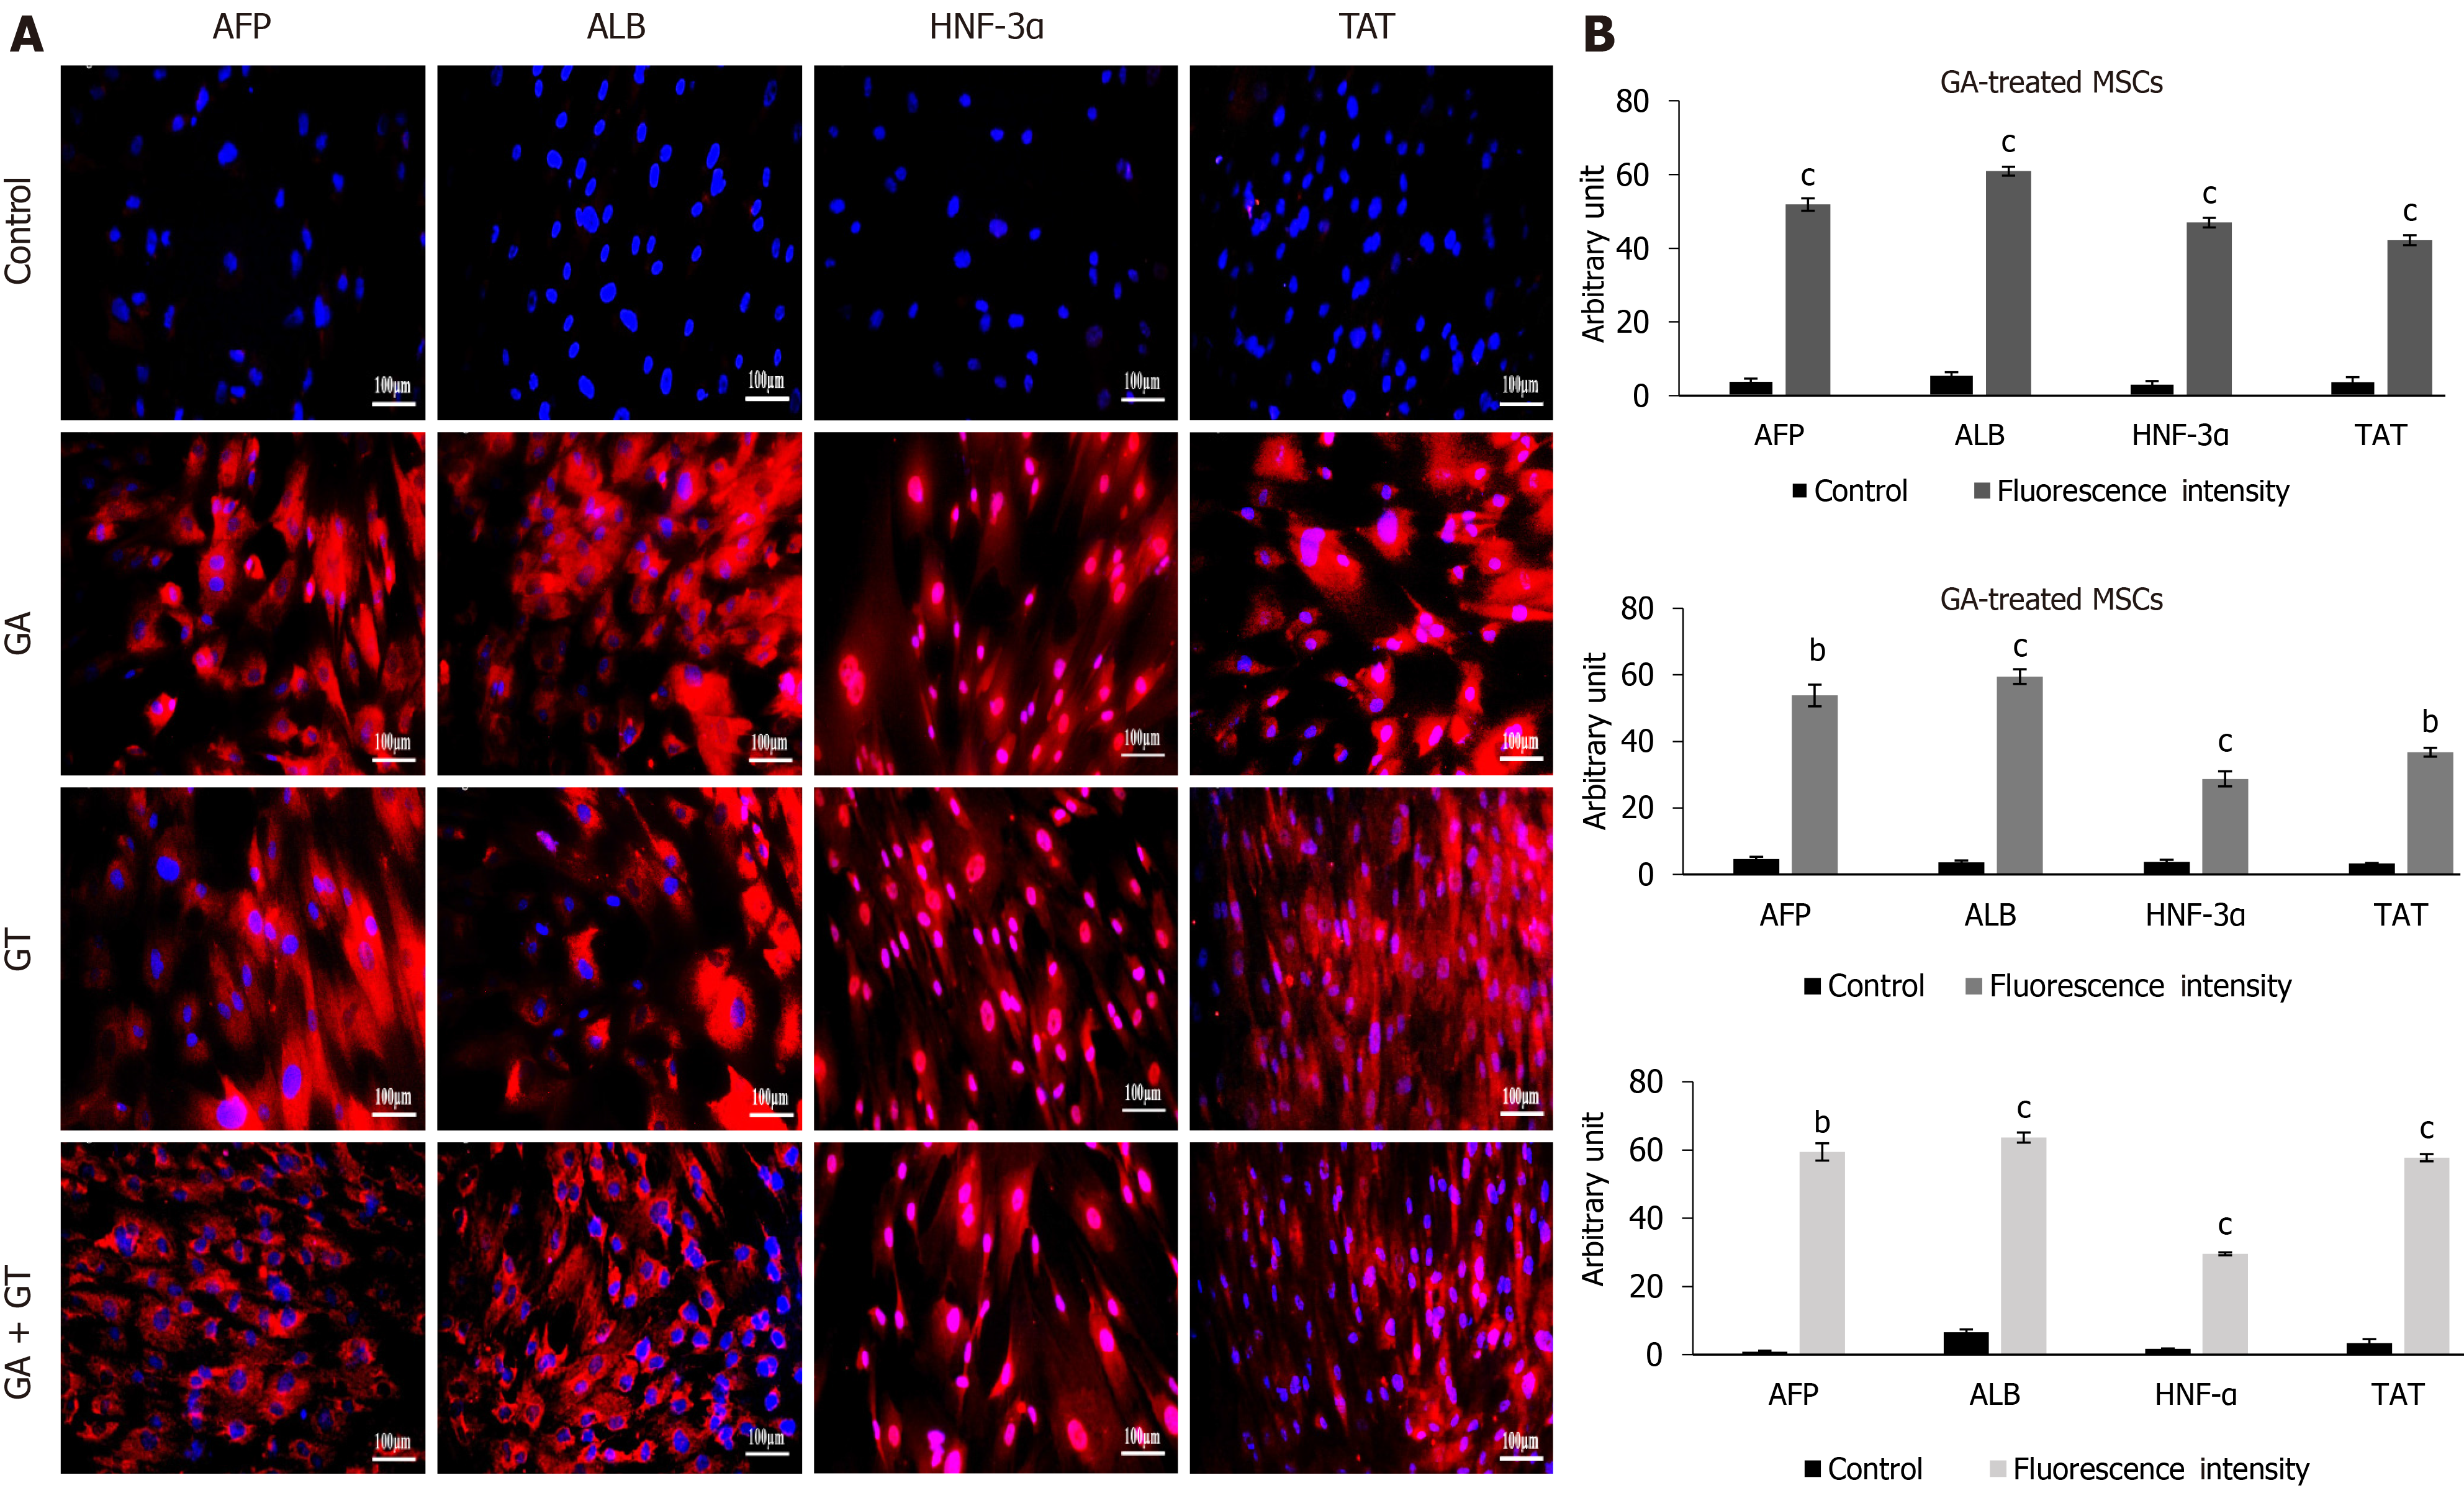
Figure 6 Immunocytochemical analysis and quantification of hepatic proteins in human umbilical cord-mesenchymal stem cells treated with glycyrrhizic acid, 18β-glycyrrhetinic acid and their combination.
A: At day 21, treated mesenchymal stem cells exhibited positive expression for hepatocyte specific proteins including, alpha-fetoprotein, albumin, hepatocyte nuclear factor-3α, and tyrosine-aminotransferase in all treatment groups as compared to the untreated control; B: Fluorescence intensities of all treatment groups were measured using Image J software. Statistical analysis was conducted by independent sample t-test. Results are expressed as mean ± SEM (n = 3); level of significance aP ≤ 0.05 (where bP ≤ 0.01 and cP ≤ 0.001).
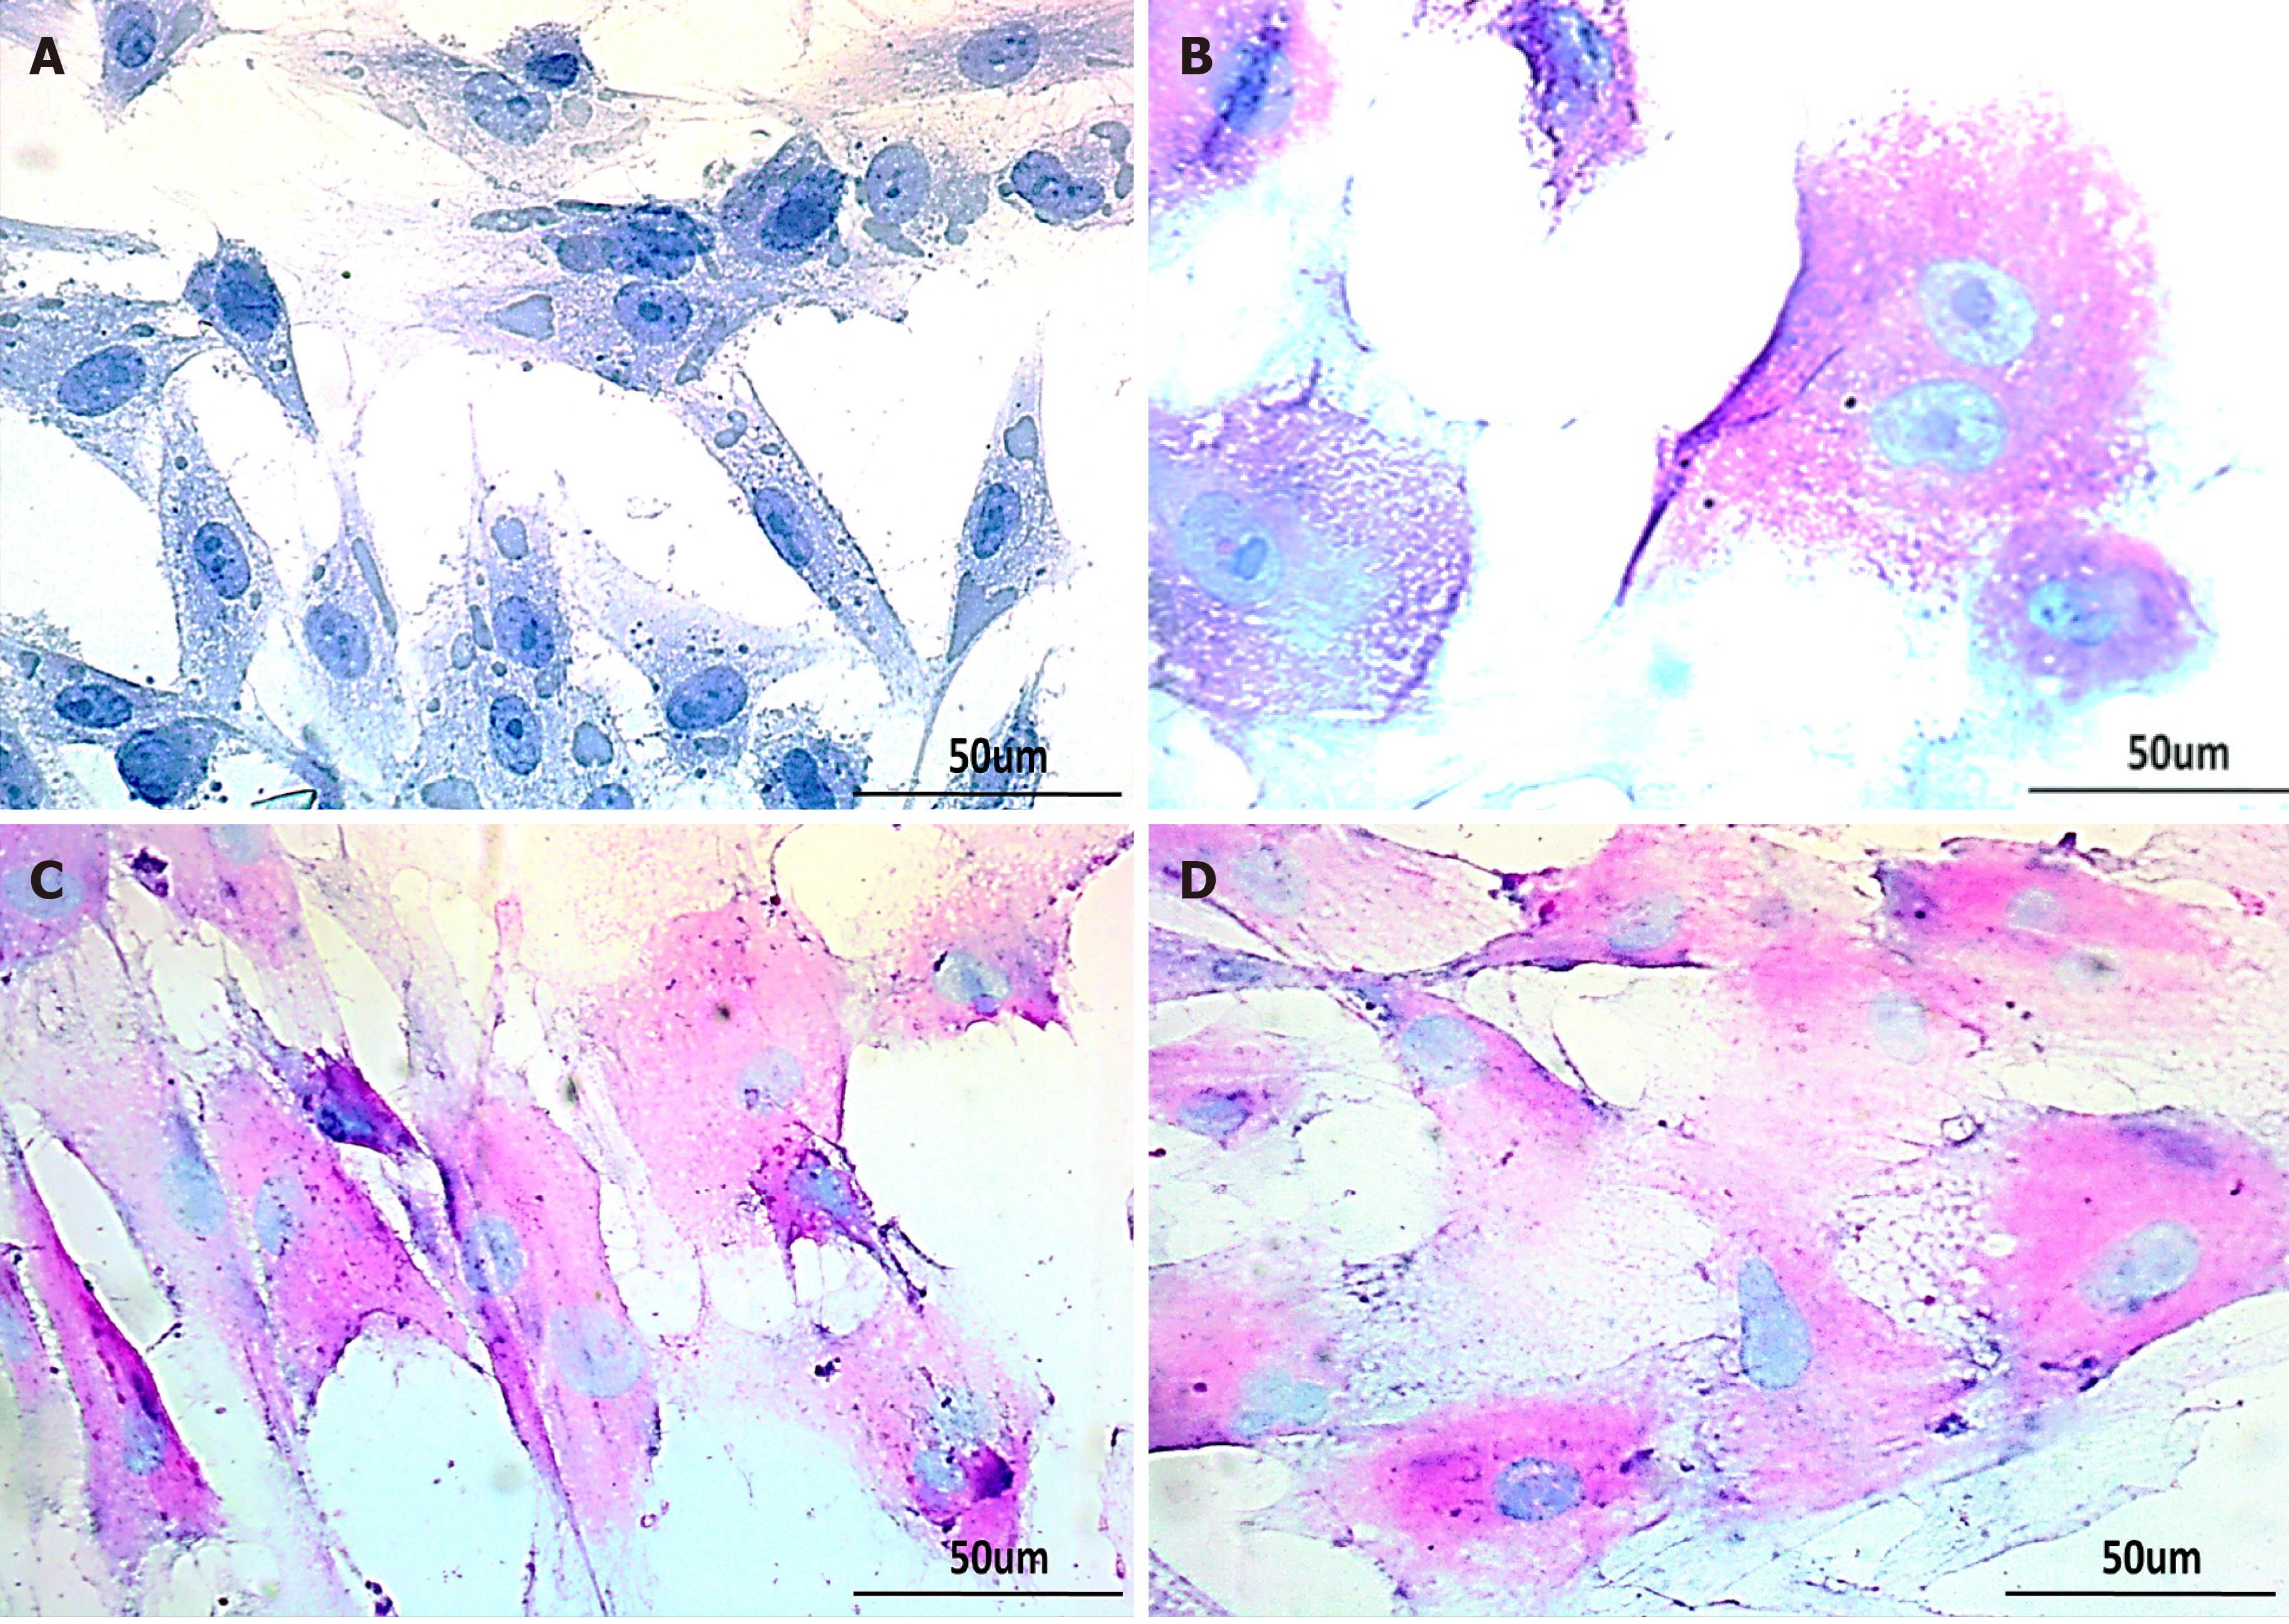
Figure 7 Glycogen detection in treated human umbilical cord-mesenchymal stem cells by periodic acid Schiff staining.
Bright-field images of A: untreated control showing negative periodic acid Schiff staining (PAS); B: MSCs treated with glycyrrhizic acid (GA); C: 18β-glycyrrhetinic acid (GT); and D: GA+GT (combination group) at day 21 showing PAS positive cells stained as purple-pink, indicating the presence of glycogen in their cytoplasm. Bi-nucleated cells (a hepatocyte characteristic) were also observed. Images were taken at 40× magnification.
- Citation: Fatima A, Malick TS, Khan I, Ishaque A, Salim A. Effect of glycyrrhizic acid and 18β-glycyrrhetinic acid on the differentiation of human umbilical cord-mesenchymal stem cells into hepatocytes. World J Stem Cells 2021; 13(10): 1580-1594
- URL: https://www.wjgnet.com/1948-0210/full/v13/i10/1580.htm
- DOI: https://dx.doi.org/10.4252/wjsc.v13.i10.1580


