Copyright
©The Author(s) 2021.
World J Stem Cells. Jan 26, 2021; 13(1): 115-127
Published online Jan 26, 2021. doi: 10.4252/wjsc.v13.i1.115
Published online Jan 26, 2021. doi: 10.4252/wjsc.v13.i1.115
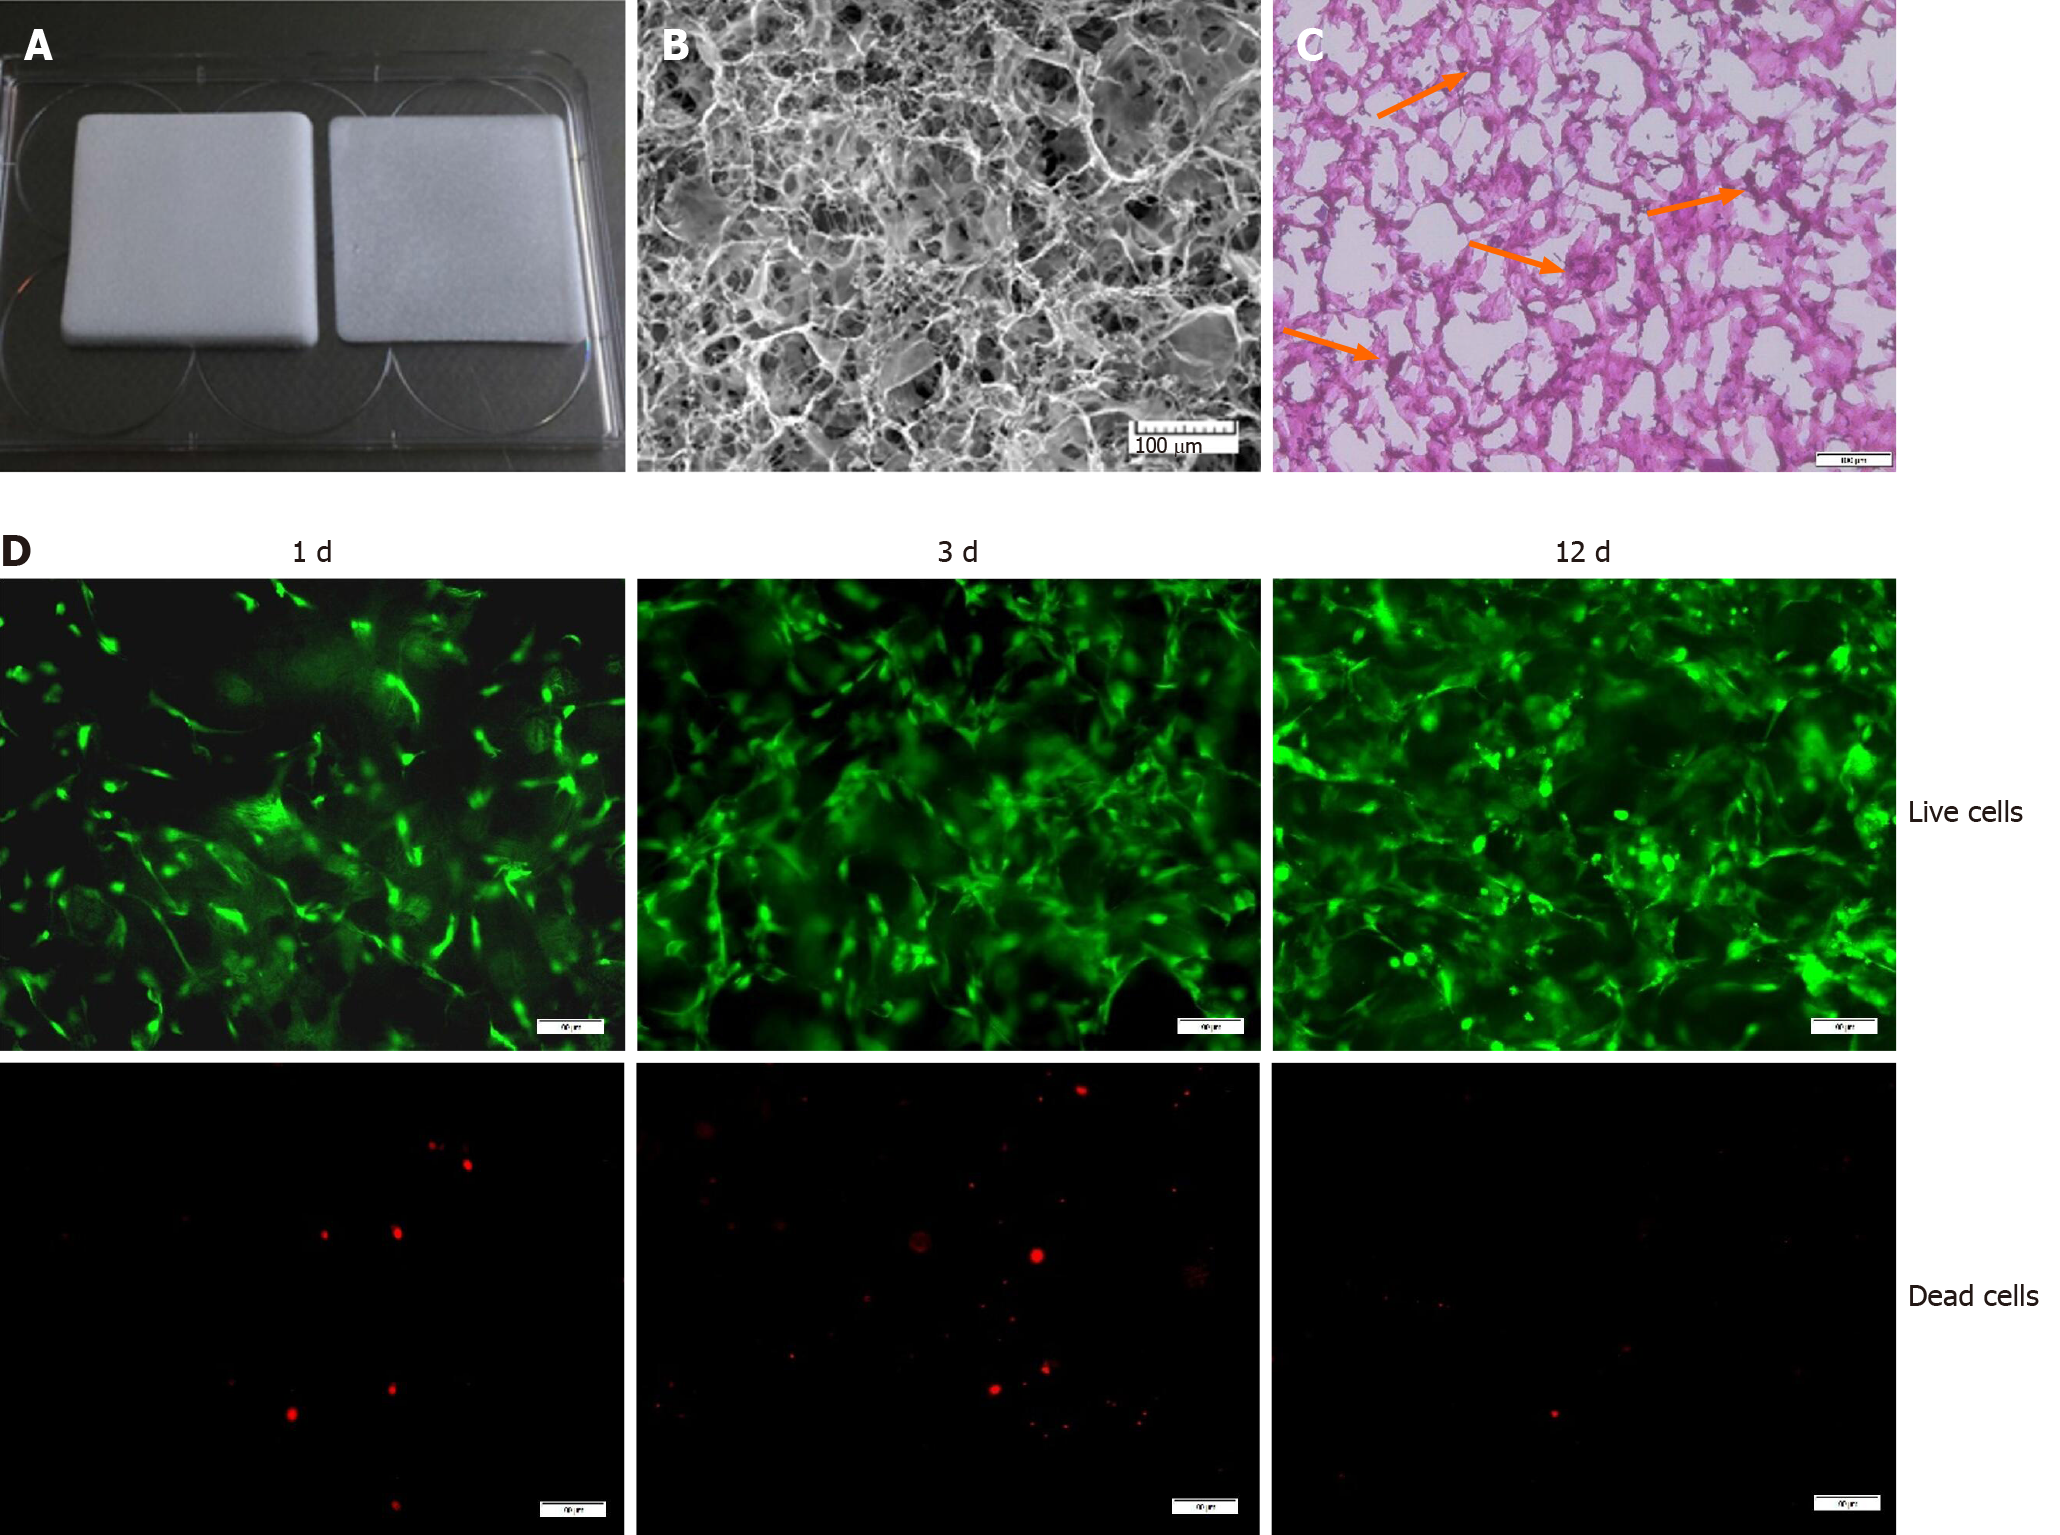
Figure 1 A 3D culture system based on a type I collagen sponge scaffold.
A: Type I collagen sponge scaffold; B: Surface topography of the collagen sponge scaffold observed by scanning electron microscopy. Bars = 100 μm; C: Hematoxylin and eosin staining of sectioned bone marrow mesenchymal stem cell-collagen sponge constructs. Orange arrows indicate the cells. Bars = 100 μm; D: Live/dead assay of the scaffolds during the cultivation process. Green indicates the live cells, and red indicates the dead cells. Bars = 100 μm.
Figure 2 Real-time PCR analysis of gene expression levels after stimulation with transforming growth factor beta 1 (10 ng/mL), insulin-like growth factor 1 (10 ng/mL), growth differentiation factor 7 (100 ng/mL), or transforming growth factor beta 1 plus insulin-like growth factor 1 (both at 10 ng/mL) for 3 or 12 d in the 2D and 3D cultures.
A: Col1a1; B: Col3a1; C: Tnc; D: Scx; E: Tnmd; F: PPARγ; G: Runx2. The results of the target gene expression levels were normalized to those of GAPDH. The data are expressed as the mean ± SD; n = 3. aP < 0.05; bP < 0.01. TGF-β1: Transforming growth factor beta 1; IGF-1: Insulin-like growth factor 1; GDF-7: Growth differentiation factor 7.
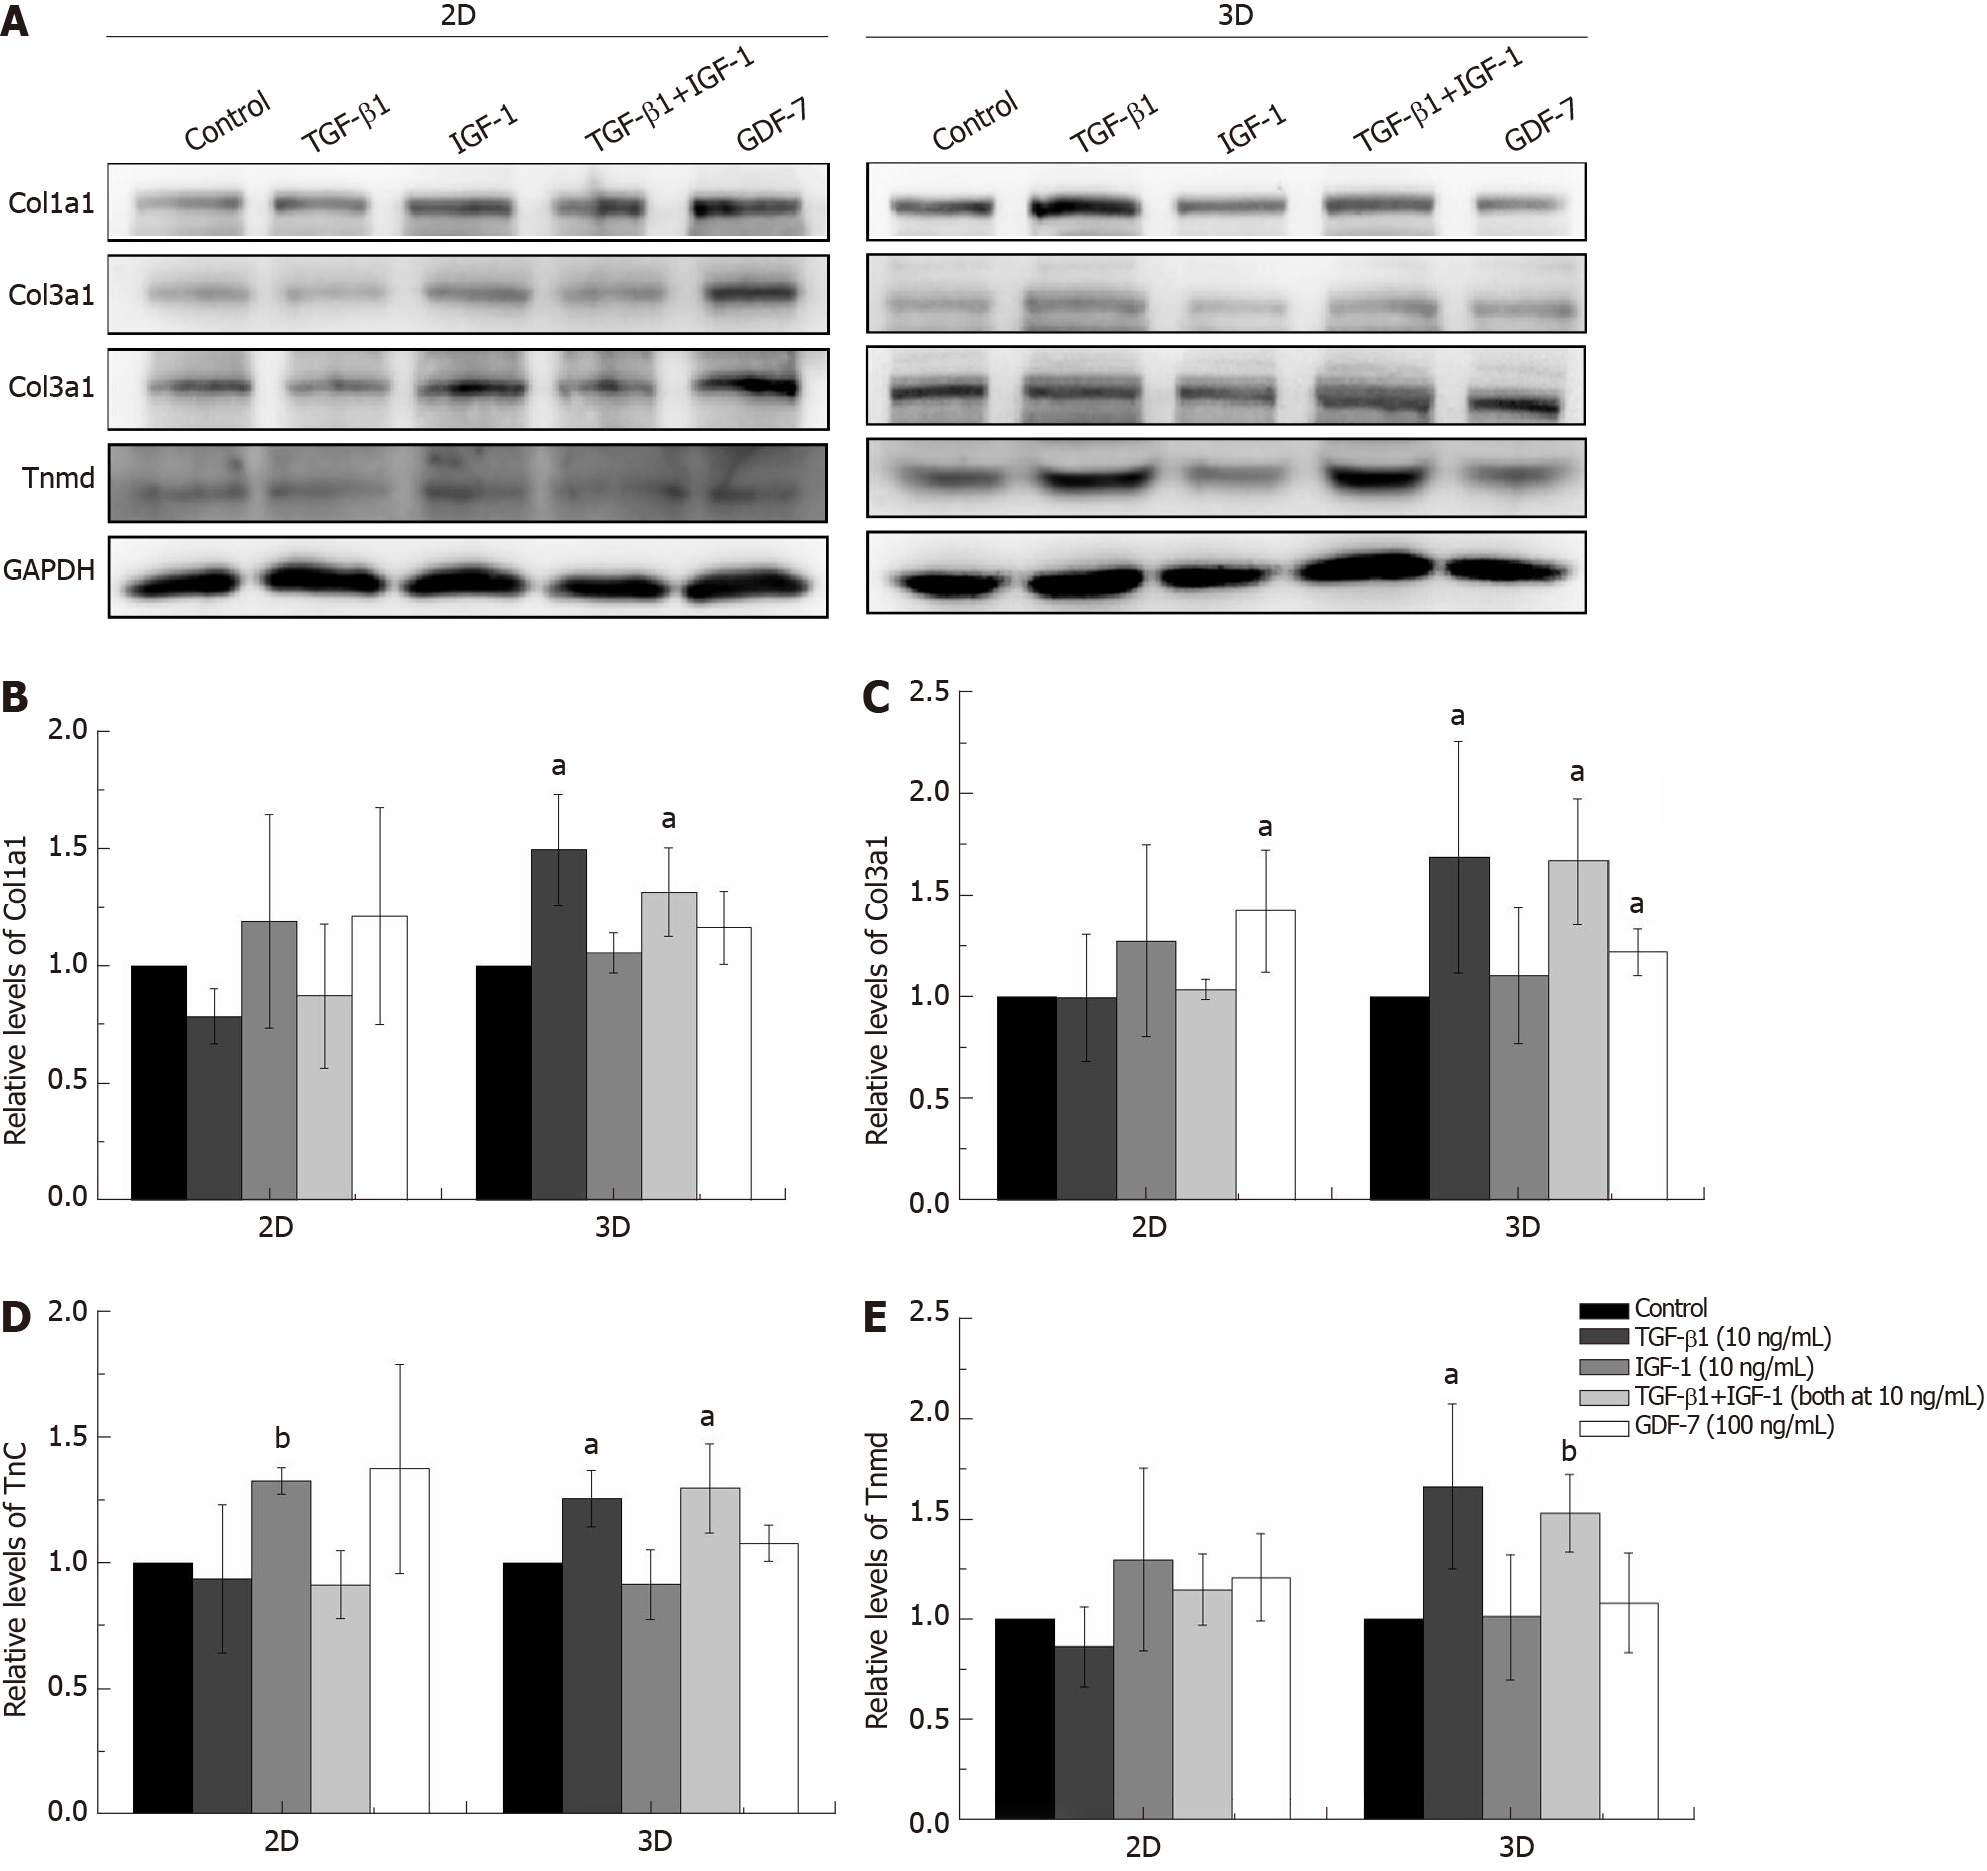
Figure 3 Effect of stimulation with transforming growth factor β1 (10 ng/mL), insulin-like growth factor 1 (10 ng/mL), growth differentiation factor 7 (100 ng/mL), or transforming growth factor beta 1 plus insulin-like growth factor 1 (both at 10 ng/mL) on the differentiation of bone marrow mesenchymal stem cells in the 2D and 3D cultures.
A: The protein expression levels of Col1a1, Col3a1, Tnc, and Tnmd detected by Western blot after growth factor stimulation for 12 d; B-E: The results of the densitometric analysis of the target protein expression levels were normalized to those of GAPDH. The data are expressed as the mean ± SD; n = 3. aP < 0.05; bP < 0.01. TGF-β1: Transforming growth factor β1; IGF-1: Insulin-like growth factor 1; GDF-7: Growth differentiation factor 7.
Figure 4 Effect of transforming growth factor β1 (10 ng/mL), insulin-like growth factor 1 (10 ng/mL), growth differentiation factor 7 (100 ng/mL), and transforming growth factor β1 or insulin-like growth factor 1 (both at 10 ng/mL) on collagen synthesis in the bone marrow mesenchymal stem cells in the 2D and 3D cultures.
A: Morphologic appearance of the bone marrow mesenchymal stem cells (BMSCs) in culture supplemented with various growth factors at day 3; B: Sirius Red staining for collagen deposition evaluation in the BMSCs cultured in the absence of growth factor (control) or the presence of growth factors at day 3. Scale bars = 200 μm; C: Masson’s trichrome staining of sectioned BMSC-collagen sponge constructs after growth factor stimulation for 3 d. Bars = 200 μm. TGF-β1: Transforming growth factor β1; IGF-1: Insulin-like growth factor 1; GDF-7: Growth differentiation factor 7.
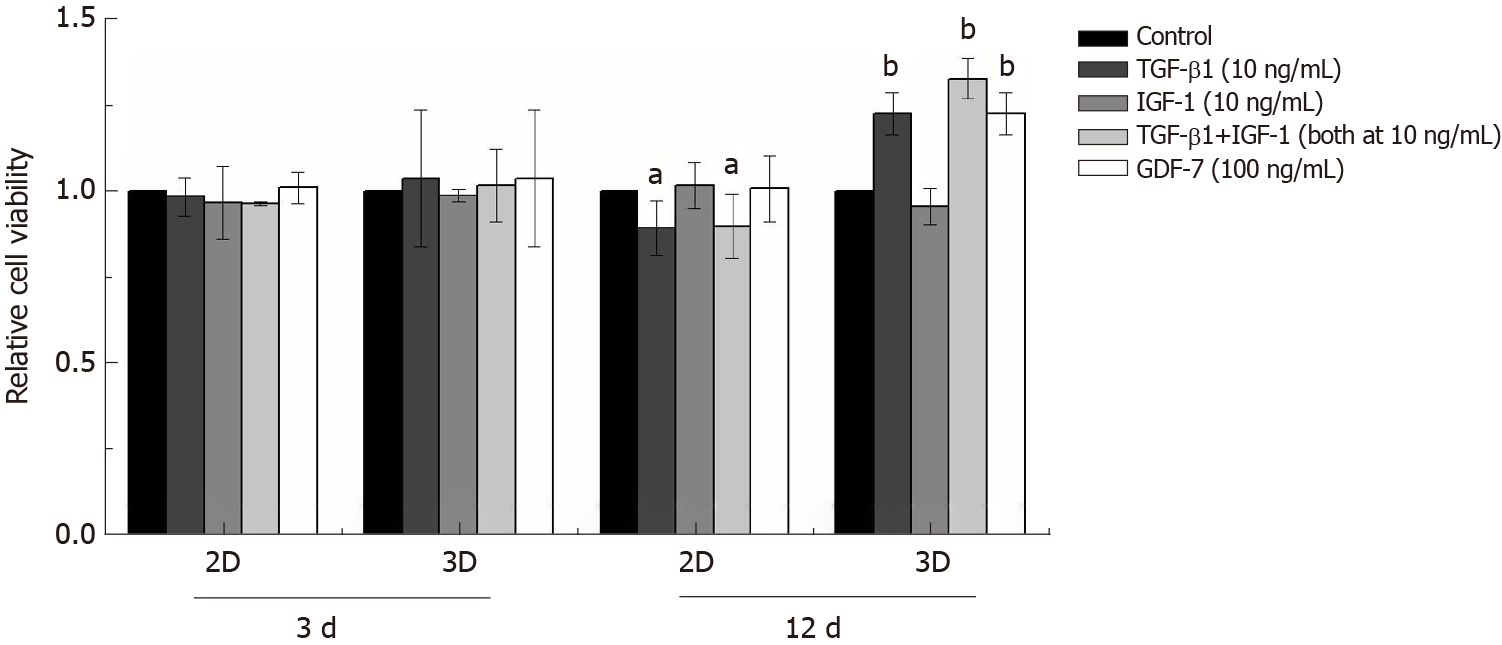
Figure 5 Effect of transforming growth factor β1 (10 ng/mL), insulin-like growth factor 1 (10 ng/mL), growth differentiation factor 7 (100 ng/mL), or transforming growth factor β1 combined with insulin-like growth factor 1 (both at 10 ng/mL) on the viability of bone marrow mesenchymal stem cells in the 2D and 3D cultures.
The viability of all the bone marrow mesenchymal stem cells was evaluated by CCK-8 assay after growth factor stimulation for 3 or 12 d. The data are expressed as the mean ± SD; n = 3. aP < 0.05 and bP < 0.01 compared with the control (non-treated). TGF-β1: Transforming growth factor β1; IGF-1: Insulin-like growth factor 1; GDF-7: Growth differentiation factor 7.
Figure 6 Effect of transforming growth factor β1 (10 ng/mL), insulin-like growth factor 1 (10 ng/mL), growth differentiation factor 7 (100 ng/mL), or transforming growth factor β1 combined with insulin-like growth factor 1 (both at 10 ng/mL) on the survival of bone marrow mesenchymal stem cells in the collagen sponge-based 3D culture.
The live/dead assay showed that more dead cells were observed in the bone marrow mesenchymal stem cells-collagen sponge constructs treated with transforming growth factor β1 (TGF-β1) (TGF-β1 combined with insulin-like growth factor 1) for 3 d. Bars = 100 μm. Green indicates the live cells, and red indicates the dead cells. TGF-β1: Transforming growth factor β1; IGF-1: Insulin-like growth factor 1; GDF-7: Growth differentiation factor 7.
- Citation: Zhang BY, Xu P, Luo Q, Song GB. Proliferation and tenogenic differentiation of bone marrow mesenchymal stem cells in a porous collagen sponge scaffold. World J Stem Cells 2021; 13(1): 115-127
- URL: https://www.wjgnet.com/1948-0210/full/v13/i1/115.htm
- DOI: https://dx.doi.org/10.4252/wjsc.v13.i1.115


