Copyright
©The Author(s) 2020.
World J Stem Cells. Mar 26, 2020; 12(3): 222-240
Published online Mar 26, 2020. doi: 10.4252/wjsc.v12.i3.222
Published online Mar 26, 2020. doi: 10.4252/wjsc.v12.i3.222
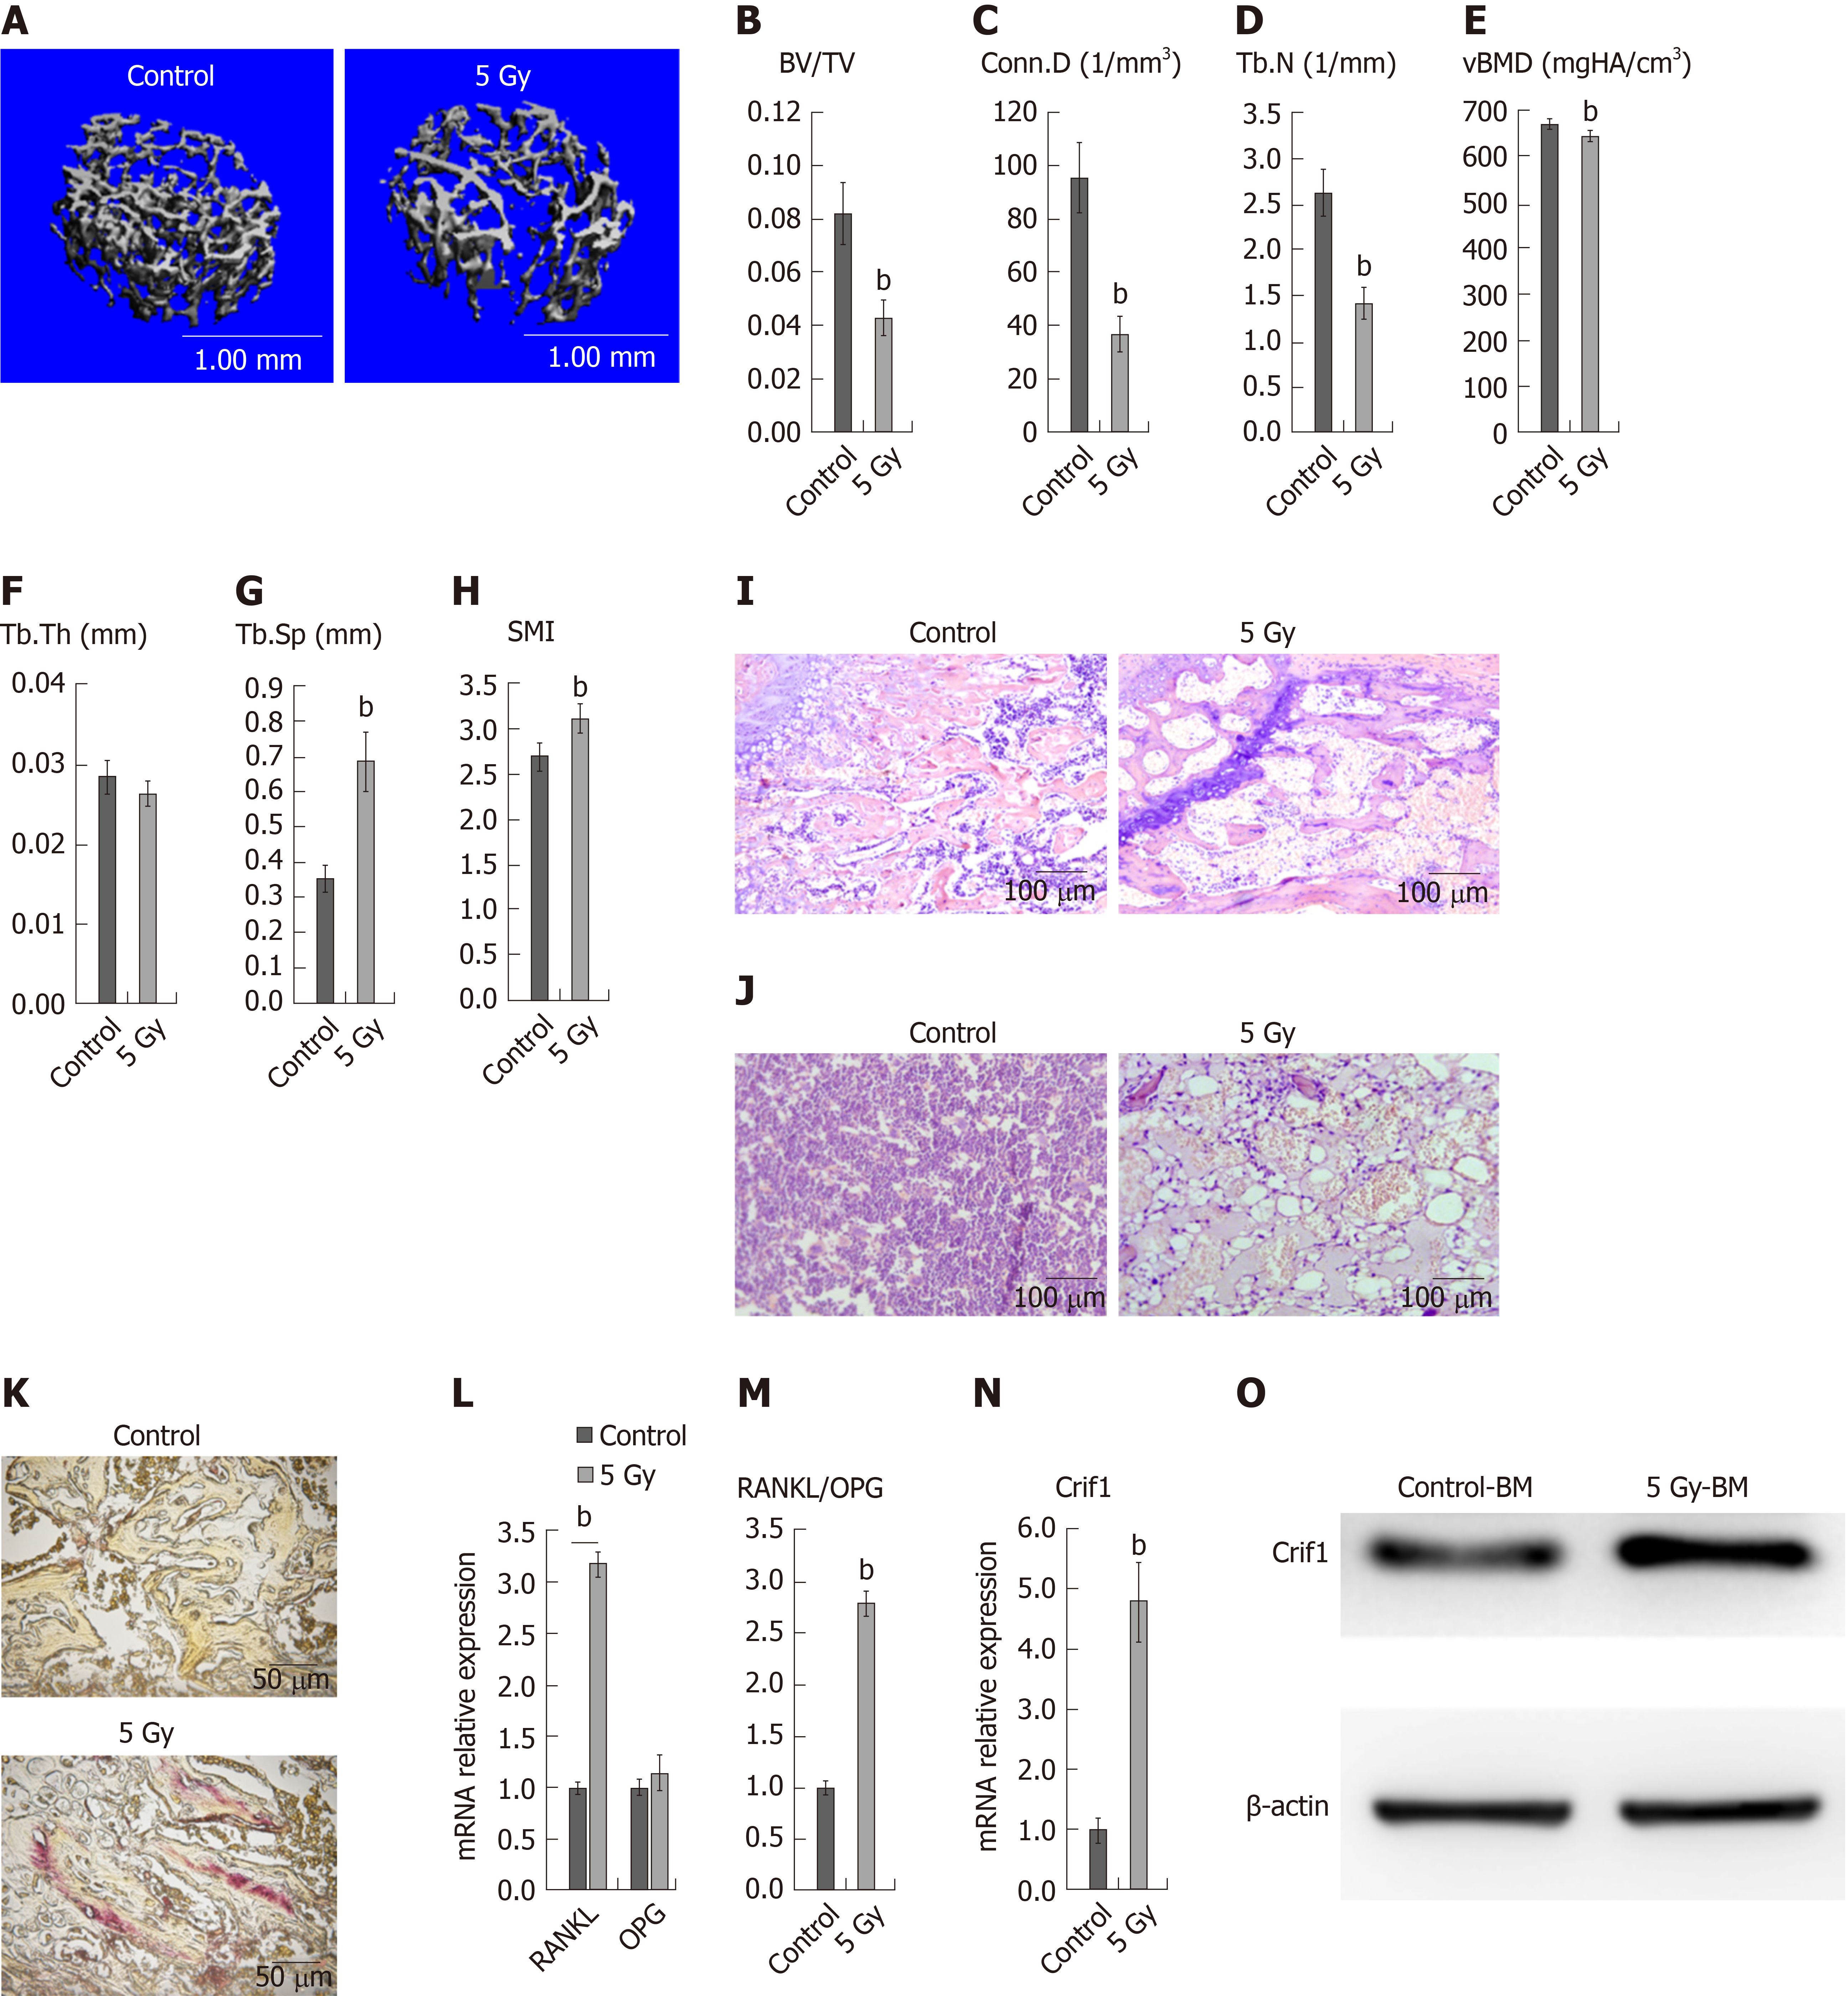
Figure 1 Radiation induces bone loss and increased CR6-interacting factor-1 expression in mice.
A: Micro-computed tomography images of the distal metaphysis of the femur. Mice (n = 6/group ) were exposed to Co-60 gamma rays, and received 5 Gy of whole-body sublethal irradiation at a rate of 0.69 Gy/min; B-H: Micro-computed tomography analysis of the trabecular bone volume/total volume (B), connectivity density (C), trabecular number (D), bone mineral density (E), trabecular thickness (F), trabecular spacing (G), and structure model index (H); I: Hematoxylin-eosin staining of femoral sections from irradiated mice and controls. Femoral sections from irradiated mice showed significantly decreased trabecular bone compared to controls; J: Hematoxylin-eosin staining of femoral sections from irradiated mice and controls. Femoral sections from irradiated mice showed that adipocytes increased significantly in irradiated mice; K: Tartrate-resistant acid phosphatase staining of femoral sections from irradiated mice and controls; L: Real-time quantitative polymerase chain reaction (RT-qPCR) analysis of receptor activator of nuclear factor κB ligand and osteoprotegerin mRNA expression in flushed whole bone marrow; M: Receptor activator of nuclear factor κB ligand/osteoprotegerin ratio based on RT-qPCR results; N: RT-qPCR analysis of CR6-interacting factor-1 mRNA expression in flushed whole bone marrow; O: Western blot analysis of CR6-interacting factor-1 expression in flushed whole bone marrow. aP < 0.05, bP < 0.01, and the bars represent the mean ± SD. OPG: Osteoprotegerin; RANKL: Receptor activator of nuclear factor κB ligand; Crif1: CR6-interacting factor-1; BM: Bone marrow; SMI: Structure model index; BV/TV: Bone volume/total volume; Conn.D: Connectivity density; Tb.N: Trabecular number; vBMD: Bone mineral density; Tb.Sp: Trabecular spacing; Tb.Th: Trabecular thickness.
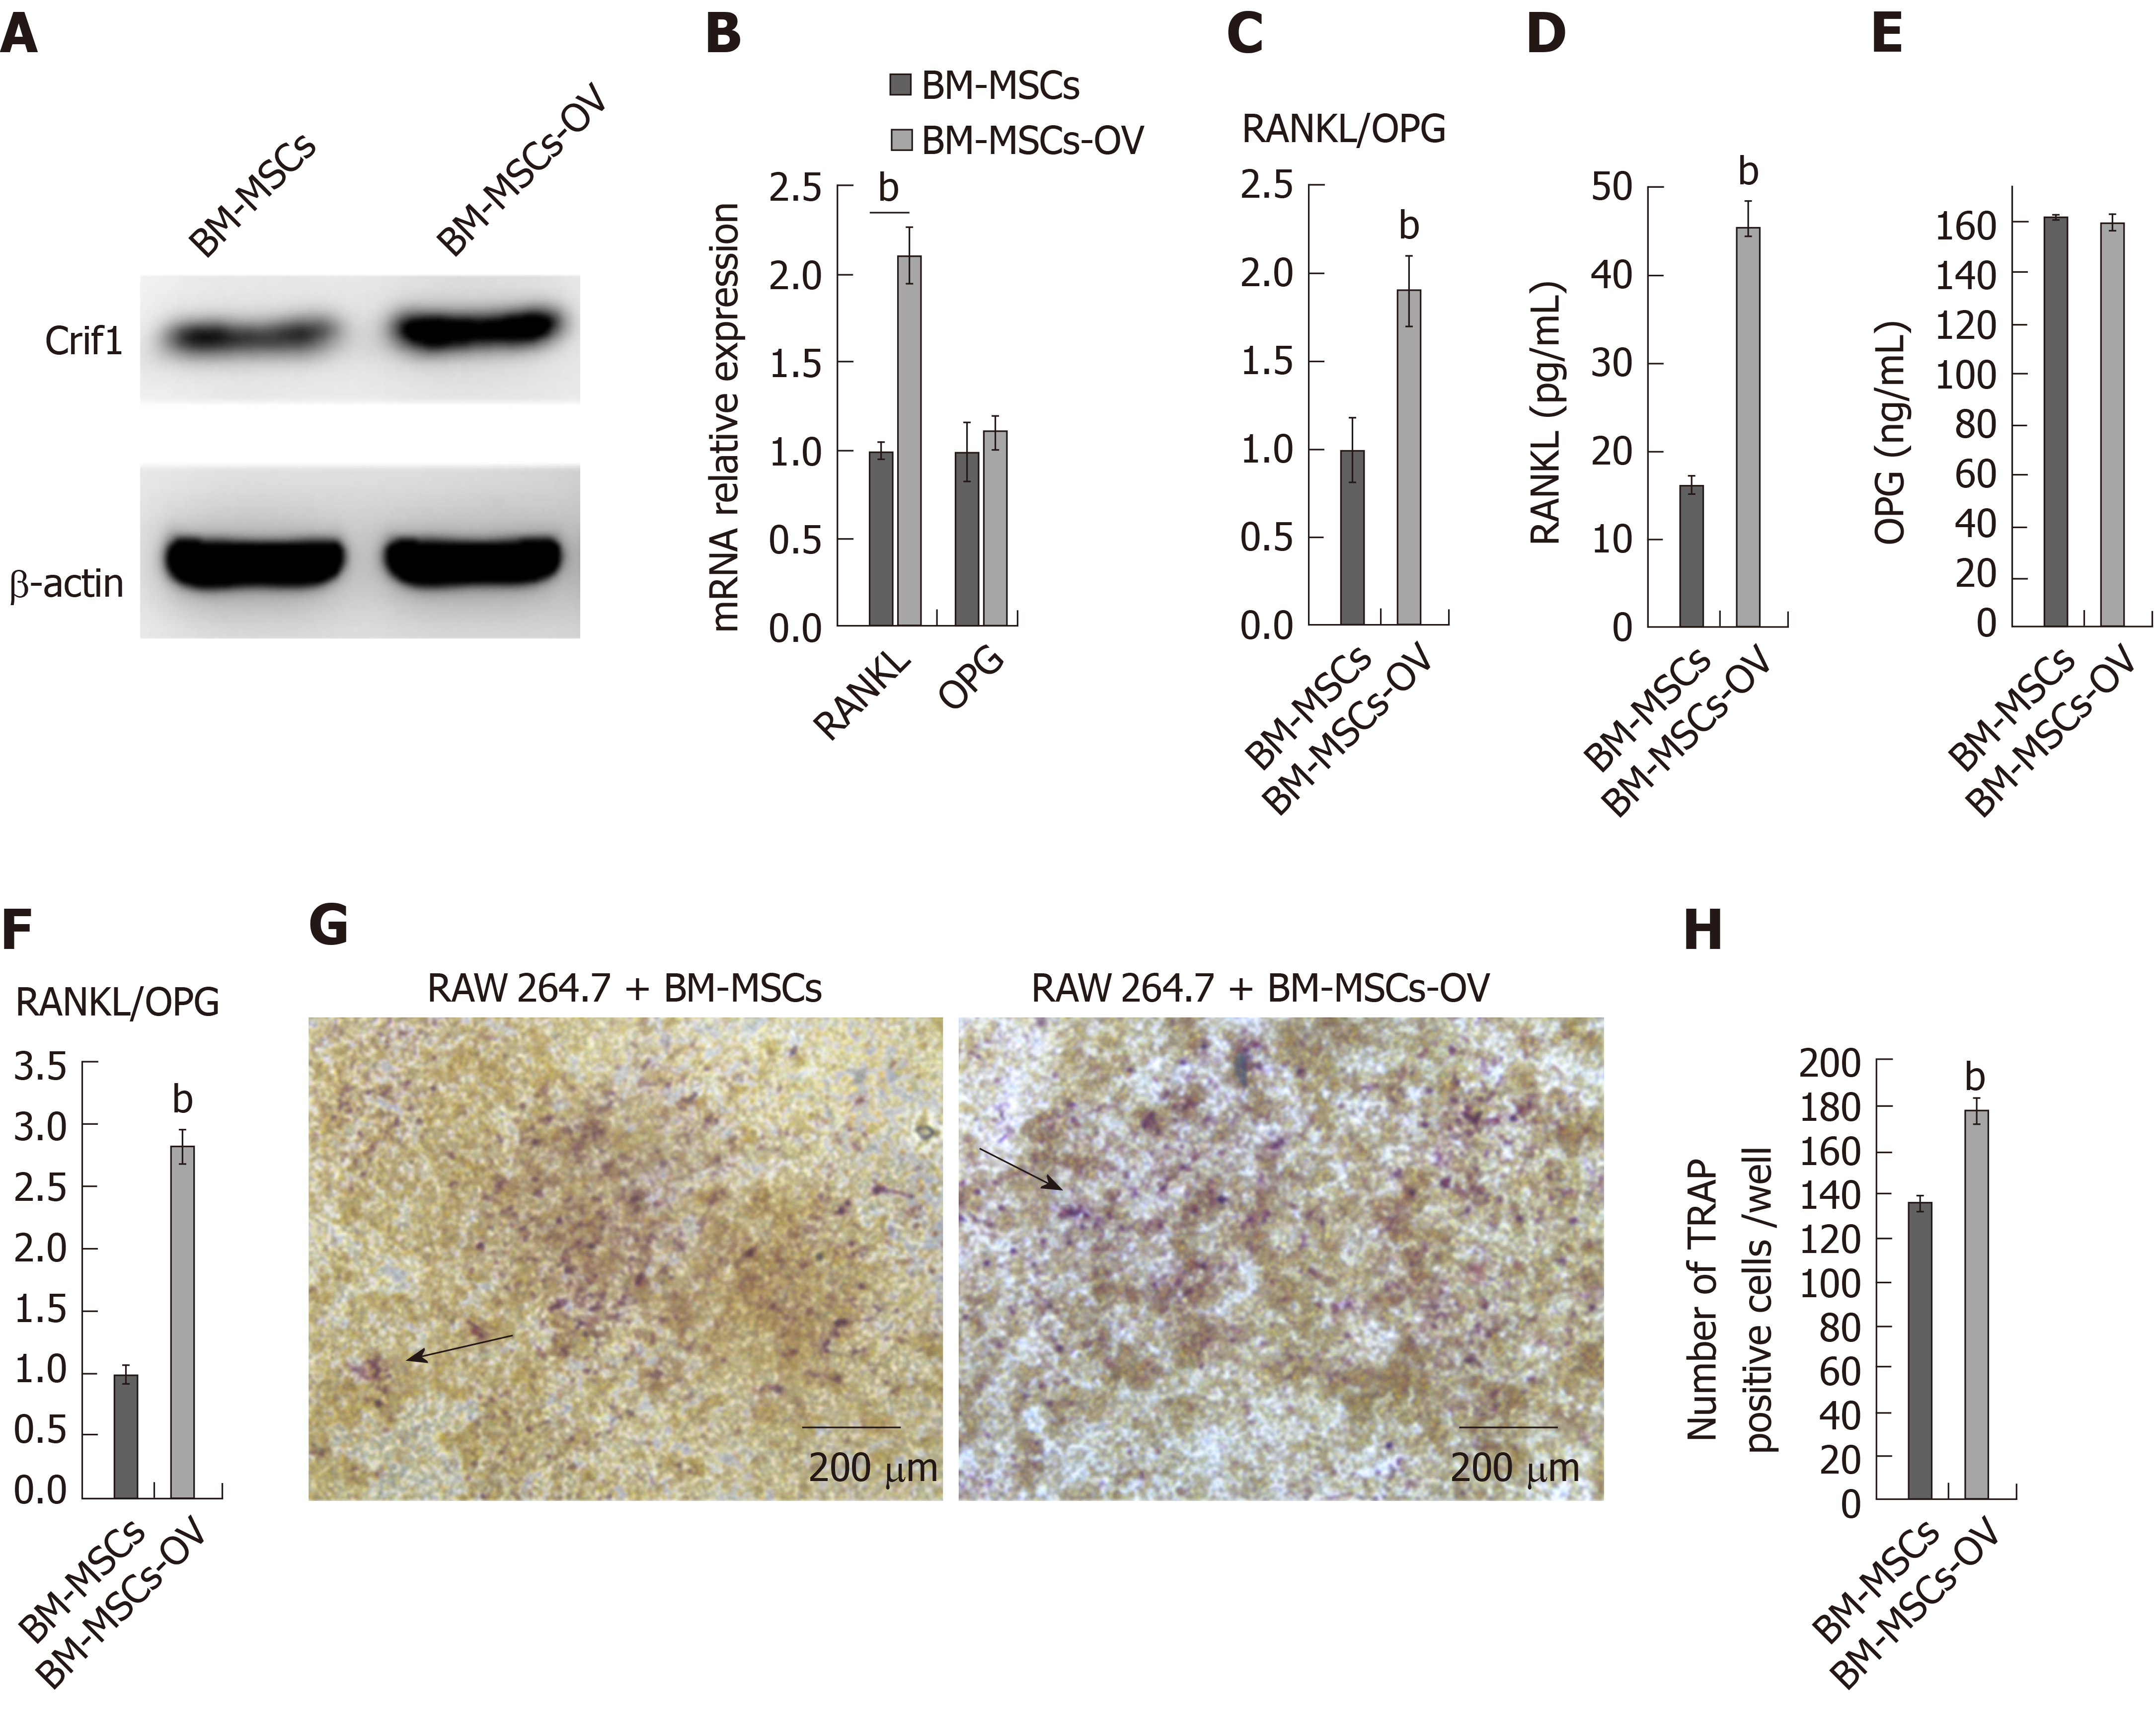
Figure 2 Overexpression of CR6-interacting factor-1 in bone marrow mesenchymal stem/stromal cells increases receptor activator of nuclear factor κB ligand secretion and osteoclastogenesis.
A: Western blot analysis of CR6-interacting factor-1 (Crif1) expression in mouse bone marrow mesenchymal stem/stromal cells (BM-MSCs). Mouse BM-MSCs were transfected with a Crif1 lentiviral overexpression vector; B: Real-time quantitative polymerase chain reaction analysis of receptor activator of nuclear factor κB ligand (RANKL) and osteoprotegerin (OPG) mRNA expression in BM-MSCs and Crif1-overexpressing BM-MSCs. BM-MSCs and Crif1-overexpressing BM-MSCs were cocultured with RAW264.7, respectively; C: RANKL/OPG ratio based on real-time quantitative polymerase chain reaction results; D: Enzyme linked immunosorbent assay analysis of RANKL protein levels in coculture supernatant medium; E: Enzyme linked immunosorbent assay analysis of OPG protein levels in coculture supernatant medium; F: RANKL/OPG ratio in coculture supernatant medium; G: Tartrate-resistant acid phosphatase staining of RAW264.7 cells after 7 d of coculture; H: Average number of tartrate-resistant acid phosphatase-positive cells/well (arrow) from RAW264.7 cells in coculture. aP < 0.05, bP < 0.01, and the bars represent the mean ± SD. OPG: Osteoprotegerin; RANKL: Receptor activator of nuclear factor κB ligand; Crif1: CR6-interacting factor-1; BM-MSCs: Bone marrow mesenchymal stem/stromal cells; BM-MSCs-OV: Crif1-overexpressing BM-MSCs.
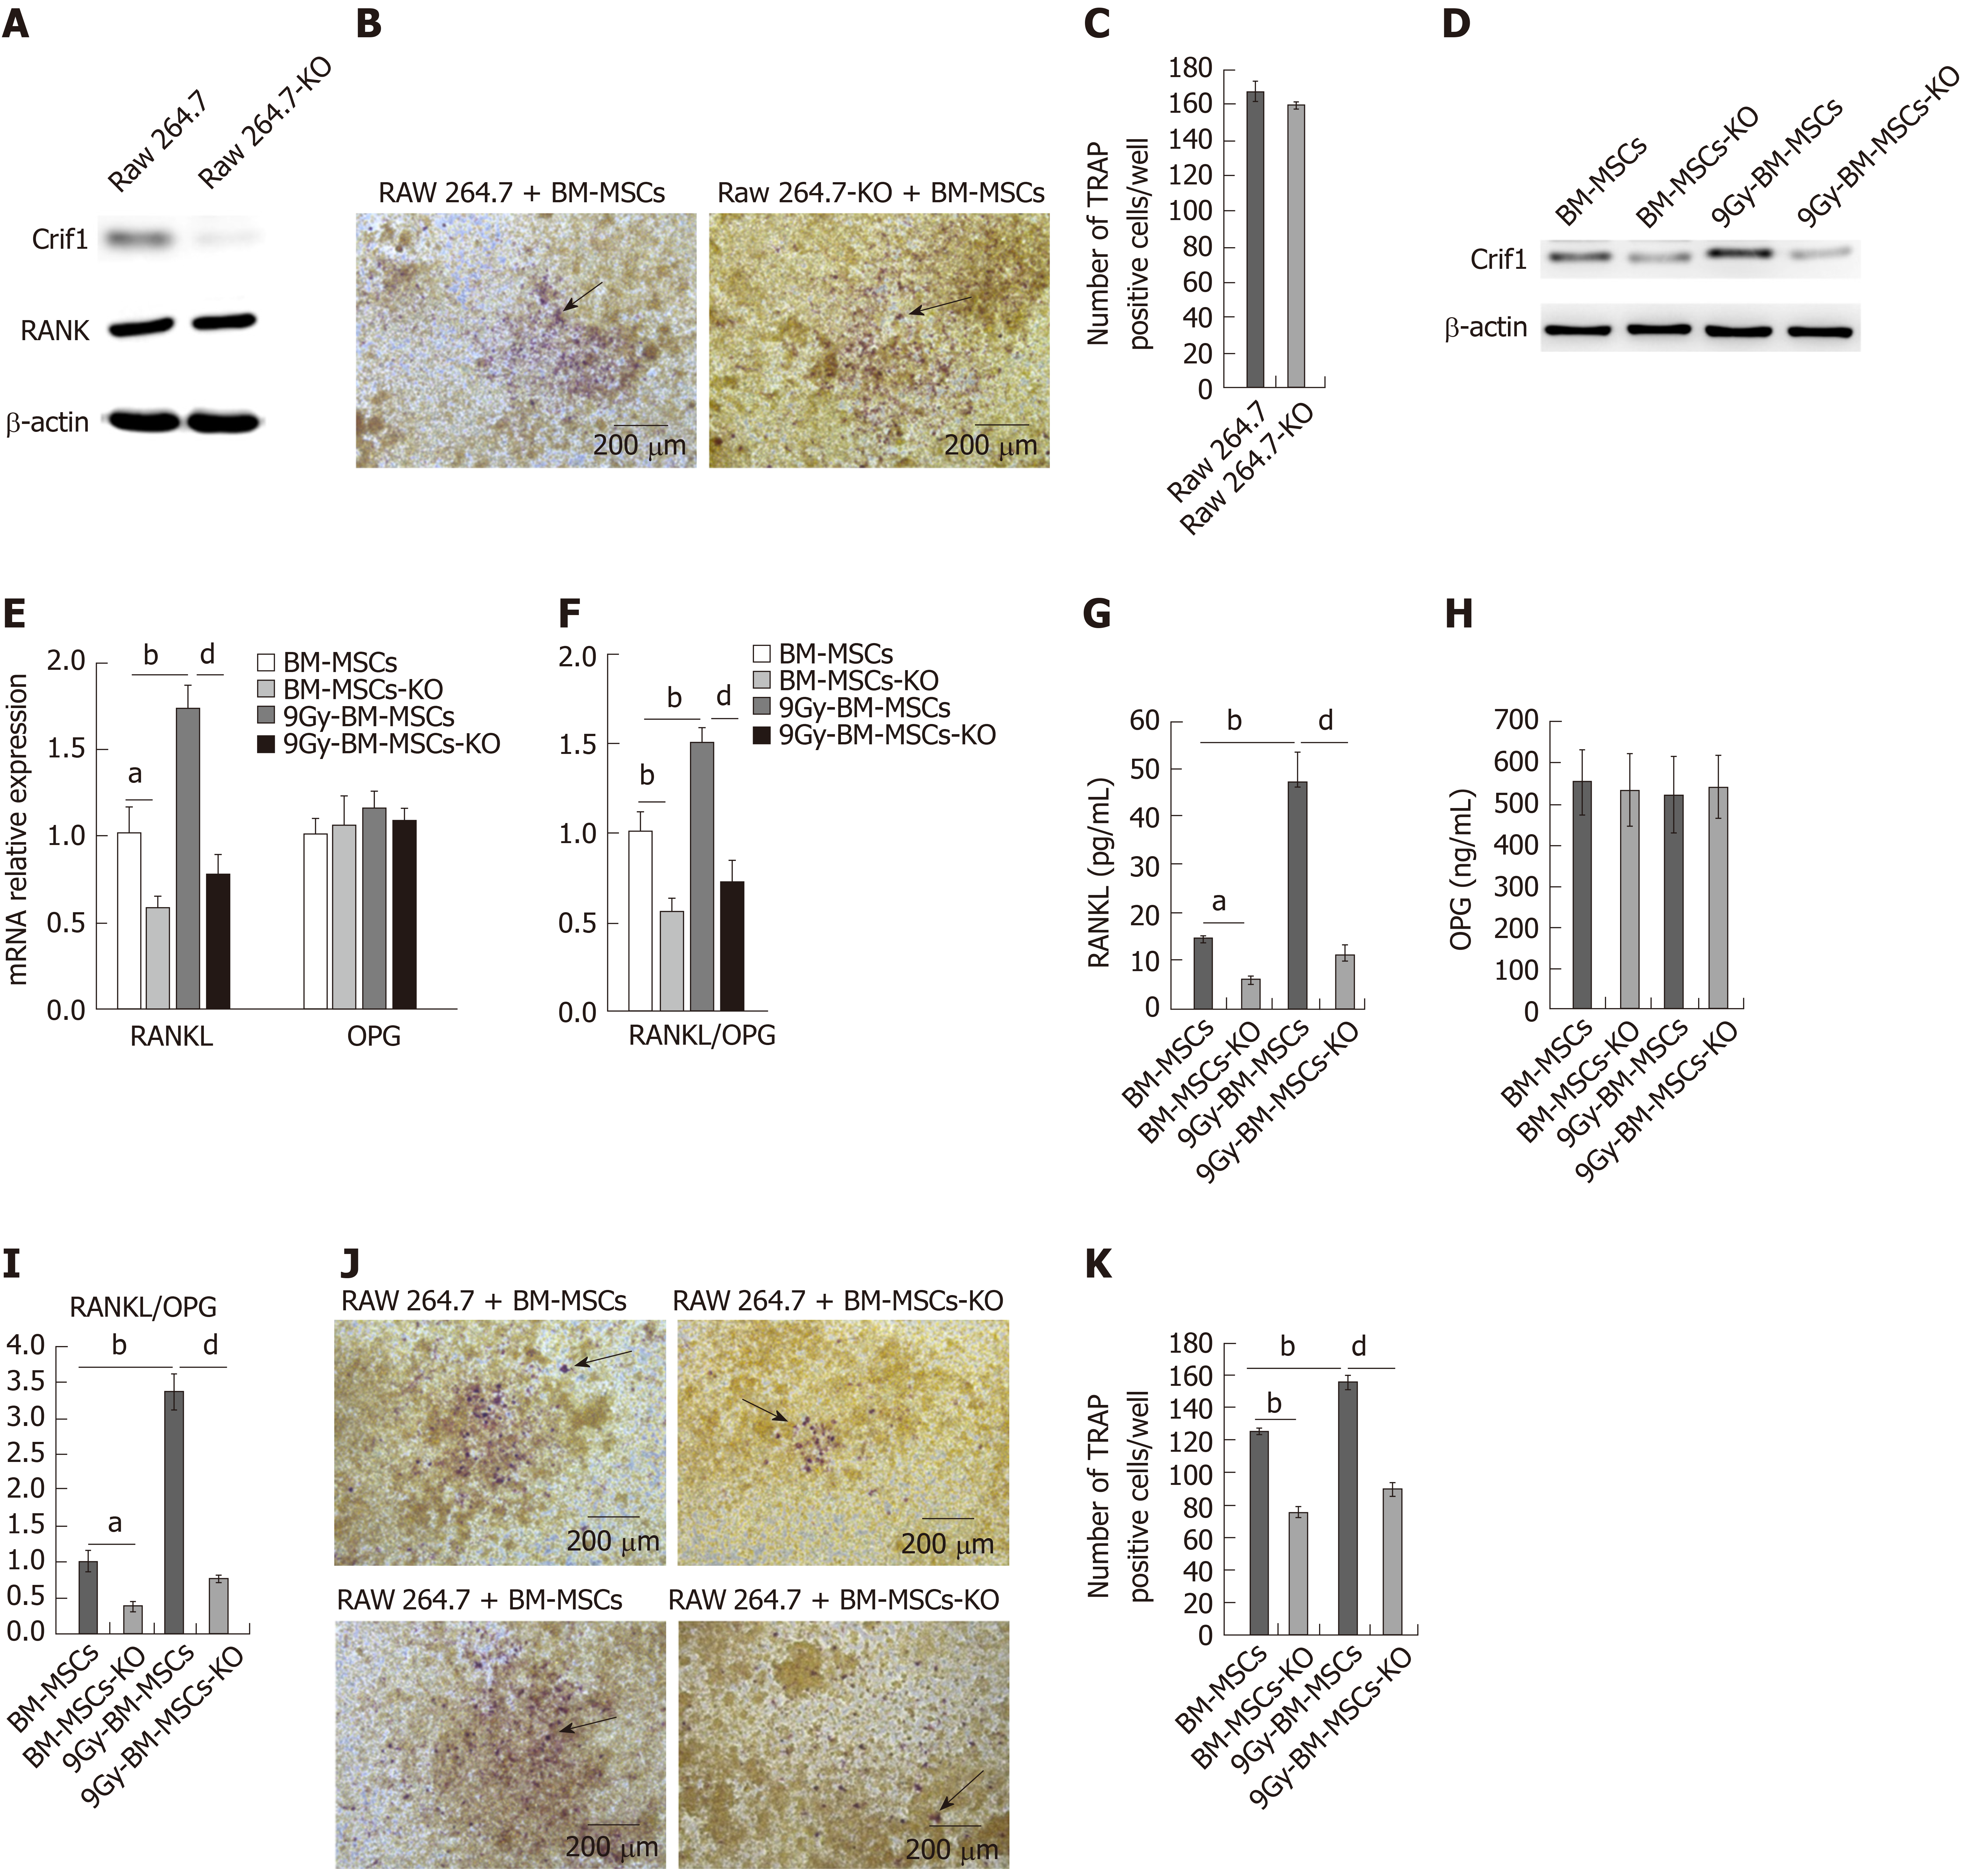
Figure 3 CR6-interacting factor-1 is involved in the regulation of receptor activator of nuclear factor κB ligand expression after radiation.
A: Western blot analysis of CR6-interacting factor-1 (Crif1) and receptor activator of nuclear factor κB expression in RAW264.7 cells. Crif1 was knocked out in RAW264.7 cells (RAW264.7-KO); B: Tartrate-resistant acid phosphatase (TRAP) staining of RAW264.7-KO and controls after 7 d of coculture with mouse bone marrow mesenchymal stem/stromal cells (BM-MSCs); C: Average number of TRAP-positive cells/well (arrow) from RAW264.7-KO and controls after 7 d of coculture with mouse BM-MSCs; D: Western blot analysis of Crif1 expression in BM-MSCs. Crif1 was knocked out in mouse BM-MSCs (BM-MSCs-KO), and BM-MSCs-KO and controls were irradiated with Co-60 at a single dose of 9 Gy; E: Real-time quantitative polymerase chain reaction analysis of receptor activator of nuclear factor κB ligand (RANKL) and osteoprotegerin (OPG) mRNA expression in BM-MSCs and BM-MSCs-KO. BM-MSCs and BM-MSCs-KO were cocultured with RAW264.7; F: RANKL/OPG ratio based on real-time quantitative polymerase chain reaction results; G: Enzyme linked immunosorbent assay analysis of RANKL protein levels in coculture supernatant medium; H: Enzyme linked immunosorbent assay analysis of OPG protein levels in coculture supernatant medium; I: RANKL/OPG ratio in coculture supernatant medium; J: TRAP staining of RAW264.7 after 7 d of coculture; K: Average number of TRAP-positive cells/well (arrow) from RAW264.7 in coculture. aP < 0.05 vs control (BM-MSCs), bP < 0.01 vs control (BM-MSCs); dP < 0.01 between 9 Gy-BM-MSCs and 9 Gy-BM-MSCs-KO, and the bars represent the mean ± standard deviation. BM-MSCs: Bone marrow mesenchymal stem/stromal cells; BM-MSCs-KO: Crif1 was knocked out from mouse BM-MSCs; RAW264.7-KO: Crif1 was knocked out from RAW264.7 cells; OPG: Osteoprotegerin; RANKL: Receptor activator of nuclear factor κB ligand.
Figure 4 CR6-interacting factor-1 mediates adipogenesis and receptor activator of nuclear factor κB ligand secretion in adipocytes.
A: Oil red O staining analysis of mouse bone marrow mesenchymal stem/stromal cells (BM-MSCs) after 21 d of adipogenic differentiation. Crif1 was knocked out in mouse BM-MSCs (BM-MSCs-KO), and knockout cells and controls were irradiated with 9 Gy of Co-60, and then treated with mouse mesenchymal stem cell adipogenic differentiation medium (Ad) to induce adipogenesis; B: The dye from oil red O staining was extracted using isopropanol, and the optical density at 510 nm was measured using Benchmark Plus; C: Western blot analysis of adipogenesis-related markers and transcription factors PPARγ and AP2 in mouse BM-MSCs after 21 d of adipogenic differentiation; D: Real-time quantitative polymerase chain reaction analysis of receptor activator of nuclear factor κB ligand (RANKL) and osteoprotegerin (OPG) mRNA expression in BM-MSCs and BM-MSCs-KO; E: RANKL/OPG ratio based on real-time quantitative polymerase chain reaction results; F: Enzyme linked immunosorbent assay analysis of RANKL protein levels in supernatant Ad; G: Enzyme linked immunosorbent assay analysis of OPG protein levels in supernatant Ad; H: RANKL/OPG ratio in supernatant Ad. aP < 0.05 vs control (BM-MSCs), bP < 0.01 vs control (BM-MSCs); dP < 0.01 between 9 Gy-BM-MSCs and 9 Gy-BM-MSCs-KO, and the bars represent the mean ± SD. BM-MSCs: Bone marrow mesenchymal stem/stromal cells; BM-MSCs-KO: Crif1 knockout mouse BM-MSCs; OPG: Osteoprotegerin; RANKL: Receptor activator of nuclear factor κB ligand.
Figure 5 CR6-interacting factor-1 promotes receptor activator of nuclear factor κB ligand secretion by modulating the cAMP/PKA signaling pathway.
A: Real-time quantitative polymerase chain reaction (RT-qPCR) analysis of receptor activator of nuclear factor κB ligand (RANKL) and osteoprotegerin (OPG) mRNA expression in bone marrow mesenchymal stem/stromal cells (BM-MSCs) and Crif1 knockout BM-MSCs treated with 25 µmol/L forskolin in the coculture with RAW264.7; B: RANKL/OPG ratio based on RT-qPCR results; C: Enzyme linked immunosorbent assay (ELISA) analysis of RANKL levels in coculture supernatant medium treated with 25 µmol/L forskolin; D: ELISA analysis of OPG levels in coculture supernatant medium treated with 25 µmol/L forskolin; E: RANKL/OPG ratio in coculture supernatant medium treated with 25 µmol/L forskolin; F: RT-qPCR analysis of RANKL and OPG mRNA expression in BM-MSCs and BM-MSCs-OV treated with 20 µmol/L H-89 in the coculture with RAW264.7; G: RANKL/OPG ratio based on RT-qPCR results; H: ELISA analysis of RANKL levels in coculture supernatant medium treated with 20 µmol/L H-89; I: ELISA analysis of OPG levels in coculture supernatant medium treated with 20 µmol/L H-89; J: RANKL/OPG ratio in coculture supernatant medium treated with 20 µmol/L H-89; K: Tartrate-resistant acid phosphatase (TRAP) staining of RAW264.7 cells in coculture treated with 25 µmol/L forskolin; L: Average number of TRAP-positive cells/well (arrow) from RAW264.7 cells in coculture treated with 25 µmol/L forskolin; M: Western blot analysis of phospho-cyclic adenosine monophosphate response element-binding protein phosphorylation levels in BM-MSCs in coculture treated with 25 µmol/L forskolin; N: TRAP staining of RAW264.7 in coculture treated with 20 µmol/L H-89; O: Average number of TRAP-positive cells/well (arrow) from RAW264.7 in coculture treated with 20 µmol/L H-89; P: Western blot analysis of phospho-cyclic adenosine monophosphate response element-binding protein phosphorylation levels in BM-MSCs in coculture treated with 20 µmol/L H-89. bP < 0.01 vs control (BM-MSCs); dP < 0.01 between between BM-MSCs treated with 25 µmol/L forskolin and Crif1 knockout BM-MSCs treated with 25 µmol/L forskolin; fP < 0.01 between Crif1-overexpressing BM-MSCs and Crif1-overexpressing BM-MSCs treated with 20 µmol/L H-89, and the bars represent the mean ± SD. BM-MSCs: Bone marrow mesenchymal stem/stromal cells; BM-MSCs-KO: Crif1 knockout BM-MSCs; OPG: Osteoprotegerin; RANKL: Receptor activator of nuclear factor κB ligand; CREB: Cyclic adenosine monophosphate response element-binding protein.
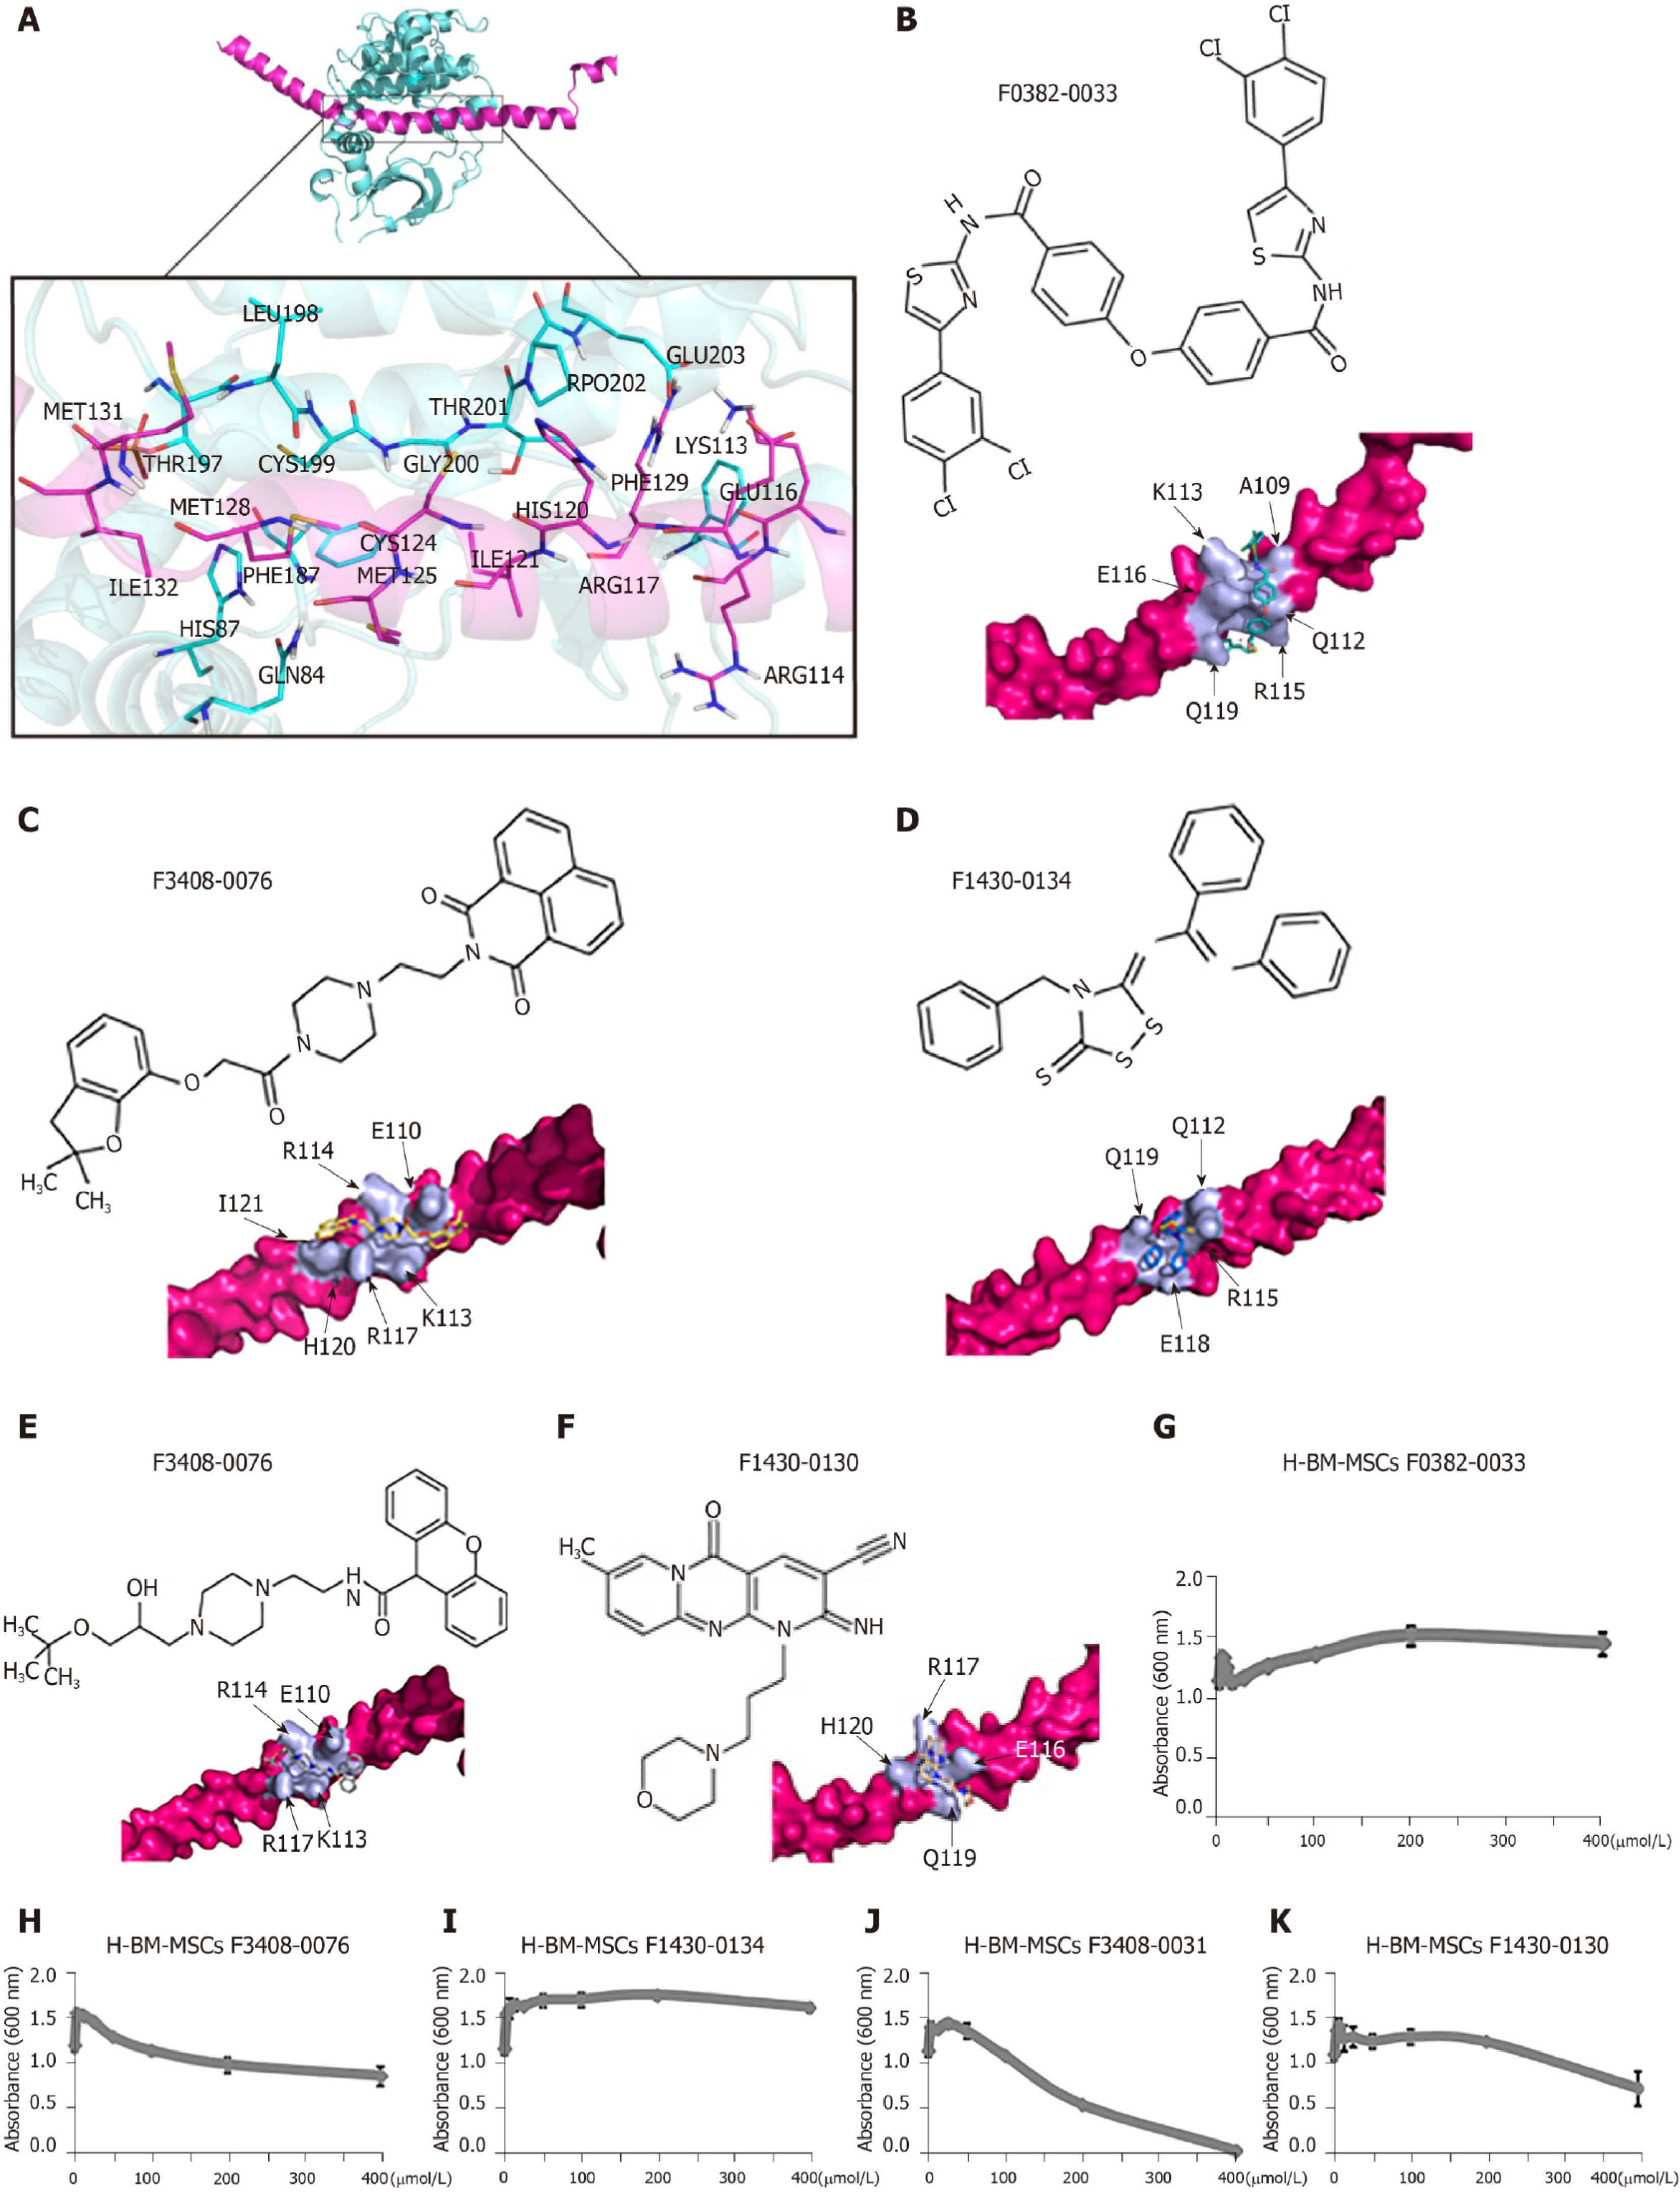
Figure 6 CR6-interacting factor-1-protein kinase cyclic adenosine monophosphate-activited catalytic subunit alpha interaction model and the inhibition potential of the lowest toxic effect of compounds.
A: CR6-interacting factor-1 (Crif1)-protein kinase cyclic adenosine monophosphate-activited catalytic subunit alpha (PRKACA) interaction model showing Crif1 (colored in rose red) and PRKACA (colored in cyan). Interface amino acids are shown as sticks and colored in rose red (for Crif1) and cyan (for PRKACA) and indicated as a zoomed-in view in the inset figure; B-F: Chemical structure of each inhibitor molecule and their docked pose on Crif1 (colored in rose red, surface view). Docked molecule (stick) and the amino acids involved in the hydrophobic interactions (light purple) are shown. F0382-0033 (B), F3408-0076 (C), F1430-0134 (D), F3408-0031 (E), and F1430-0130 (F); G-K: A tetrazolium salt (WST-8) assay was carried out to study the toxic effect of compounds on the H-BM-MSCs. F0382-0033 (G), F3408-0076 (H), F1430-0134 (I), F3408-0031 (J), and F1430-0130 (K). The bars represent the mean ± standard deviation. H-BM-MSCs: Human bone marrow mesenchymal stem/stromal cells.
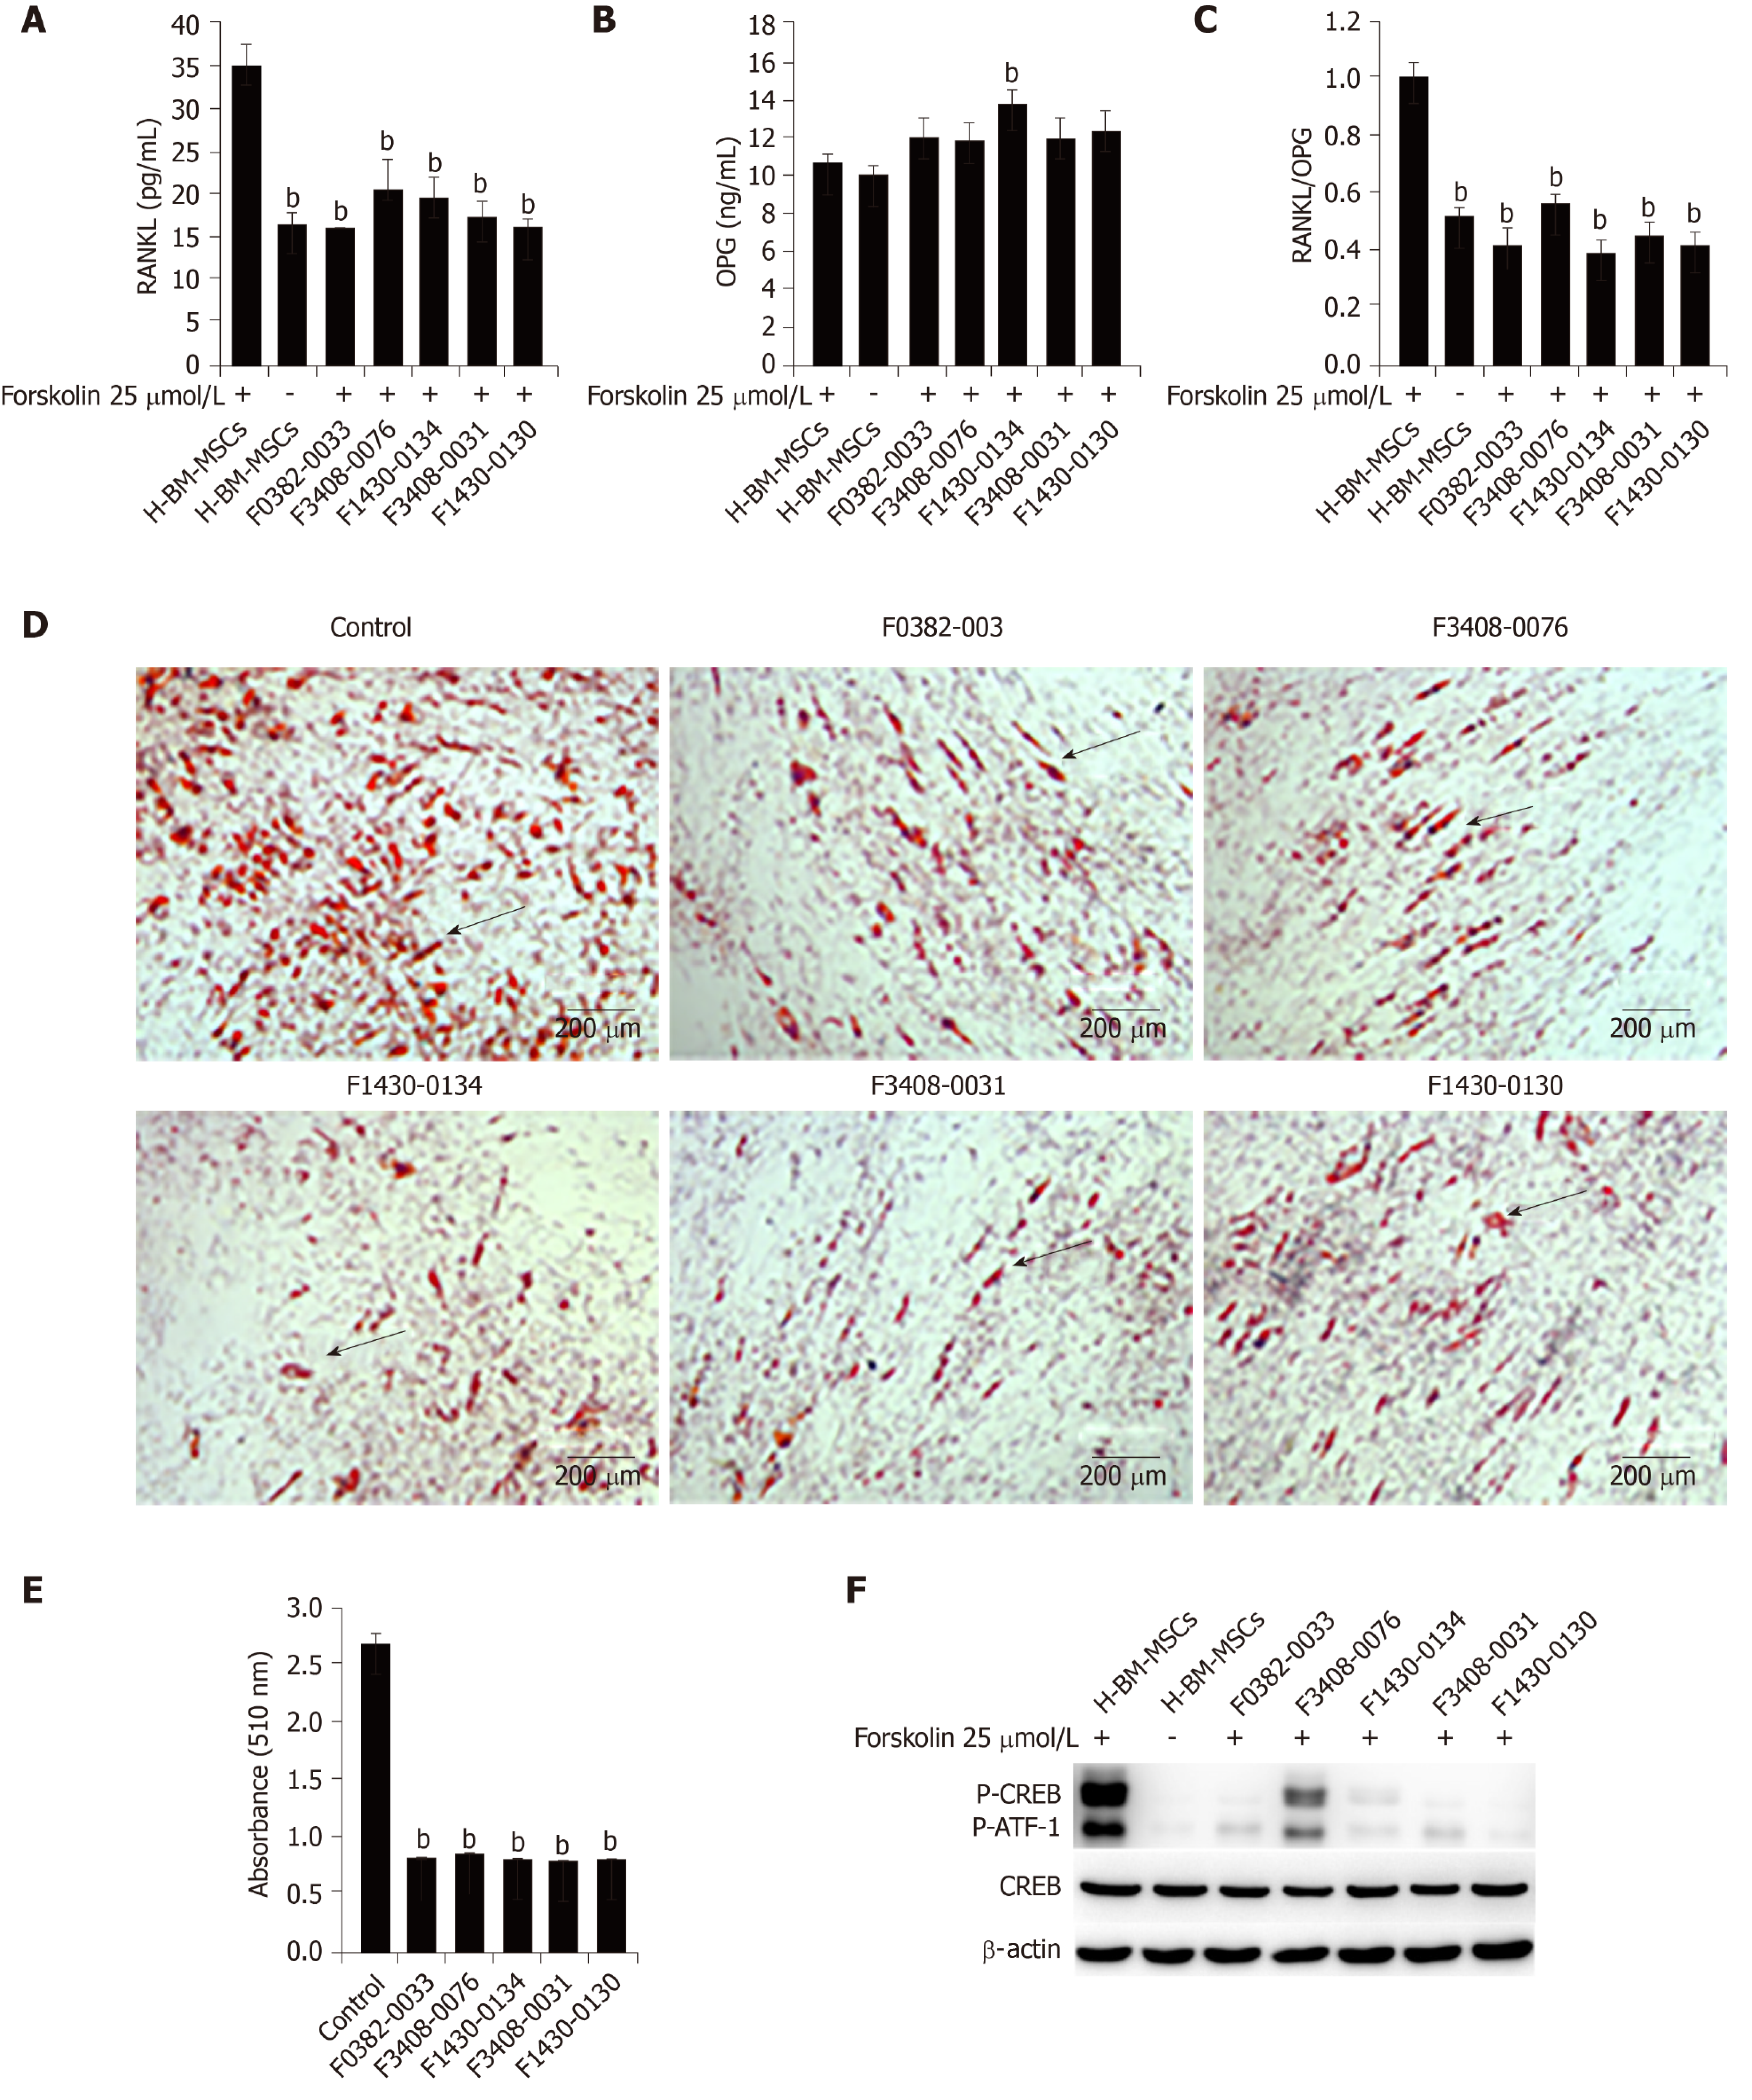
Figure 7 CR6-interacting factor-1 inhibitors effectively suppress receptor activator of nuclear factor κB ligand secretion and adipogenesis.
A: Enzyme linked immunosorbent assay (ELISA) analysis of receptor activator of nuclear factor κB ligand protein levels in the supernatant medium. Human bone marrow mesenchymal stem/stromal cells (H-BM-MSCs) were pretreated with five different compounds (25 µmol/L) followed by treatment with forskolin (25 µmol/L), and supernatant medium was collected for ELISA after 3 d; B: ELISA analysis of osteoprotegerin protein levels in supernatant medium; C: Receptor activator of nuclear factor κB ligand/osteoprotegerin ratio in supernatant medium; D: Oil red O staining analysis of H-BM-MSCs after 21 d of adipogenic differentiation. H-BM-MSCs were pretreated with five different compounds (25 µmol/L) followed by adipogenic induction; E: The dye from oil red O staining was extracted using isopropanol, and the optical density at 510 nm was measured using Benchmark Plus; F: Western blot analysis of cyclic adenosine monophosphate response element-binding protein phosphorylation levels. H-BM-MSCs were pretreated with five different compounds (25 µmol/L) followed by treatment with forskolin (25 µmol/L) and total protein lysates were extracted for cyclic adenosine monophosphate response element-binding protein phosphorylation detection after 1 h. aP < 0.05, bP < 0.01, and the bars represent the mean ± SD. OPG: Osteoprotegerin; RANKL: Receptor activator of nuclear factor κB ligand; CREB: Cyclic adenosine monophosphate response element-binding protein; H-BM-MSCs: Human bone marrow mesenchymal stem/stromal cells.
- Citation: Xiang LX, Ran Q, Chen L, Xiang Y, Li FJ, Zhang XM, Xiao YN, Zou LY, Zhong JF, Li SC, Li ZJ. CR6-interacting factor-1 contributes to osteoclastogenesis by inducing receptor activator of nuclear factor κB ligand after radiation. World J Stem Cells 2020; 12(3): 222-240
- URL: https://www.wjgnet.com/1948-0210/full/v12/i3/222.htm
- DOI: https://dx.doi.org/10.4252/wjsc.v12.i3.222


