Copyright
©The Author(s) 2020.
World J Stem Cells. Oct 26, 2020; 12(10): 1171-1183
Published online Oct 26, 2020. doi: 10.4252/wjsc.v12.i10.1171
Published online Oct 26, 2020. doi: 10.4252/wjsc.v12.i10.1171
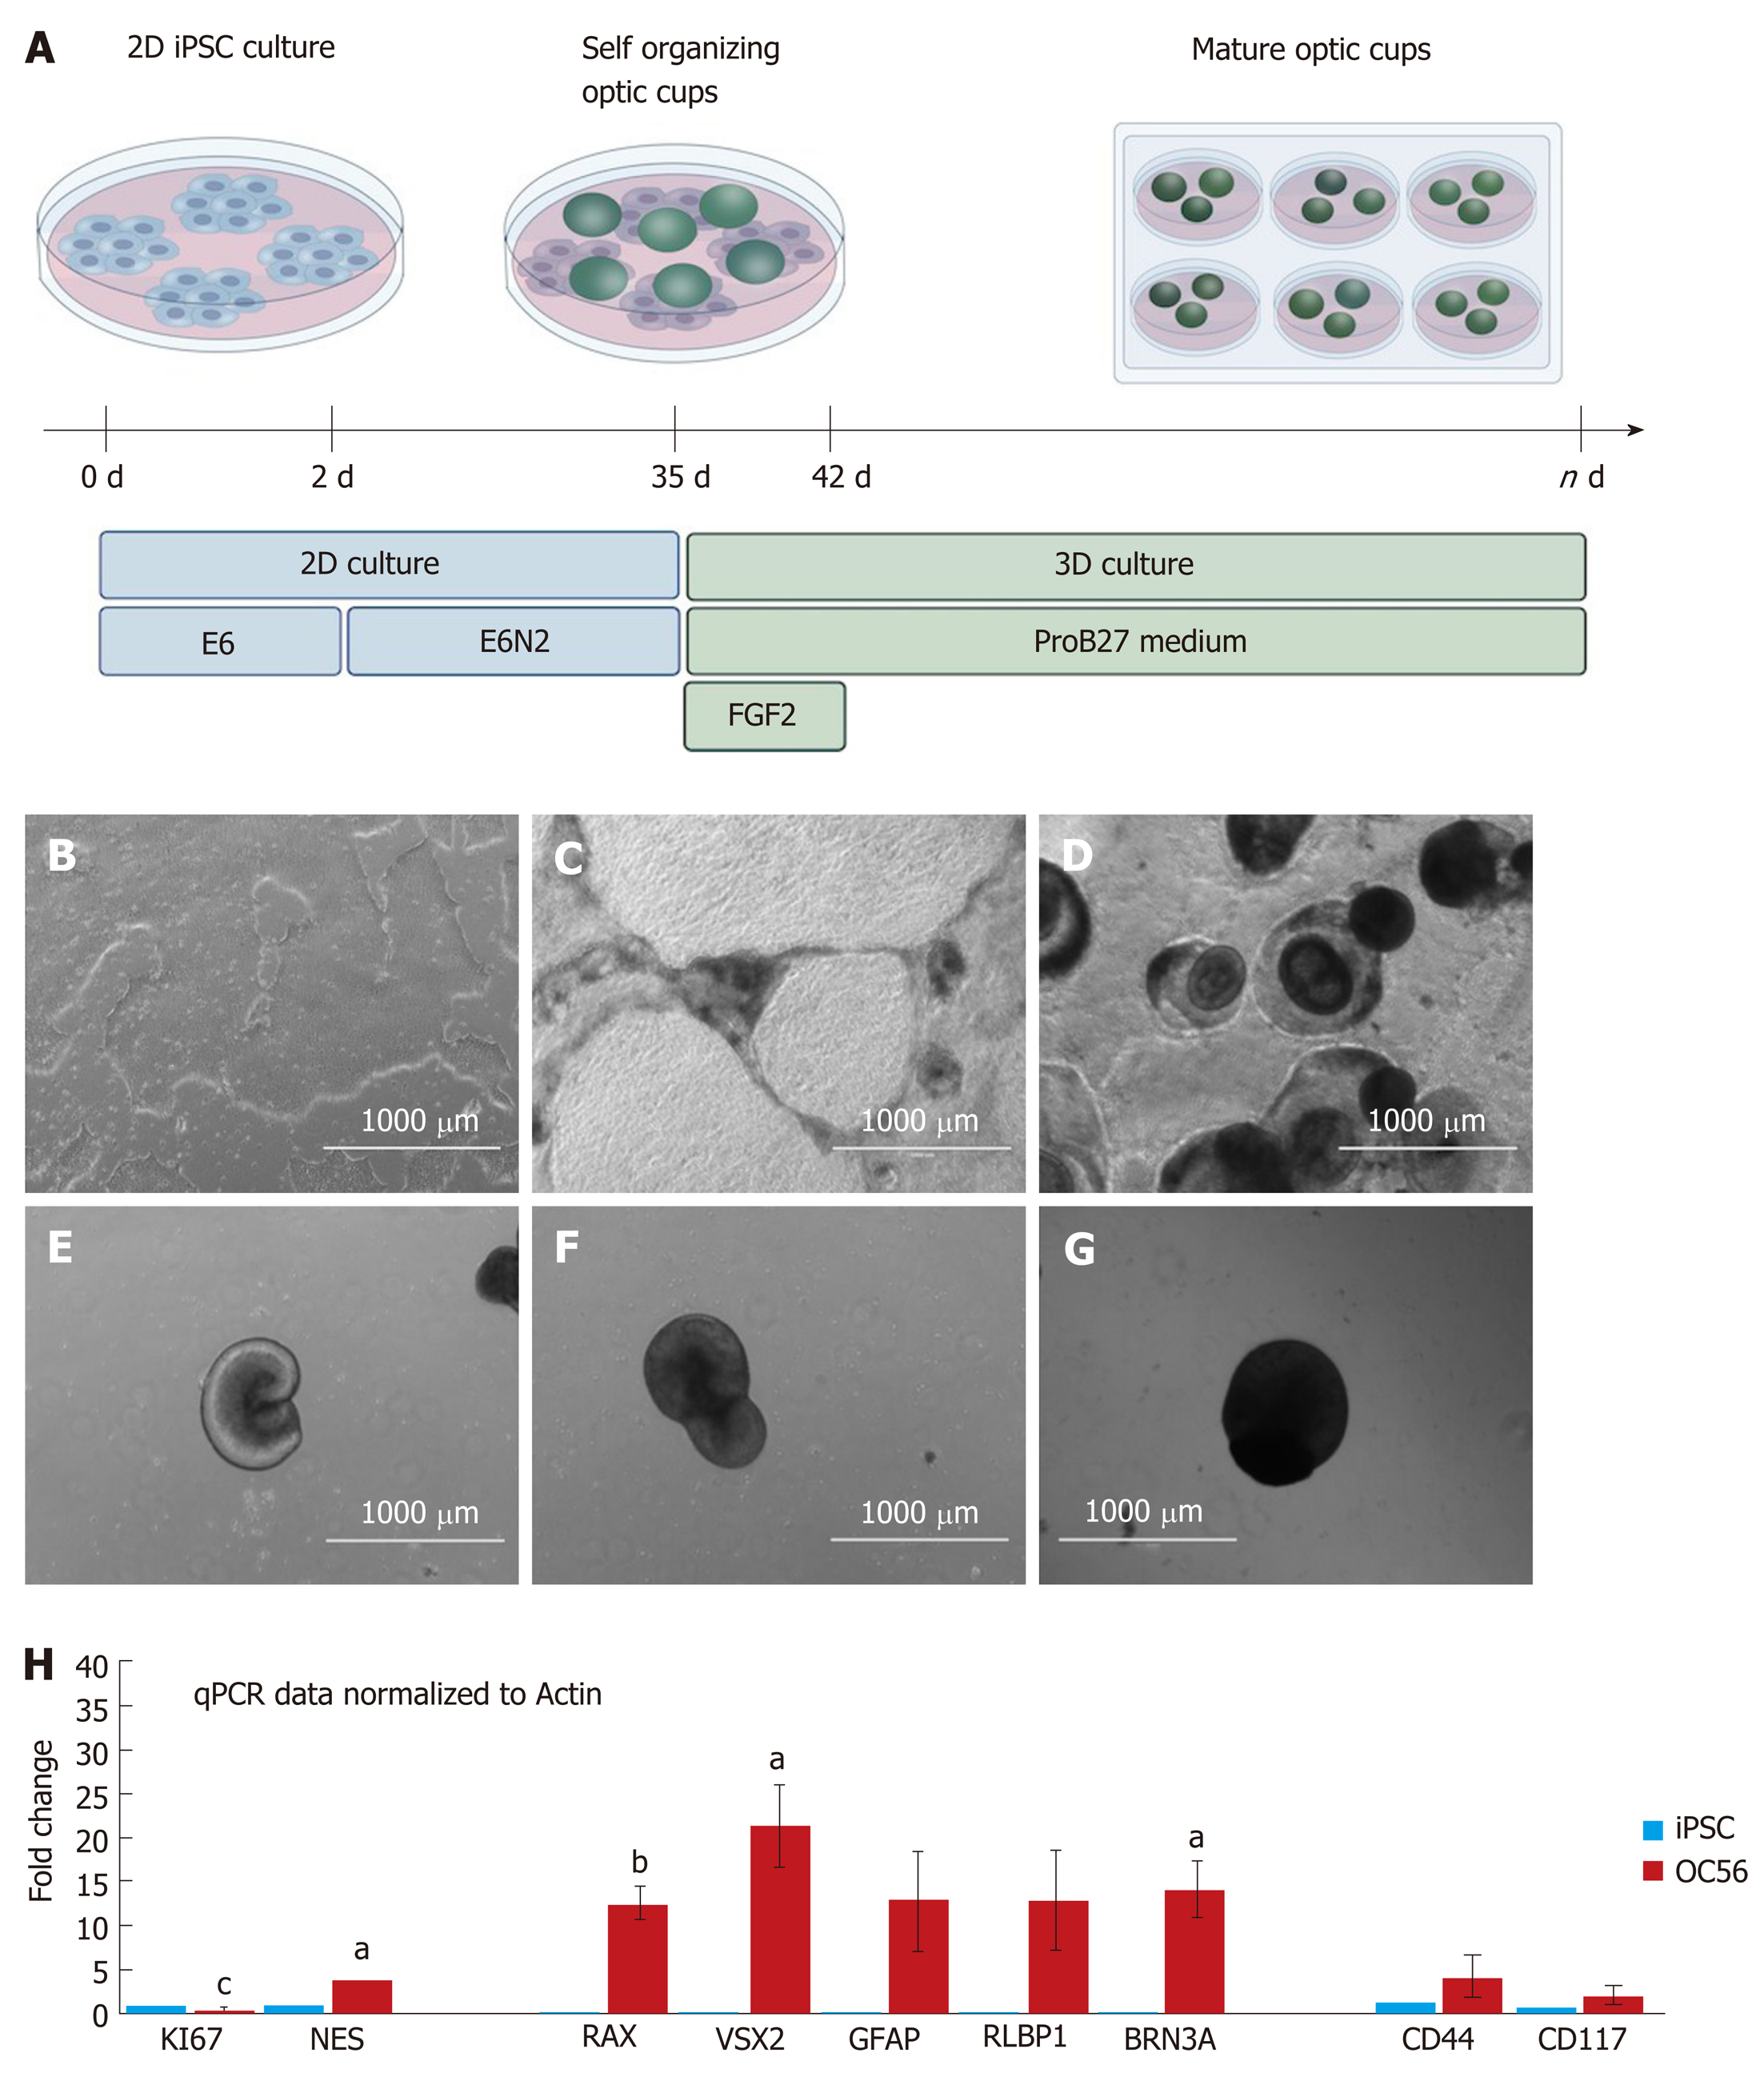
Figure 1 Differentiation of human induced pluripotent stem cells into retinal organoids and validation of retinal ganglion cell- and Müller glia-specific markers.
A: Schematic overview of the differentiation protocol, including key steps, media and growth factor components; B: Monolayer of human induced pluripotent stem cell (hiPSC), 70%-80% confluent at time of induced differentiation; C: At d6 after induction, dark pigmented areas emerge; D: At d14 after induction, dark areas form 3D structures on top of the cell monolayer; E: At d20 after induction, optic vesicles form on the monolayer; F: D35 after induction when the optic vesicles are removed from the monolayer of cells; G: D56 retinal organoids (ROs) in non-adherent culture before analyses. Properly developed optic cups are spheroidal in form. Structures without a smooth periphery have not properly developed and were discarded; H: Quantitative PCR analyses for the proliferation marker Ki67 showing decreased expression in ROs at day 56 (red bar) compared with hiPSC (blue bar). Increased expression of the neural progenitor marker NESTIN in RGs compared to hiPSC and increased expression of the retinal ganglion cell and Müller glia markers RAX, VSX2, GFAP, RLBP1, BRN3A, CD44 & CD117 in RGs. Statistically significant differences are labeled (aP < 0.05; bP <0.01 and cP < 0.001). iPSC: Induced pluripotent stem cell.
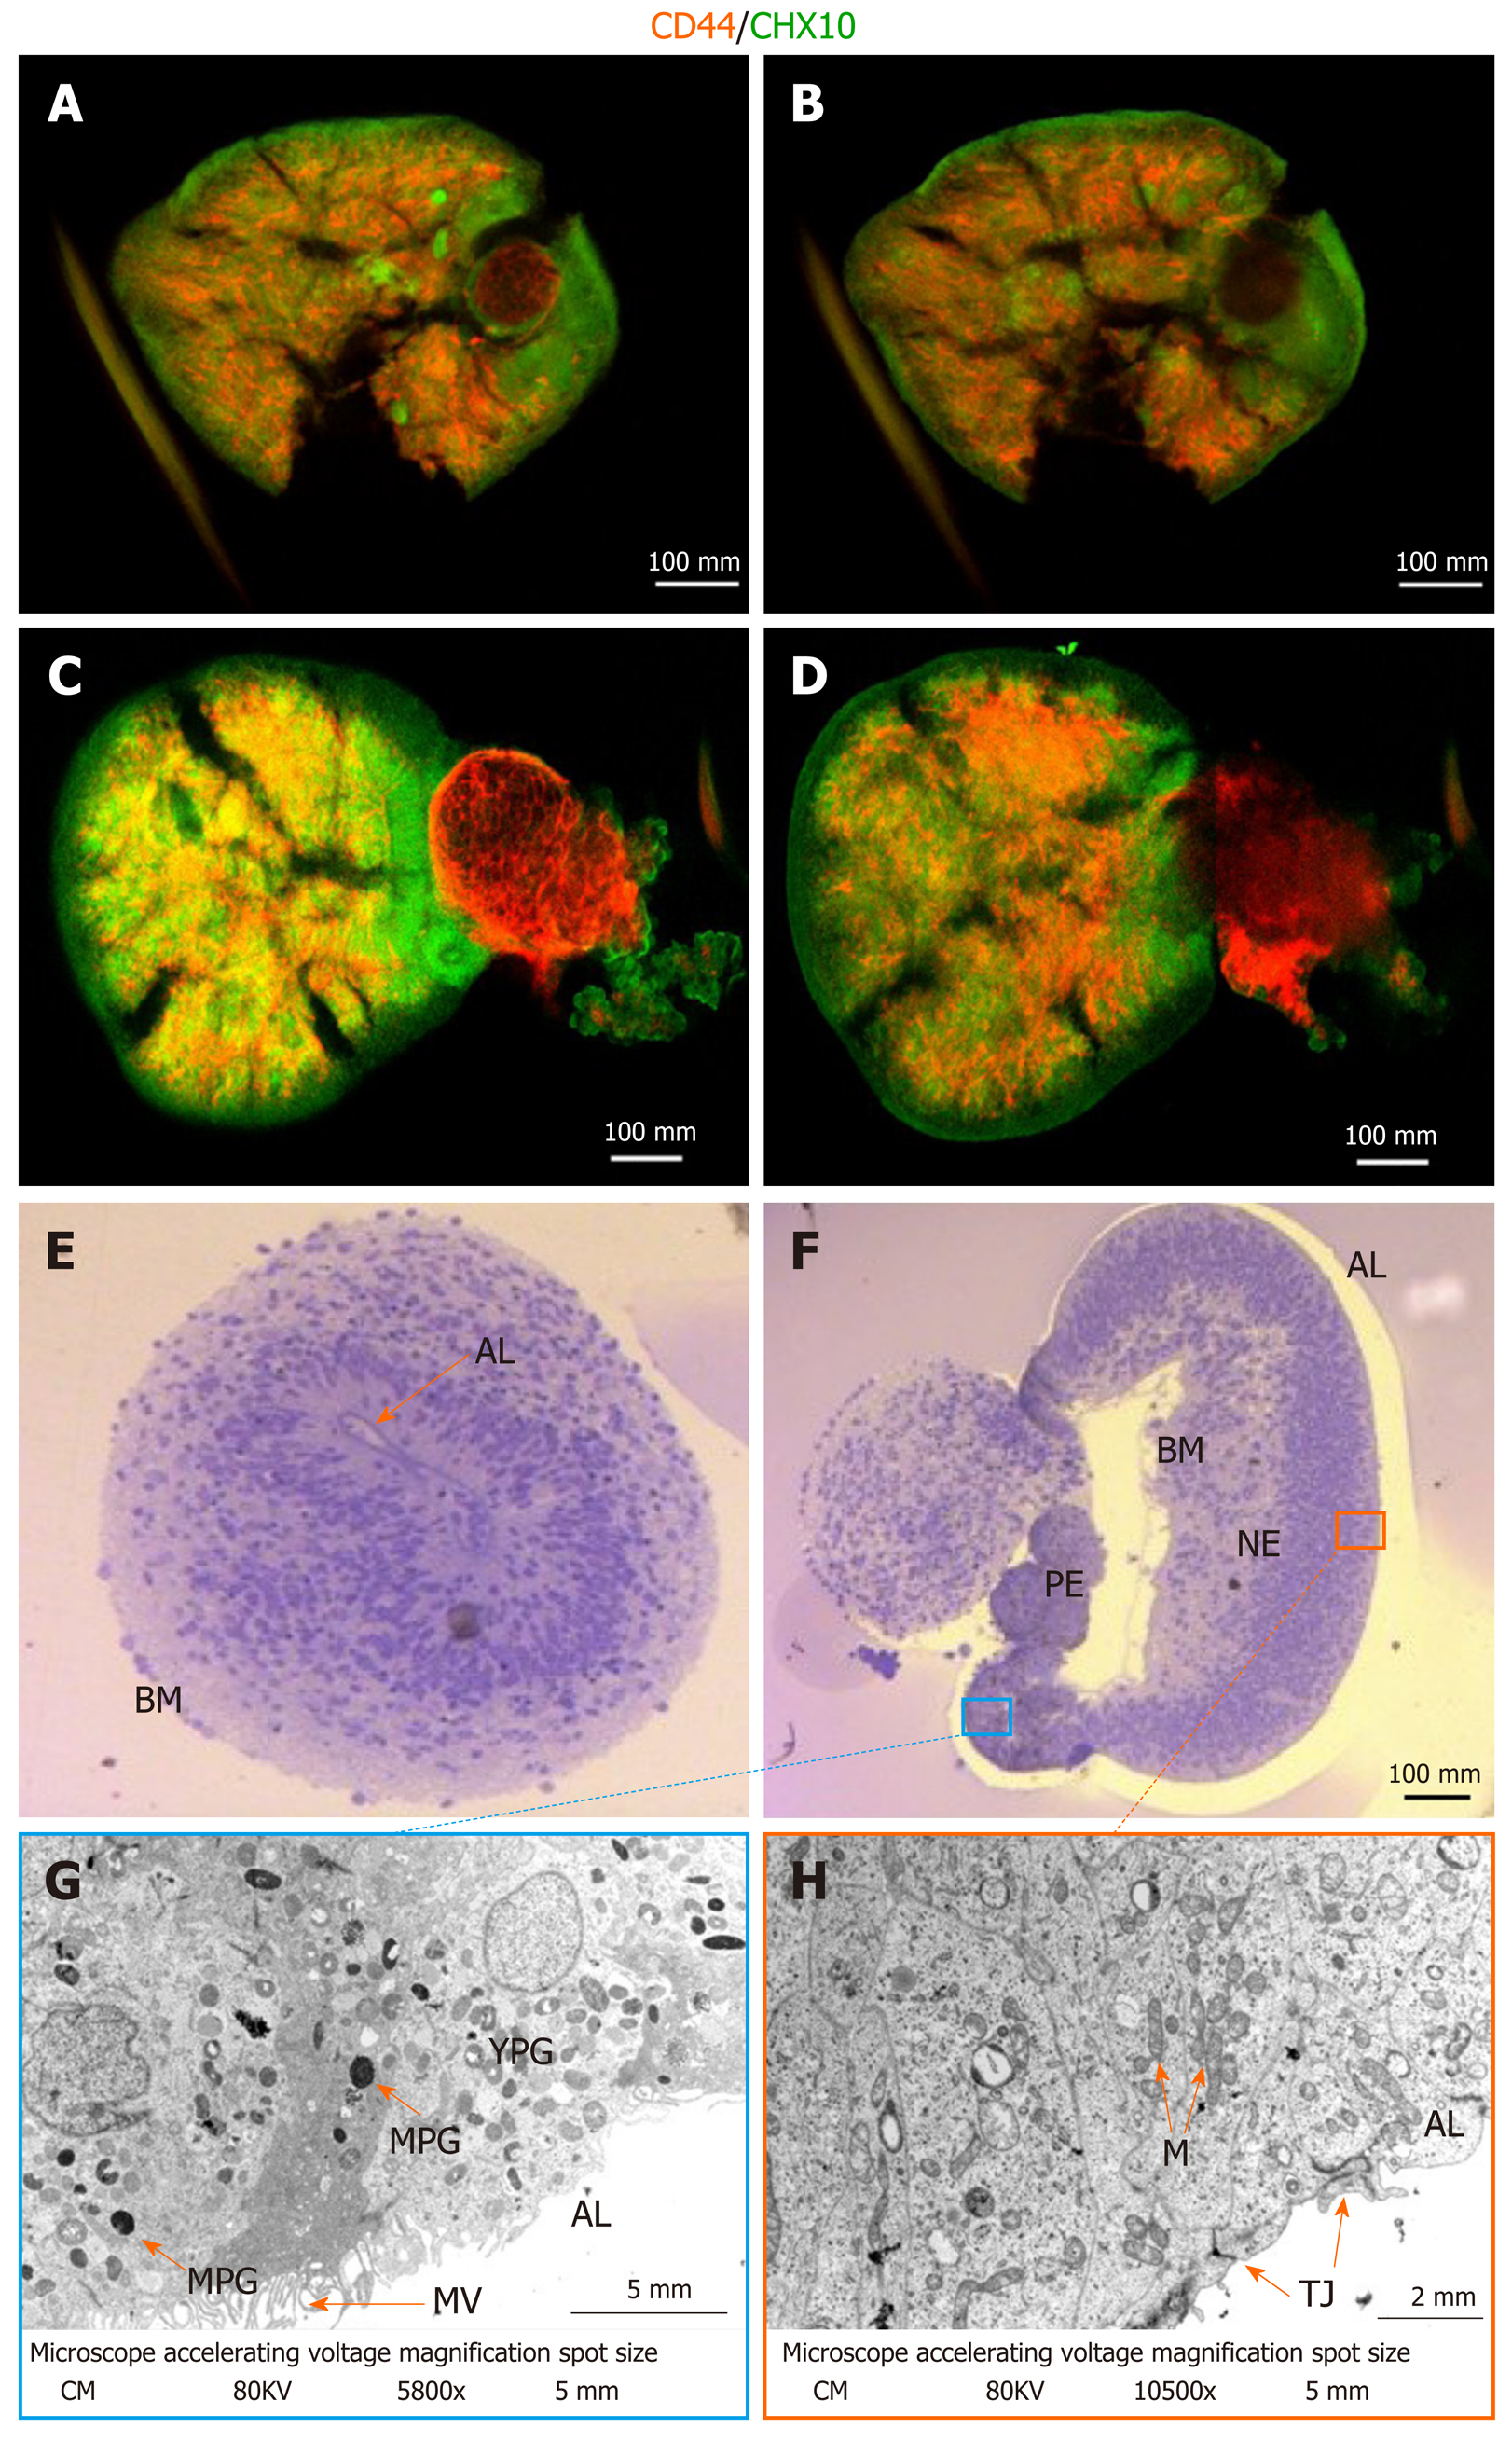
Figure 2 Assessment of maturity and cellular composition of day 56 retinal organoids.
A: Retinal organoids (RGs) after ethyl cinnamate clearing following whole-mount ICC for CHX10 (green) and CD44 (red) showing a more superficial layer of the structure; B: Proximal-most layer of OC seen in (A), clearly showing cells expressing CD44 and CHX10 in a non-overlapping but intercalated manner; C and D: Different RGs treated identically to (AB) showing similar distribution of retinal ganglion cells (RGCs) (CHX10-labelled) and Müller glia (CD44-labelled); E: Bright-field (BF) image of RG not showing invagination with the basal membrane (BM) outside. The apical layer (AL) is visible; F: BF image of invaginated RGs with BM inside (inverted). Visible are the retinal pigmented epithelium (RPE), retinal neural epithelium (RNE) and AL; G: Transmission electron microscopy (TEM) of the RPE. Visible are the AL with microvilli, mature pigmented granules and immature/young pigmented granules; H: TEM of the RNE with tight junctions at the AL and high density of mitochondria characteristic of neural tissues. Scale bar represents 100 mm as applies to A-F. Scale bar for G is 5 mm and 2 mm for H. AL: Apical layer; BM: Basal membrane; M: Mitochondria; MPG: Mature pigmented granules; MV: Microvilli; NE: Neural epithelium; TJ: Tight junctions.
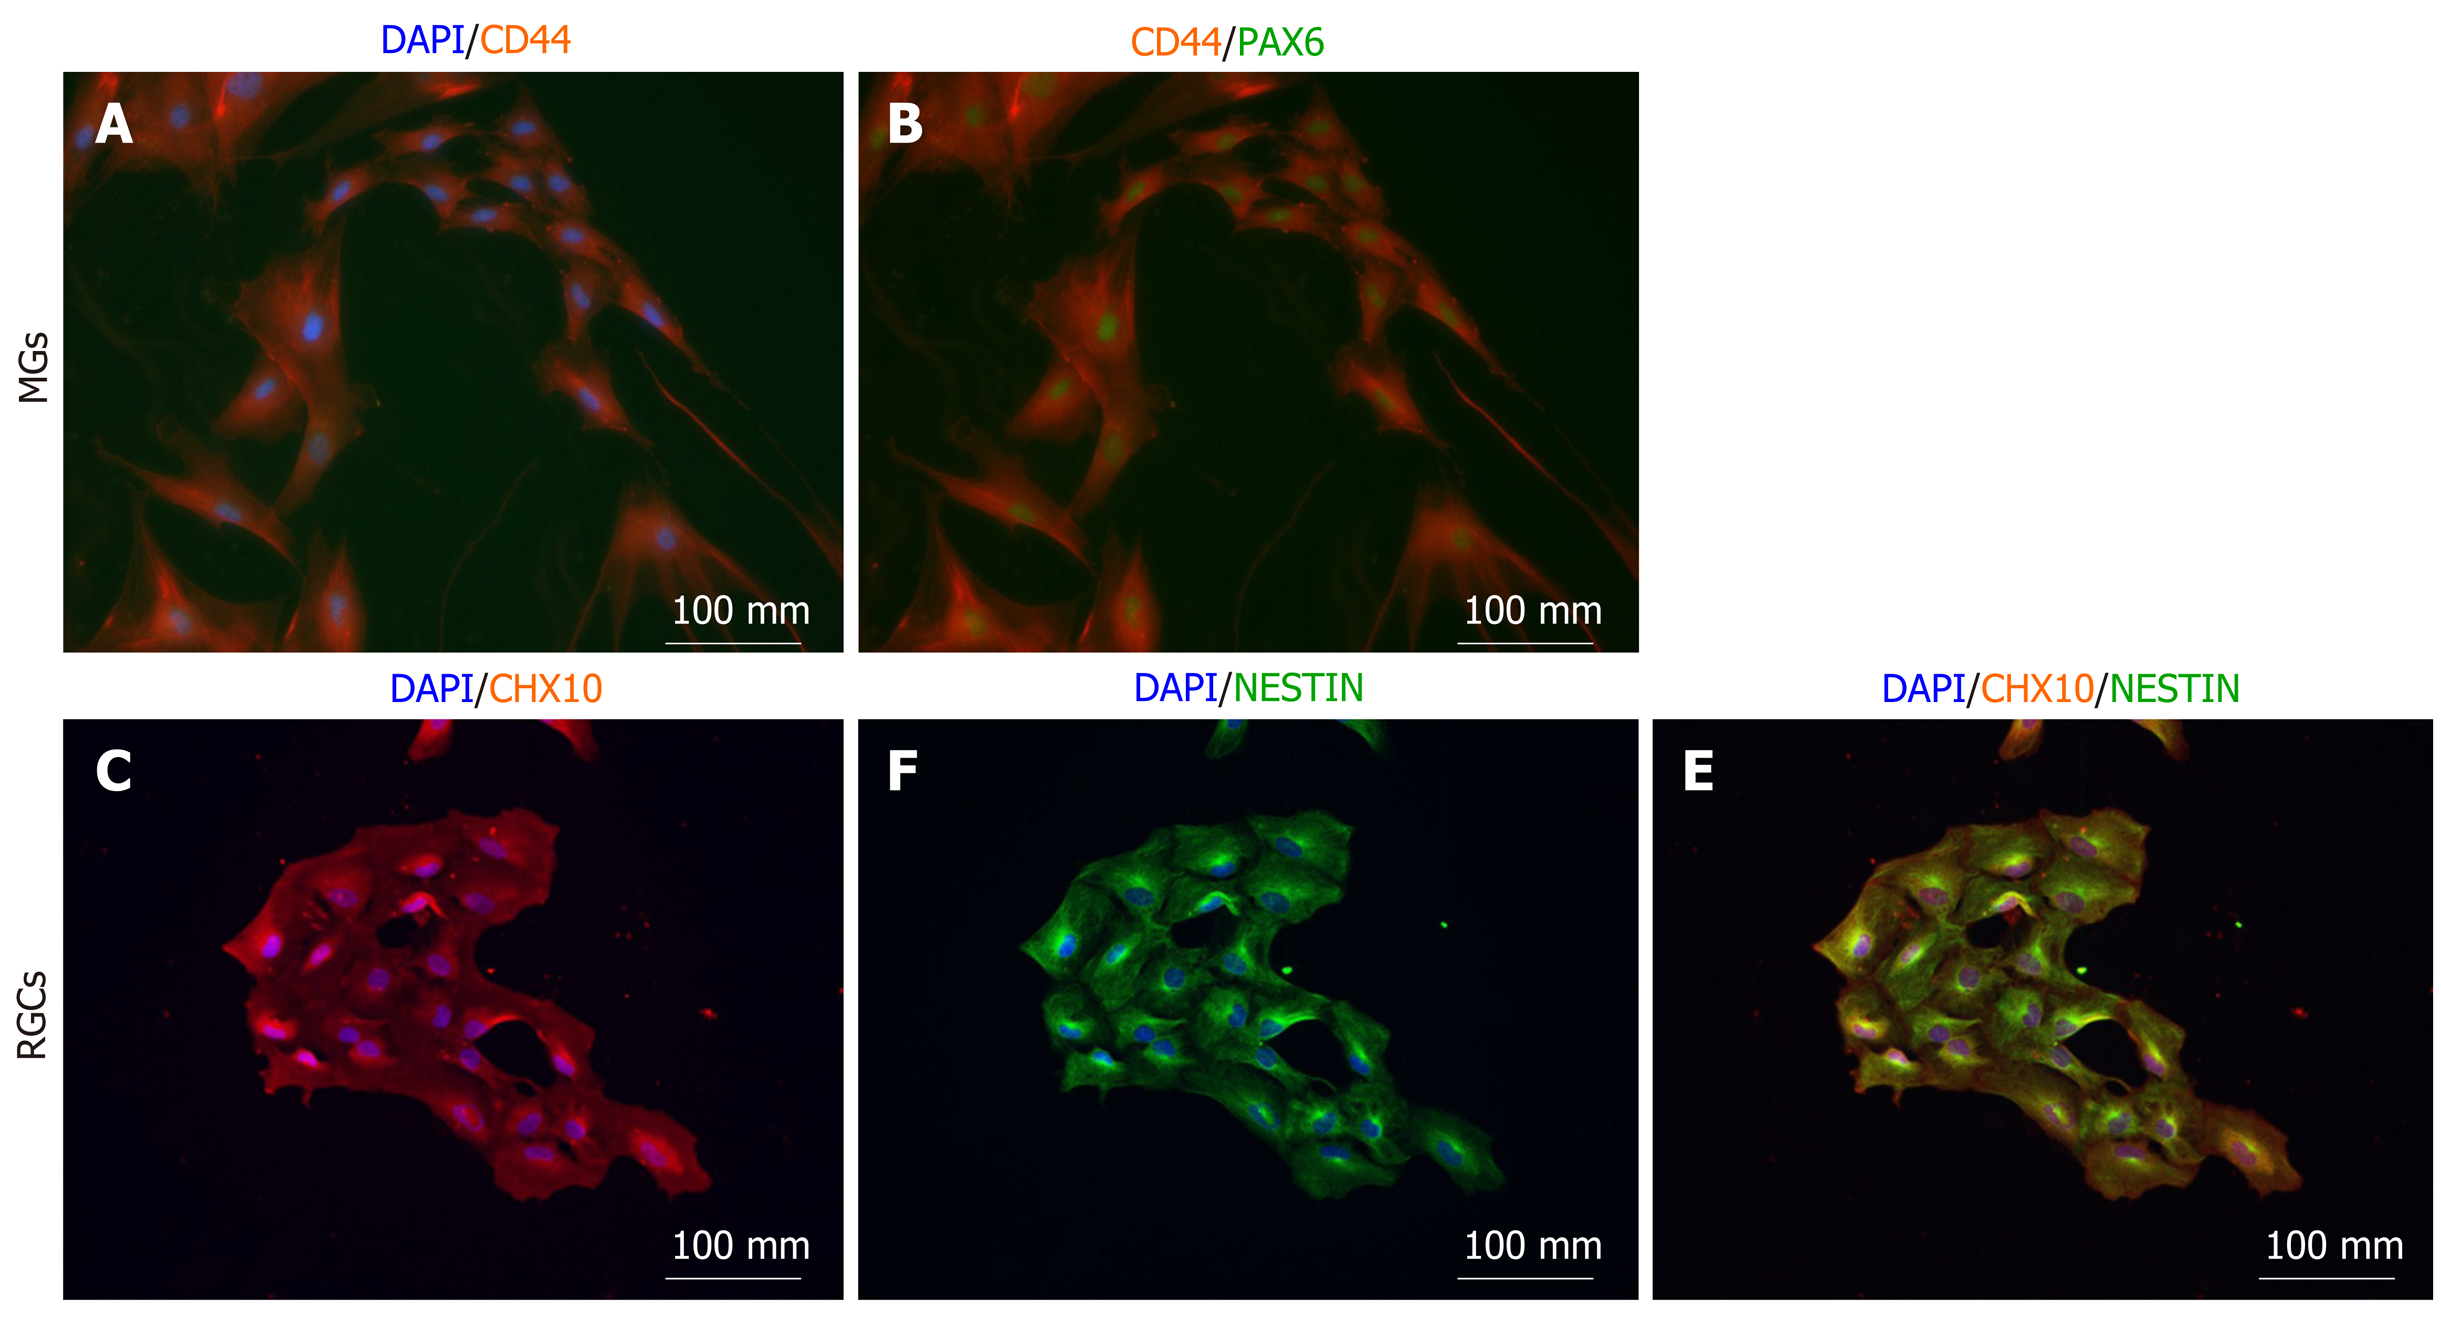
Figure 3 Magnetic-associated cell sorting-isolated Müller glia and retinal ganglion cells in 2D culture.
A: Isolated Müller glia progenitors (MGs) are positive for CD44; B: Isolated MGs are co-positive for CD44 and PAX6; C: Isolated retinal ganglion cell progenitors are positive for CHX10; D: NESTIN and consistently co-positive for NESTIN and CHX10; E: Scale bar represents 100 mm.
-
Citation: Freude KK, Saruhanian S, McCauley A, Paterson C, Odette M, Oostenink A, Hyttel P, Gillies M, Haukedal H, Kolko M. Enrichment of retinal ganglion and Müller glia progenitors from retinal organoids derived from human induced pluripotent stem
cells - possibilities and current limitations. World J Stem Cells 2020; 12(10): 1171-1183 - URL: https://www.wjgnet.com/1948-0210/full/v12/i10/1171.htm
- DOI: https://dx.doi.org/10.4252/wjsc.v12.i10.1171


