Copyright
©The Author(s) 2019.
World J Stem Cells. Sep 26, 2019; 11(9): 705-721
Published online Sep 26, 2019. doi: 10.4252/wjsc.v11.i9.705
Published online Sep 26, 2019. doi: 10.4252/wjsc.v11.i9.705
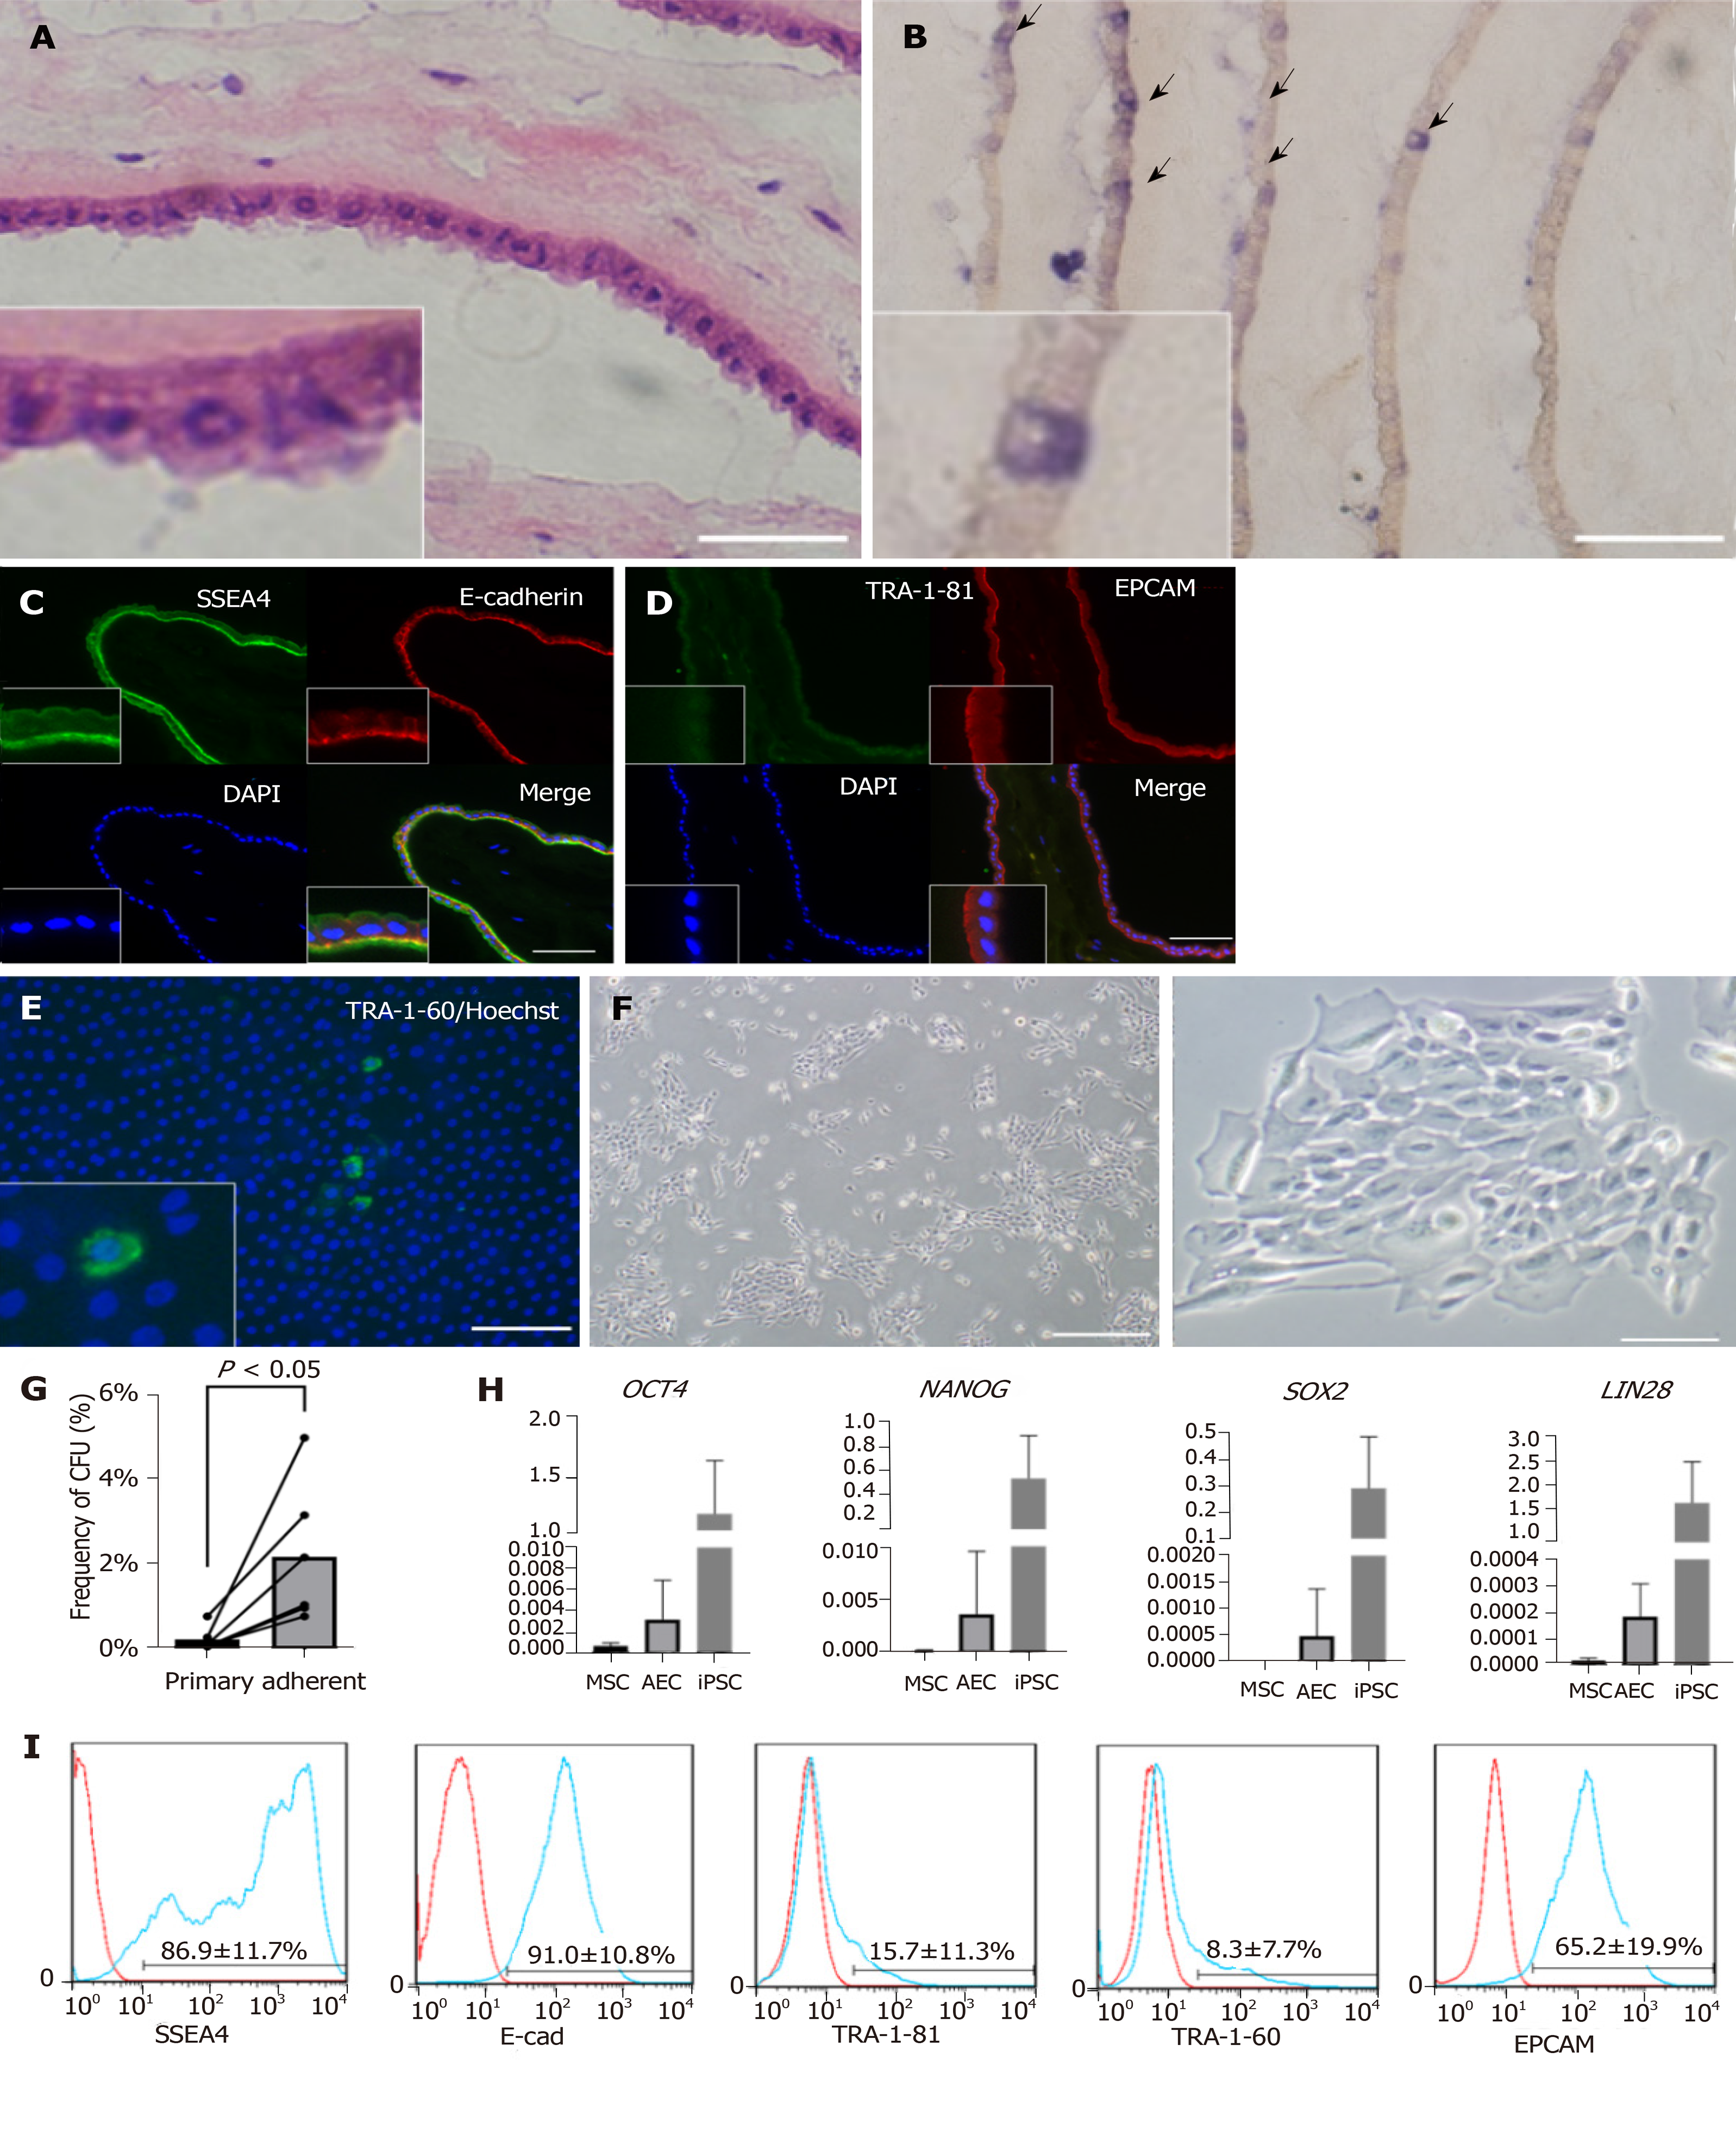
Figure 1 Characteristics of human amniotic membrane and amniotic epithelial cells.
A: H and E staining of amniotic membrane. Bar, 50 µm; B: AP staining of amniotic membrane. Positive cells are indicated with arrows. Bar, 100 µm. In A and B, the amniotic membrane was rolled before embedding. Therefore, many layers can be seen in one picture; C: Immunofluorescent staining of frozen section of amniotic membrane. Anti-SSEA4 antibody (green), E-cadherin antibody (red), and DAPI were used; D: Same as C. Anti-TRA-1-81 antibody (green), anti-EPCAM antibody (red), and DAPI were used; E: Direct tissue staining of amniotic membrane. Anti-TRA-1-60 antibody (green) and DAPI were used. Bars in C, D, and E represent 100 µm; F: Colonies formed from cultured amniotic epithelial cells (AECs) and observed by phase-contrast microscopy. Bar to left of F represents 200 µm. Bar to right of F represents 500 µm; G: Frequency of colony formation from primary AECs and adherent AECs. Cells which did not attach to the well surface were removed to purify the amniotic stem cells; H: Gene expression of primary AECs, mesenchymal stem cells(MSCs), and induced pluripotent stem cells(iPSCs) detected by qRT-PCR; I: surface markers of primary AECs verified by flow cytometry.
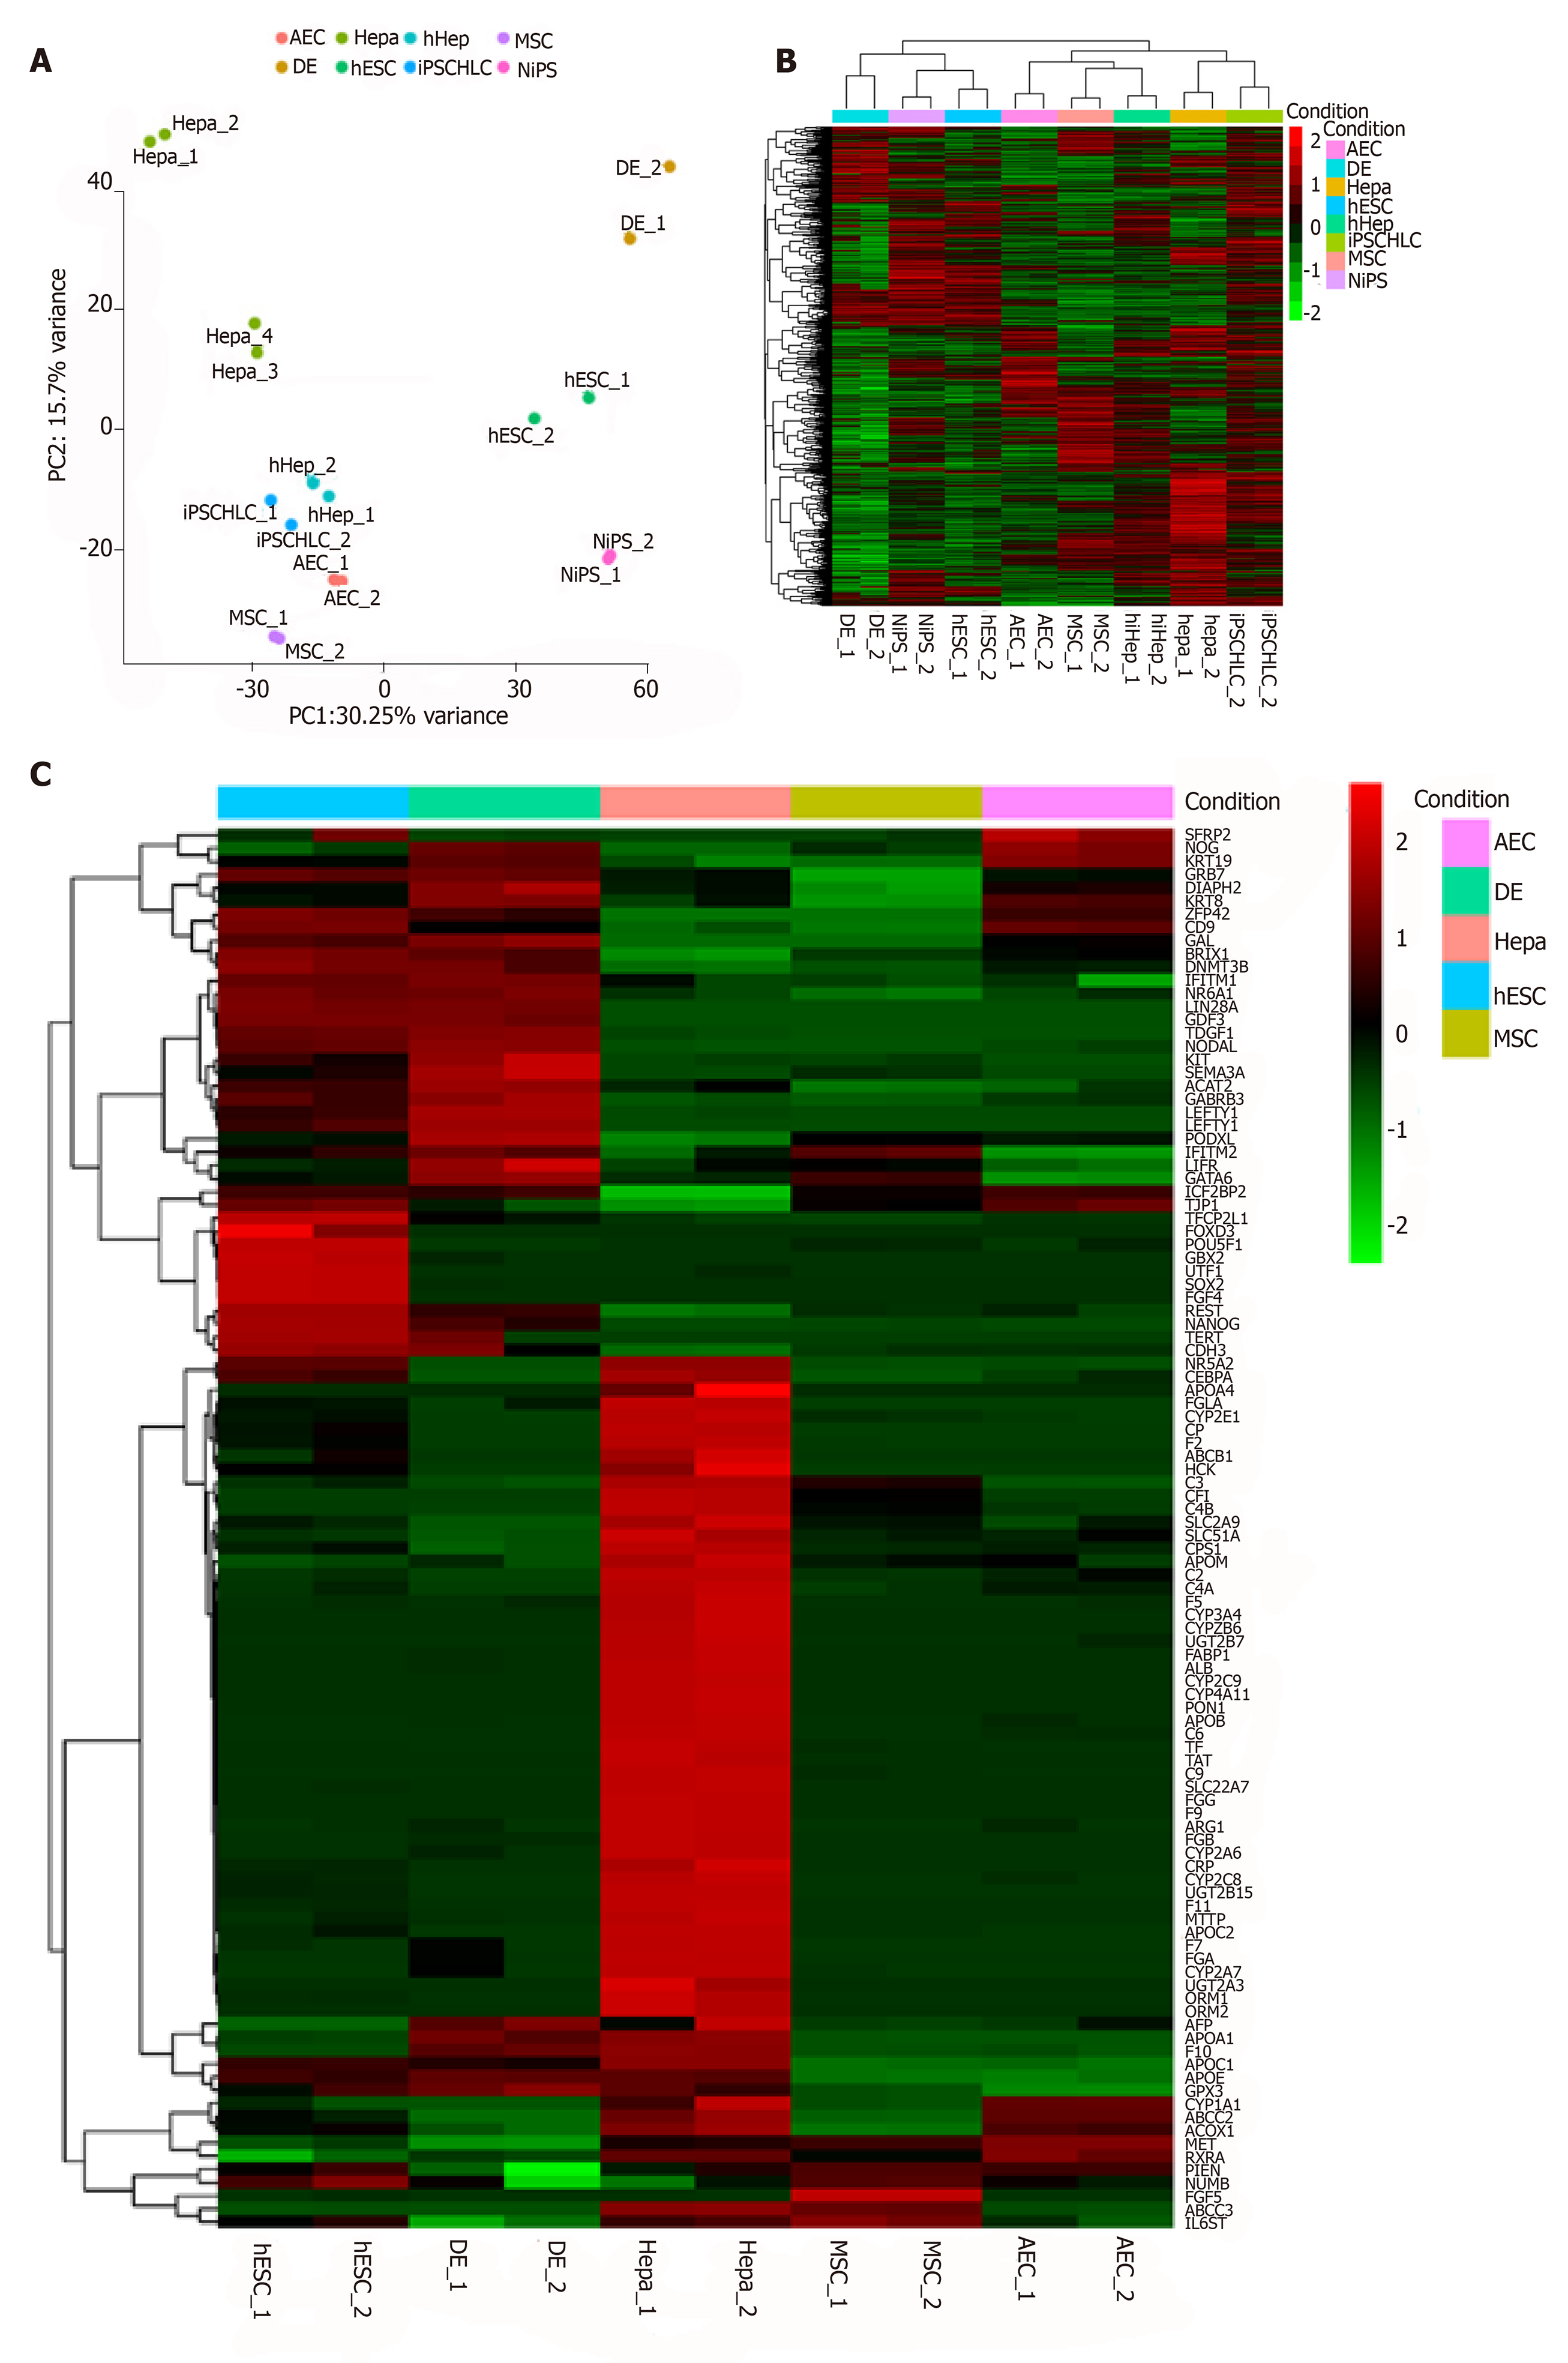
Figure 2 Characteristics of primary amniotic epithelial cells and other cell sources verified by bioinformatics.
A: Principal component analysis of all cell sources used in this assay; B: General heatmap for each cell source; C: Specific heatmap of stemness and hepatic markers. AEC: Amniotic epithelial cell; Hepa: Hepatocyte; hiHep: Human fibroblast-derived hepatocyte-like cell; MSC: Mesenchymal stem cell; DE: Definitive endoderm; hESC: Human embryonic stem cell; iPSCHLC, iPSC-derived hepatocyte-like cell; NiPS: Normal human iPSC.
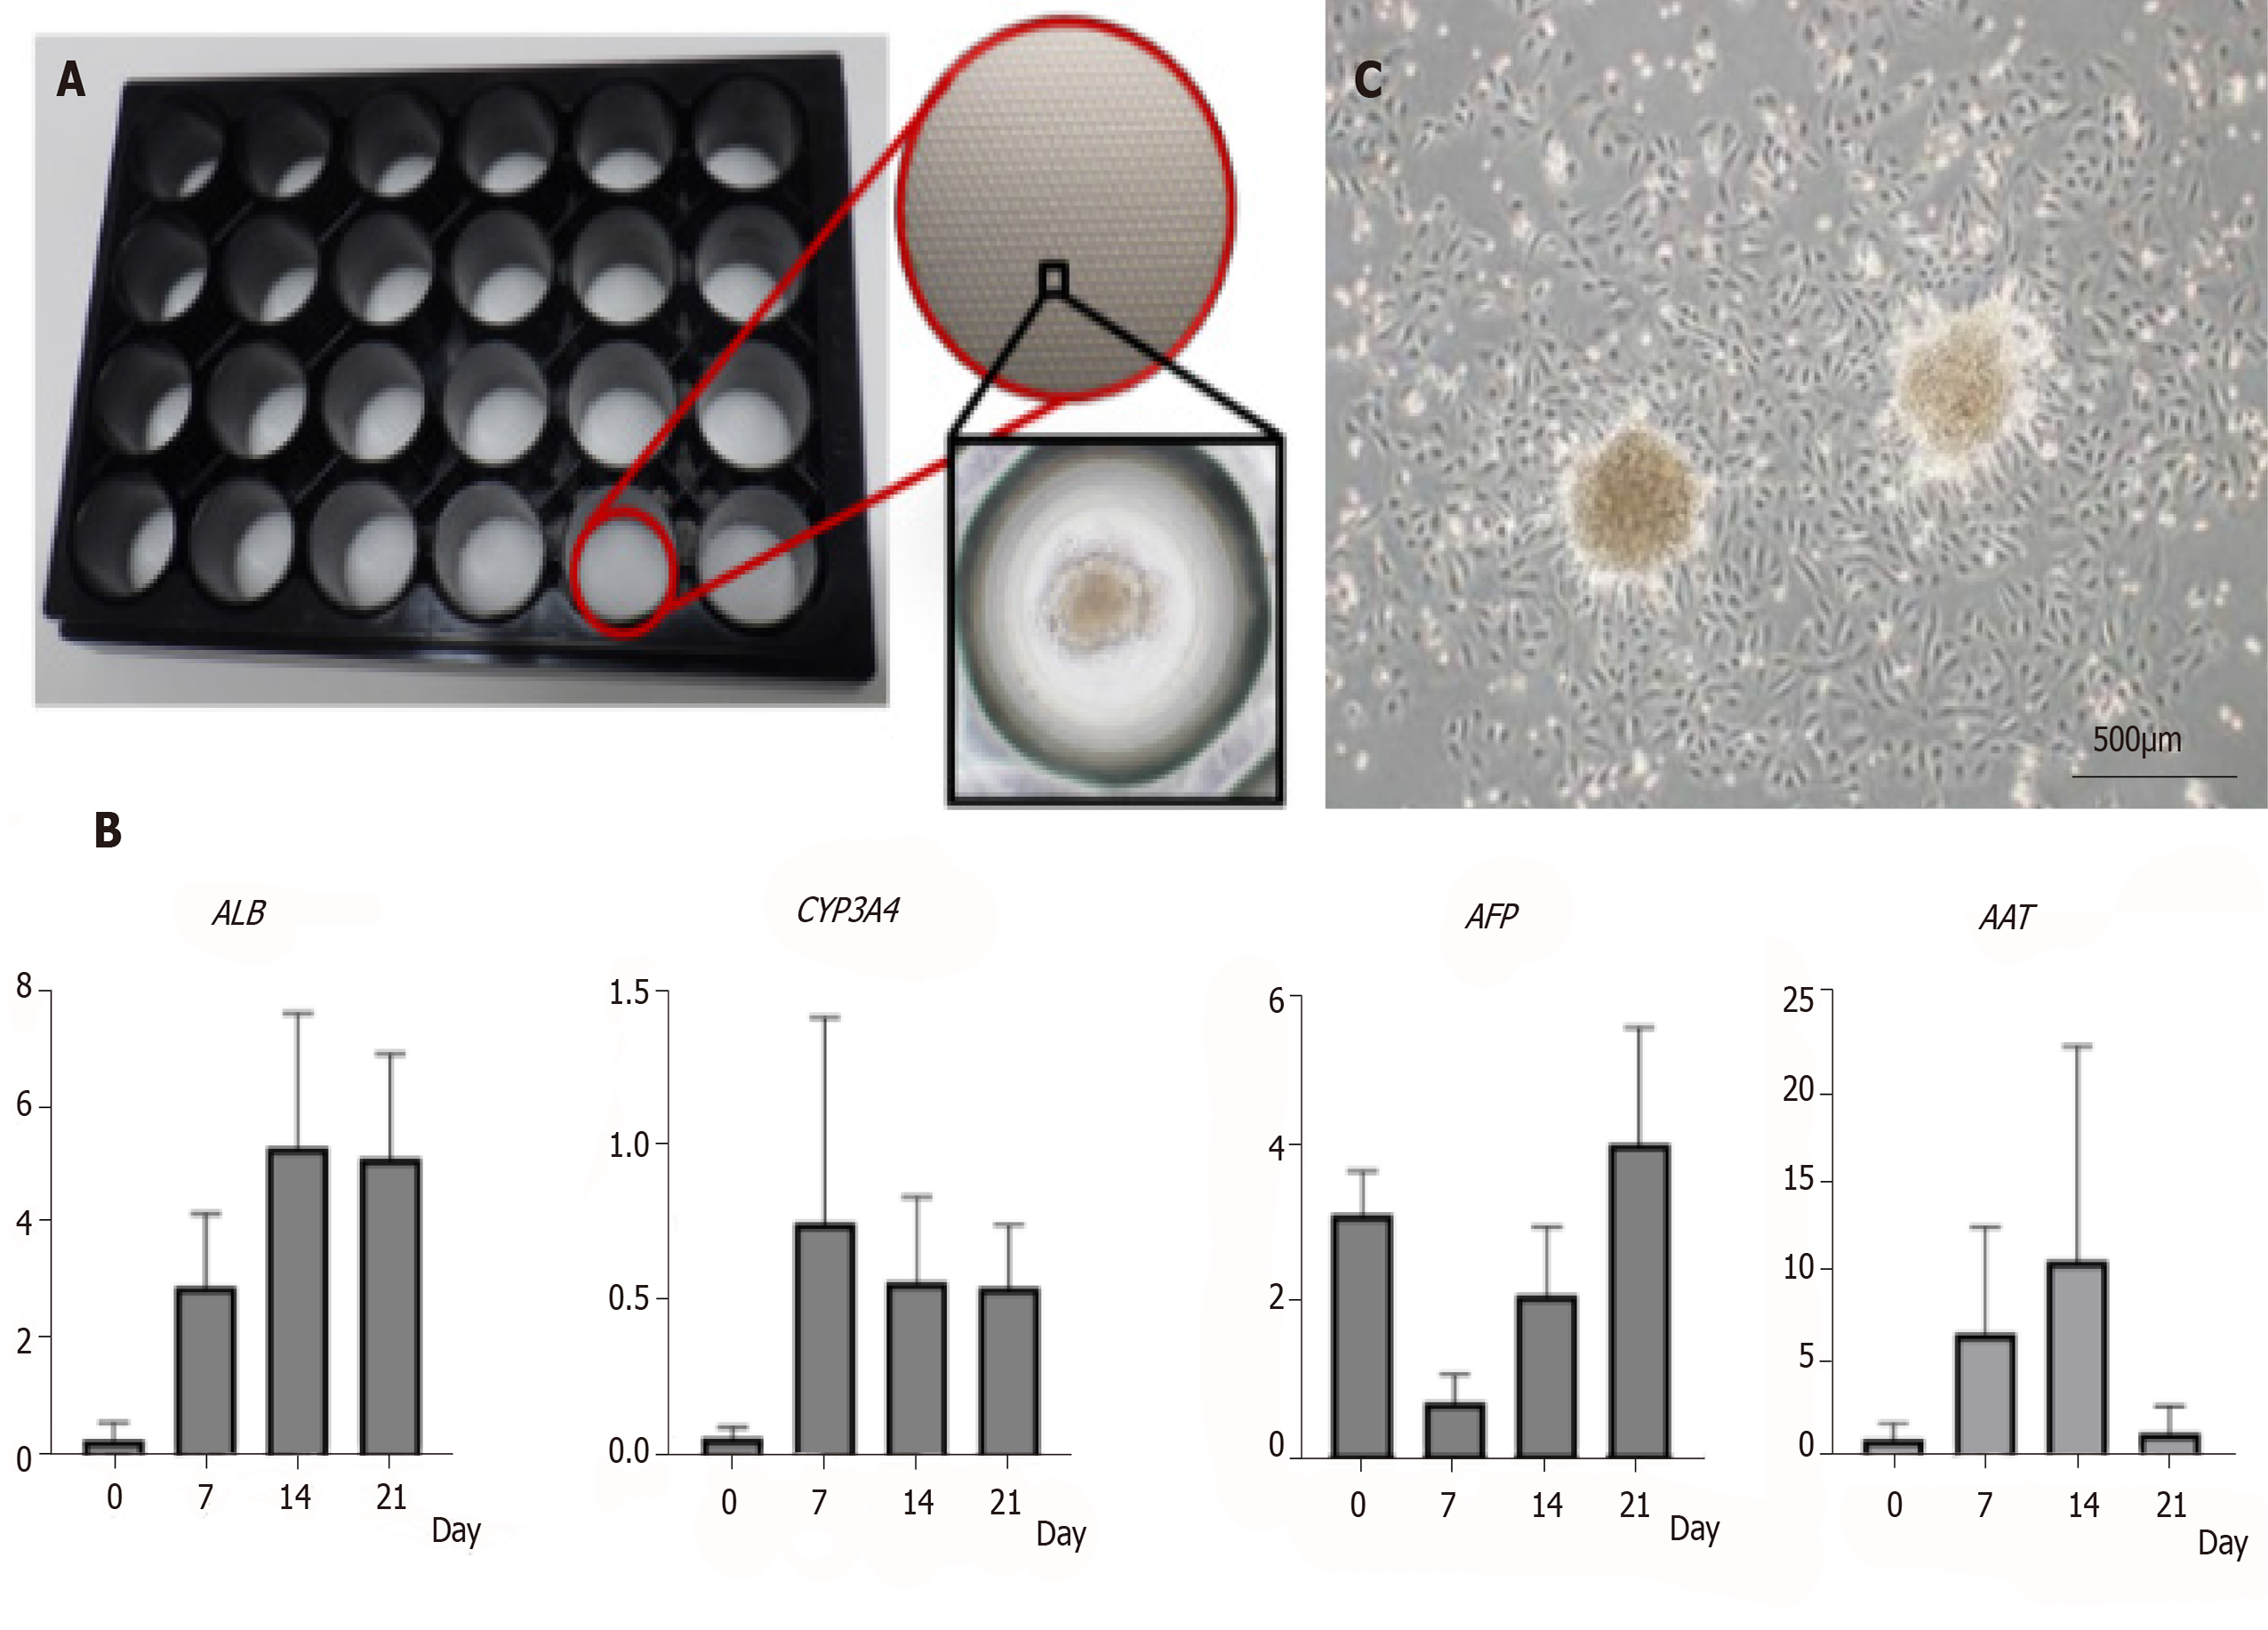
Figure 3 Characteristics of amniotic epithelial cell spheres formed on 3D-micropattern plate.
A: 3D-micropattern plate used in the present study. Round pits 500 µm in diameter are clustered on the surface. After culture, the amniotic epithelial cells (AECs) formed a sphere; B: Gene expression in the AEC sphere verified by qRT-PCR; C: After reseeding AEC sphere onto 2D culture dish, AEC proliferation was verified by phase-contrast microscopy. Bar, 500 µm.
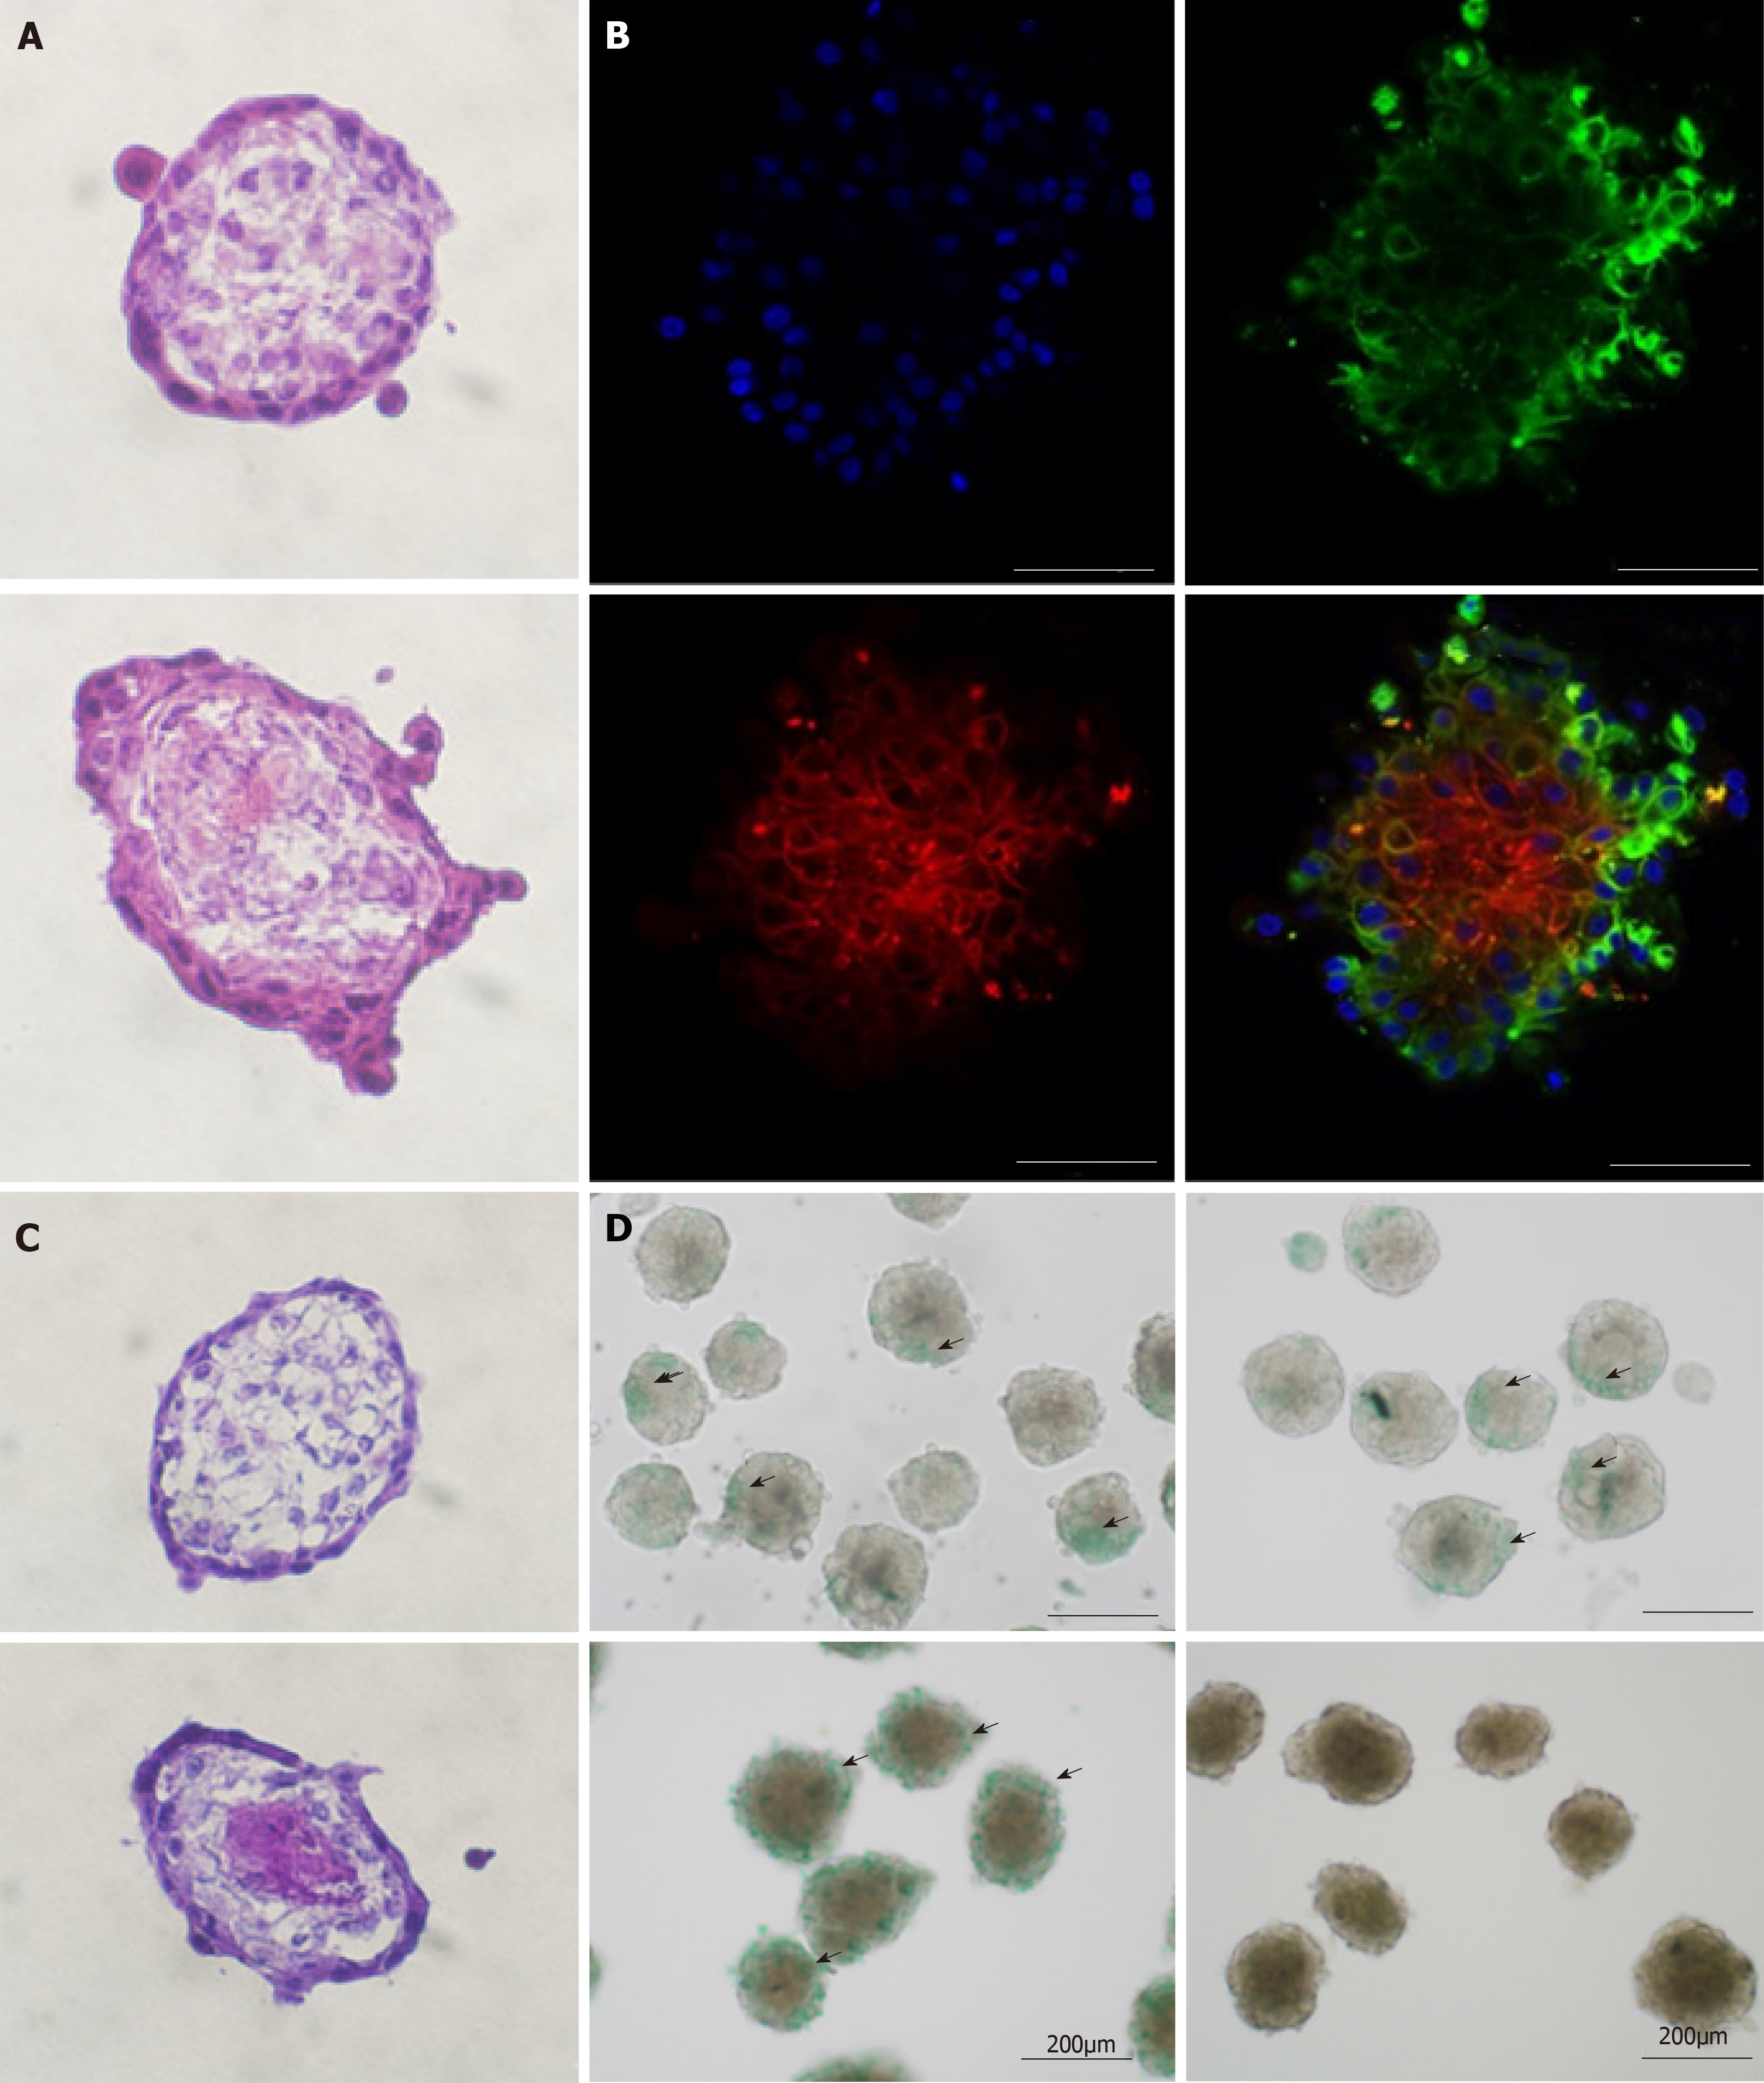
Figure 4 Organoid morphology and hepatic function.
A and C: Frozen sections of amniotic epithelial cell (AEC) sphere and organoid. The AEC sphere was placed in the upper layer and the organoid was placed in the lower layer. H&E staining is used in A, and Periodic acid Schiff staining is used in C; B: Immunofluorescent organoid staining observed under confocal microscopy. Anti-SSEA4 antibody (green) representing AECs; anti-CD90 antibody (red) representing mesenchymal stem cells and DAPI. Bars in A, B, and C, 50 µm; D: ICG tests on AEC sphere and organoid. The AEC sphere was placed in the upper layer and the organoid was placed in the lower layer.
- Citation: Furuya K, Zheng YW, Sako D, Iwasaki K, Zheng DX, Ge JY, Liu LP, Furuta T, Akimoto K, Yagi H, Hamada H, Isoda H, Oda T, Ohkohchi N. Enhanced hepatic differentiation in the subpopulation of human amniotic stem cells under 3D multicellular microenvironment. World J Stem Cells 2019; 11(9): 705-721
- URL: https://www.wjgnet.com/1948-0210/full/v11/i9/705.htm
- DOI: https://dx.doi.org/10.4252/wjsc.v11.i9.705


