Copyright
©The Author(s) 2019.
World J Stem Cells. Jun 26, 2019; 11(6): 347-374
Published online Jun 26, 2019. doi: 10.4252/wjsc.v11.i6.347
Published online Jun 26, 2019. doi: 10.4252/wjsc.v11.i6.347
Figure 1 Immunofluorescence and flow cytometry analysis of mesenchymal stem cells in P0, isolated from bone marrow, adipose tissue, skeletal muscle and dermis.
Isolated adherent cells express naïve MSC markers CD73, CD90, and CD105, proangiogenic markers CD146 and PDGFRα, and PW1 stem cell marker specific for MSCs derived from solid tissues. The subpopulation of MSCs co-expresses CD73/CD146 antigens. BM-MSC: Bone marrow - mesenchymal stem cell; AT-MSC: Adipose tissue - mesenchymal stem cell; SK-MSC: Skin - mesenchymal stem cell; SM-MSC: Skeletal muscle - mesenchymal stem cell.
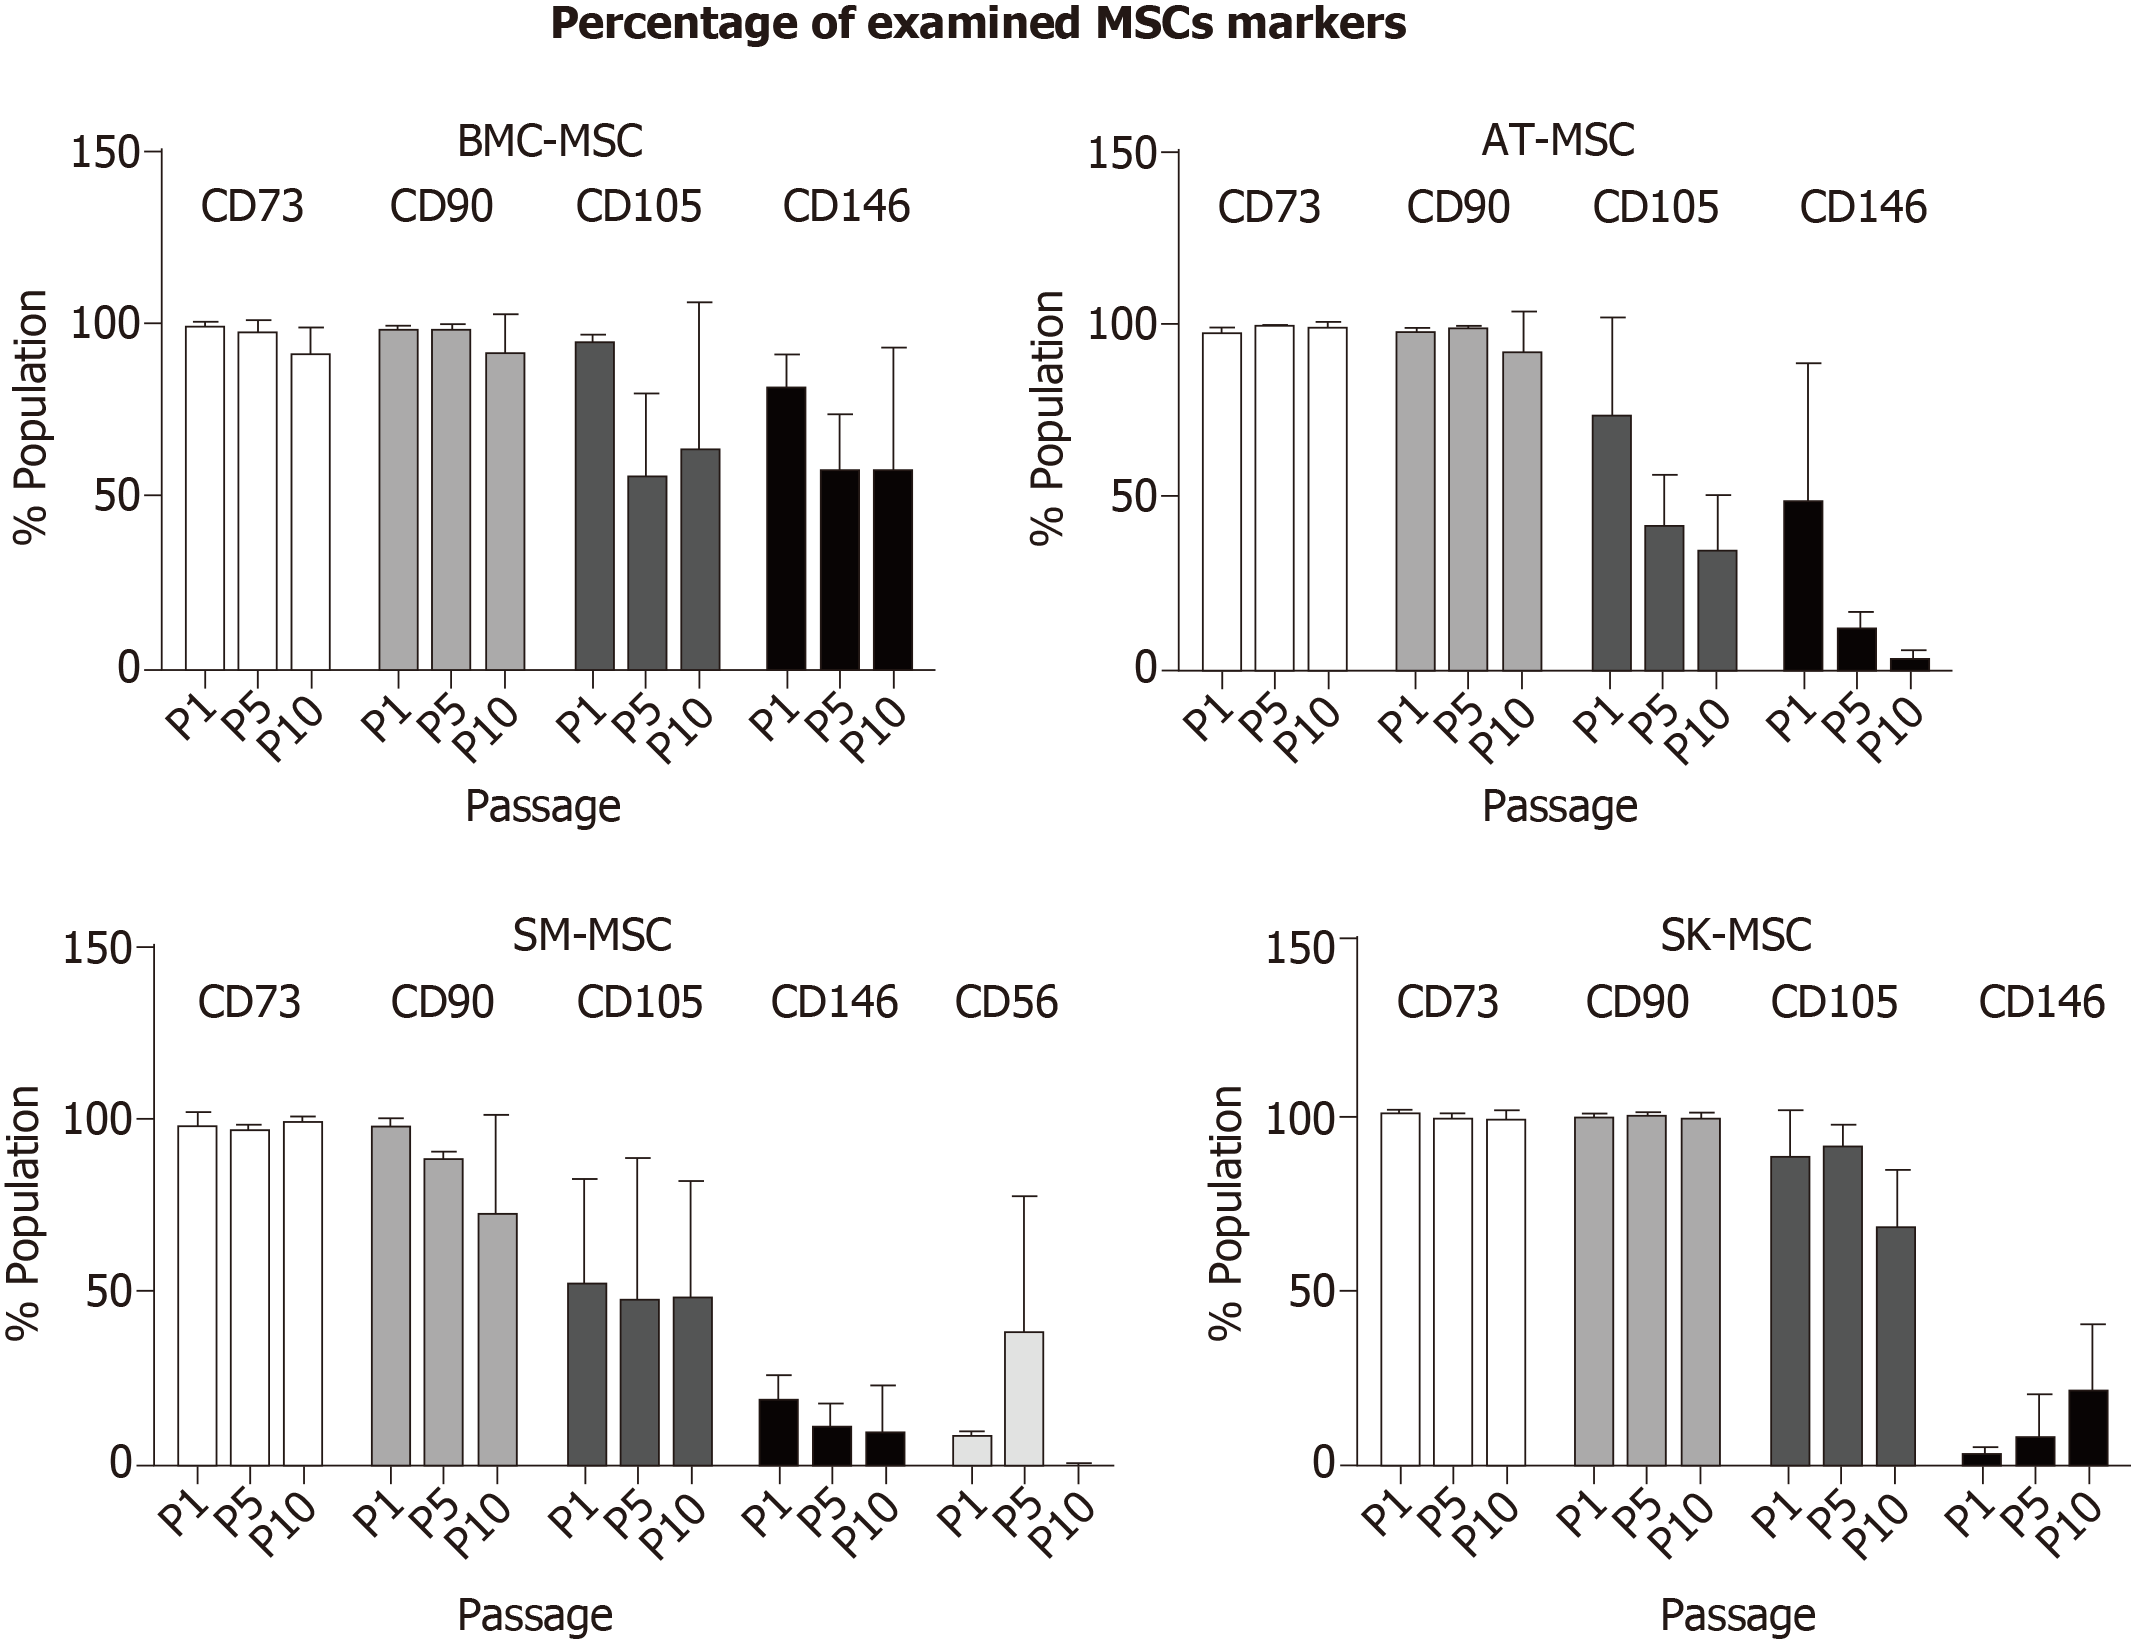
Figure 2 Percentage of mesenchymal stem cells population positive for CD73, CD90, CD105, and CD146 in bone marrow - mesenchymal stem cells, adipose tissue - mesenchymal stem cells, and skin - mesenchymal stem cells, and CD56 only in skeletal muscle - mesenchymal stem cells.
Mesenchymal stem cells (MSCs) isolated from all examined tissues maintained the naïve MSC phenotype CD73, CD90, and CD105 during the follow-up period. A higher level of CD146 was observed in P1 in BM-MSCs, AT-MSCs, and SM-MSCs, but declined in the subsequent passages. In contrast, SK-MSC P1 was characterized with a low number of CD146+ cells; their level increased in P9. CD56 positive cells were present only in SM-MSCs, and the highest level was observed in P5. BM-MSC: Bone marrow - mesenchymal stem cell; AT-MSC: Adipose tissue - mesenchymal stem cell; SK-MSC: Skin - mesenchymal stem cell; SM-MSC: Skeletal muscle - mesenchymal stem cell.
Figure 3 Fluorescence intensity positive for MSC markers CD73 (APC), CD90 (FITC), CD105 (PE), and CD146 (PE) in bone marrow - mesenchymal stem cells, adipose tissue - mesenchymal stem cells, and skin - mesenchymal stem cells, and CD56 (PE) only in skeletal muscle - mesenchymal stem cells.
Heterogeneous population isolated from skeletal muscles showed the strongest instability of naïve MSC markers. Expression of CD73 and CD90 was preserved among the MSCs isolated from other tissues (BM, AT, and SK); however, fluorescence intensity decreased in AT-MSCs and SK-MSCs in the later passages. Expression of the CD105 marker was the most varied during the follow-up period. Fluorescence intensity of the proangiogenic marker CD146 was the strongest in BM-MSCs and AT-MSCs in the early passages. BM-MSC: Bone marrow - mesenchymal stem cell; AT-MSC: Adipose tissue - mesenchymal stem cell; SK-MSC: Skin - mesenchymal stem cell; SM-MSC: Skeletal muscle - mesenchymal stem cell.
Figure 4 Osteogenic, adipogenic, and chondrogenic potential of bone marrow - mesenchymal stem cells, adipose tissue - mesenchymal stem cells, skeletal muscle - mesenchymal stem cells and skin - mesenchymal stem cells, examined from P1 to P9–10.
Improvement of the osteogenic potential and downregulation of adipogenic abilities with the number of passages was observed in BM-, AT- and SK-MSCs. Only SM-MSCs were unable to differentiate into adipocytes. BM-MSC: Bone marrow - mesenchymal stem cell; AT-MSC: Adipose tissue - mesenchymal stem cell; SK-MSC: Skin - mesenchymal stem cell; SM-MSC: Skeletal muscle - mesenchymal stem cell.
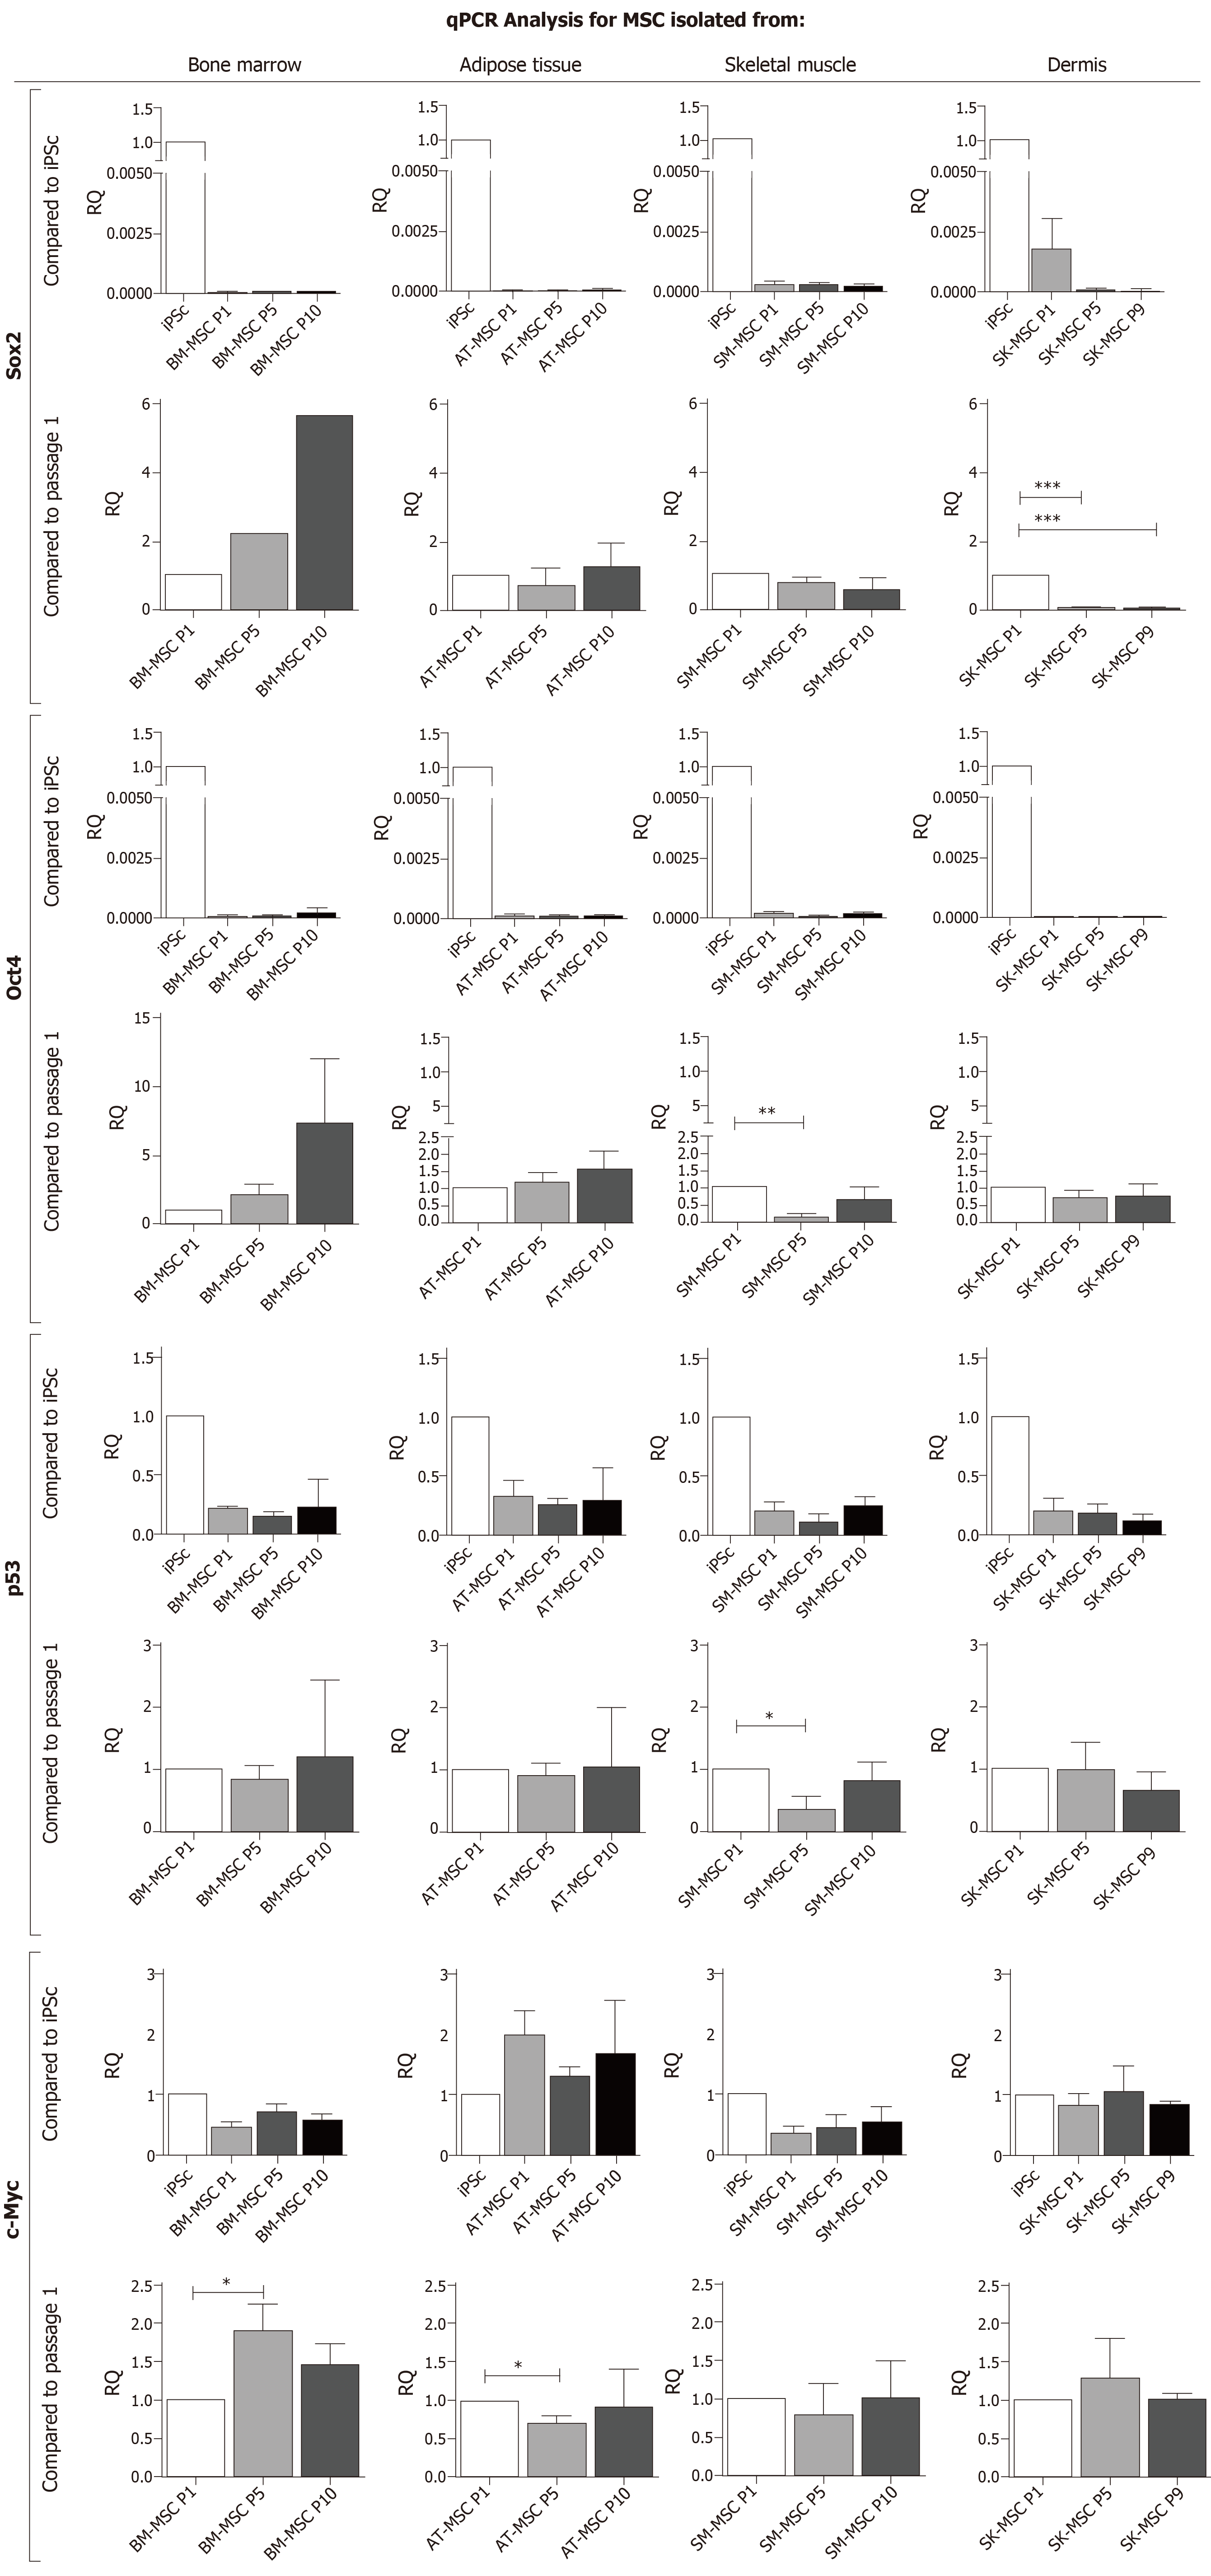
Figure 5 qPCR analysis for pluripotency and the genetic stability of mesenchymal stem cell.
mRNA for Sox2 and Oct4 characterizes the pluripotency of MSCs, tumor suppressor gene p53, and proto-oncogenes c-Myc expression for the genetic stability of BM-MSCs, AT-MSCs, SM-derived stem/progenitor cells (SM-MSCs) and SK-MSCs as compared to iPSC control and to an early passage, P1. (*P < 0.05, **P < 0.005, ***P < 0.0001). BM-MSC: Bone marrow - mesenchymal stem cell; AT-MSC: Adipose tissue - mesenchymal stem cell; SK-MSC: Skin - mesenchymal stem cell; SM-MSC: Skeletal muscle - mesenchymal stem cell.
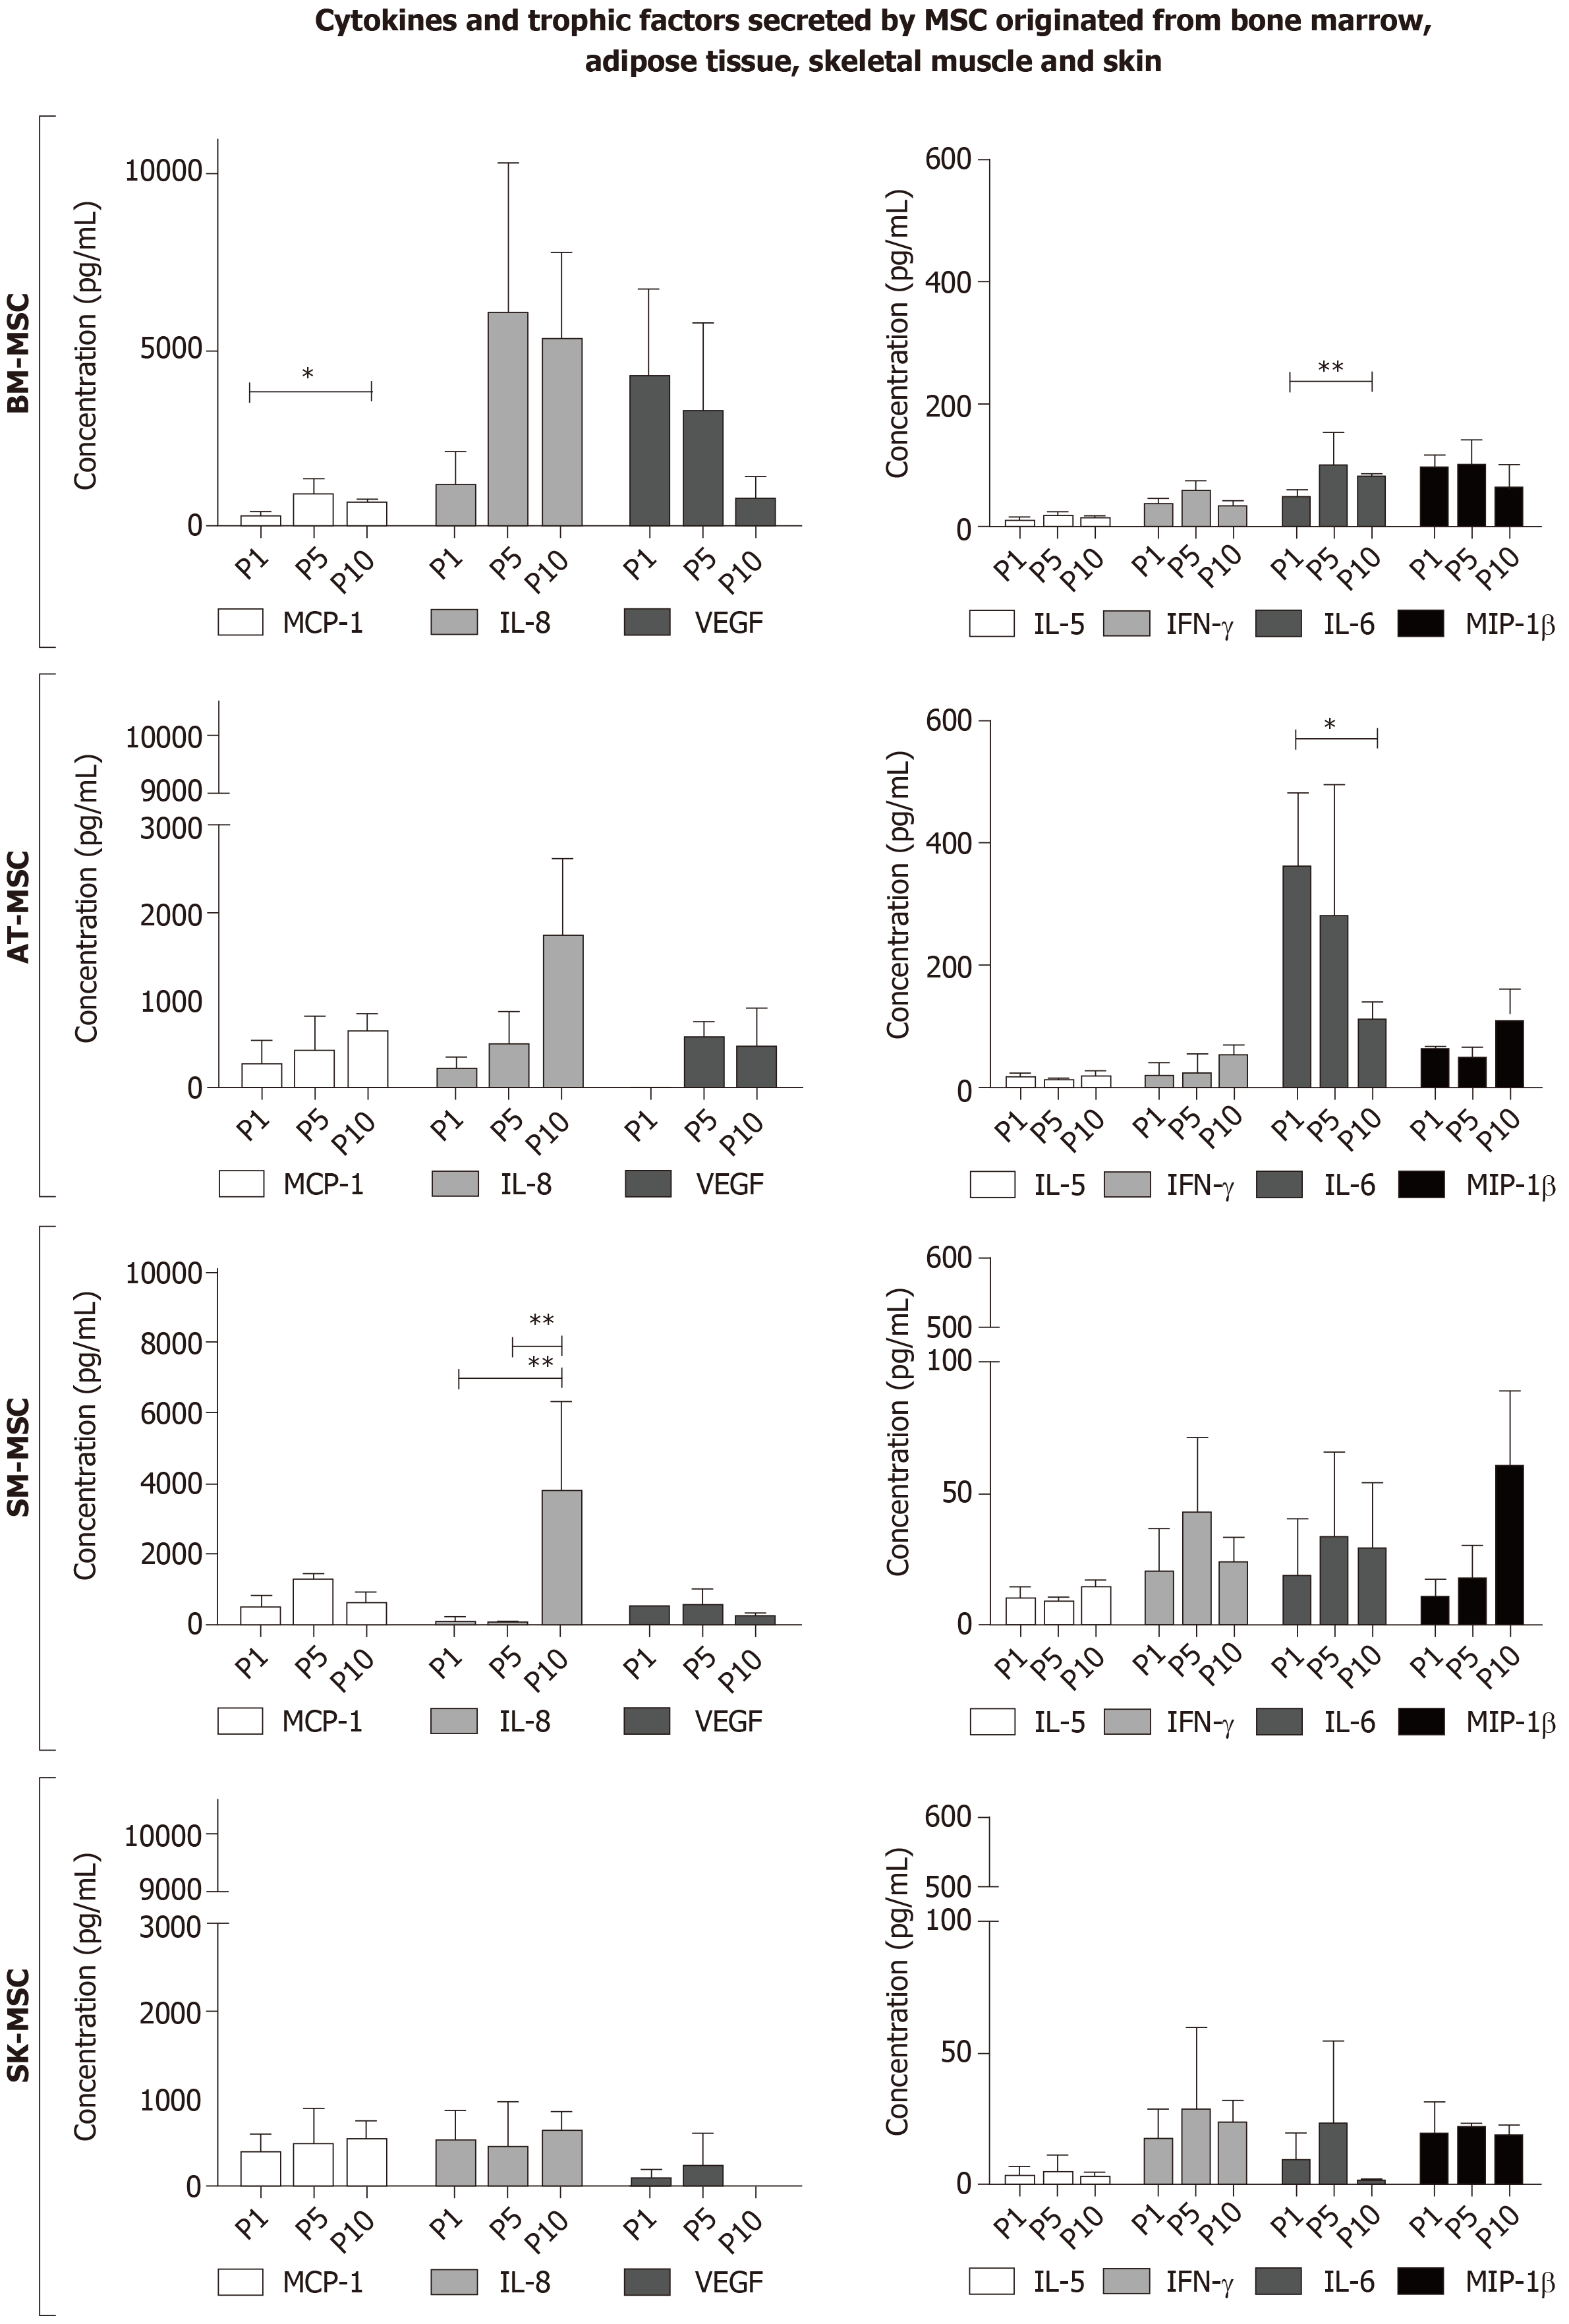
Figure 6 Cytokine and trophic factor expression through Multiplex ELISA analysis in supernatants after cell culture of bone marrow - mesenchymal stem cells, adipose tissue - mesenchymal stem cells, skeletal muscle - mesenchymal stem cells and skin - mesenchymal stem cells.
MCP-1 was detected in all supernatants; however, statistical significance was only proven in BM-MSCs and SM-MSCs. The highest concentration of IL-6 was observed in supernatants after AT-MSC culture. In the supernatants of all examined MSCs, a low concentration of IL-5 and IFN-γ was observed. The highest concentrations of VEGF and IL-8 were observed in supernatants from the BM-MSC culture; however, smaller amounts of VEGF and IL-8 were also detected in the later passages in AT-MSCs and SM-MSCs. (*P < 0.05, **P < 0.001). BM-MSC: Bone marrow - mesenchymal stem cell; AT-MSC: Adipose tissue - mesenchymal stem cell; SK-MSC: Skin - mesenchymal stem cell; SM-MSC: Skeletal muscle - mesenchymal stem cell.
Figure 7 Co-culture and spontaneous fusion of skeletal muscle - mesenchymal stems with bone marrow - mesenchymal stems or adipose tissue - mesenchymal stems.
Panel A. Co-culture of BM-MSCs (PKH26 red) and SM-MSCs (PKH67 green) revealed spontaneous fusion (white arrows) as early as 24 h after the mixed culture was started. During the follow-up period, fused cells created structures resembling myotubes; 120 h after the observation, MSCs were detached and single cells were analyzed using flow cytometry for fluorescence in the 560–695 nm range, which confirmed the immersion of red (PKH26) and green (PKH67) dyes. Panel B Fusion between SM-MSCs (PKH26 red) and AT-MSCs (PKH67 green). Flow cytometry analysis confirmed the presence of fused cells in the culture; however, after 120 h of co-culture, the fused cells assumed a mostly fusiform, but not myotube-like, shape. Flow cytometry for fluorescence in the 560-695 nm range confirmed the presence of fused cells. BM-MSC: Bone marrow - mesenchymal stem cell; AT-MSC: Adipose tissue - mesenchymal stem cell; SK-MSC: Skin - mesenchymal stem cell; SM-MSC: Skeletal muscle - mesenchymal stem cell.
- Citation: Kozlowska U, Krawczenko A, Futoma K, Jurek T, Rorat M, Patrzalek D, Klimczak A. Similarities and differences between mesenchymal stem/progenitor cells derived from various human tissues. World J Stem Cells 2019; 11(6): 347-374
- URL: https://www.wjgnet.com/1948-0210/full/v11/i6/347.htm
- DOI: https://dx.doi.org/10.4252/wjsc.v11.i6.347


