Copyright
©The Author(s) 2019.
World J Stem Cells. Feb 26, 2019; 11(2): 124-146
Published online Feb 26, 2019. doi: 10.4252/wjsc.v11.i2.124
Published online Feb 26, 2019. doi: 10.4252/wjsc.v11.i2.124
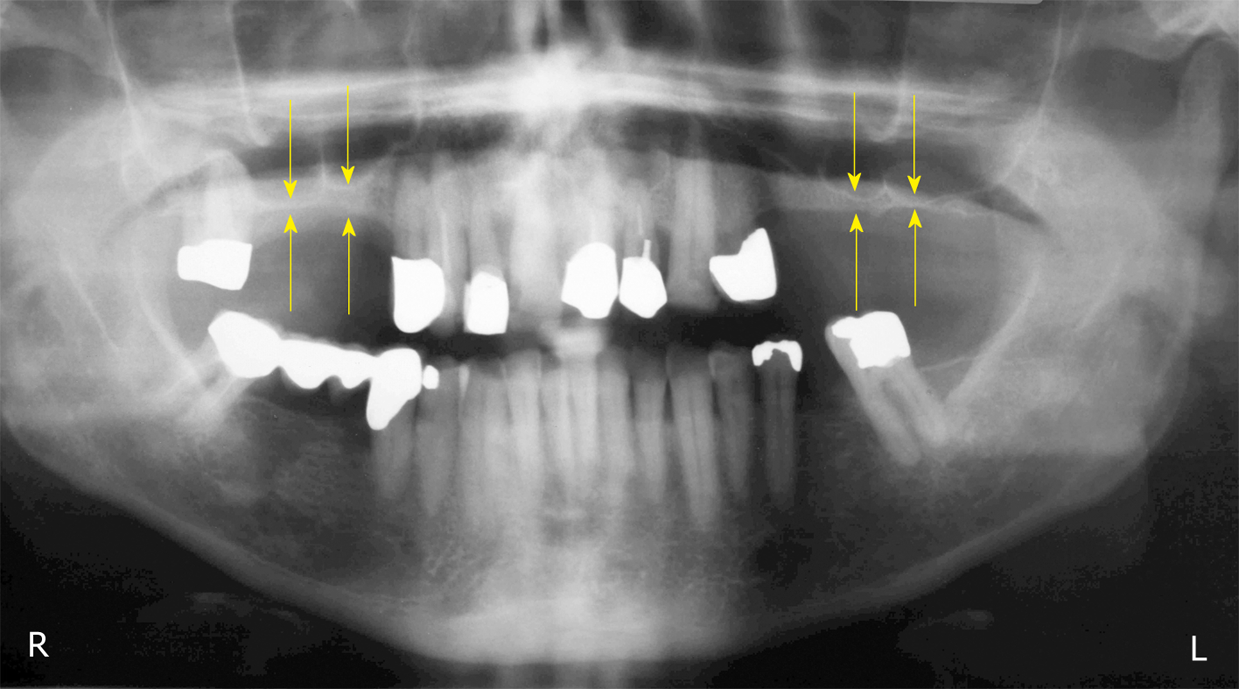
Figure 1 Panoramic radiograph at T0.
The yellow arrows indicate the reduced bone height of the edentulous posterior maxilla below the antrum and the ridge crest of less than 3 mm on both sides. R: Right; L: Left.
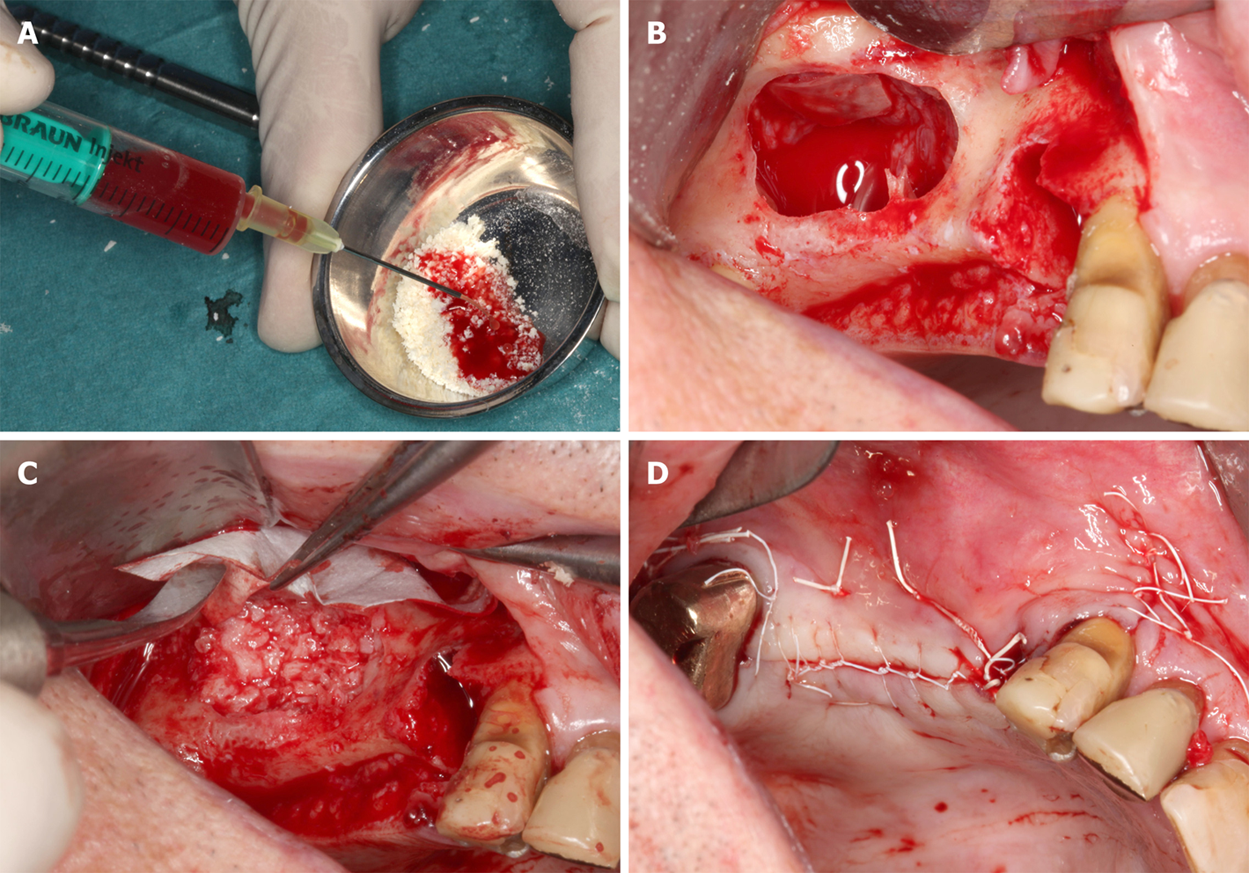
Figure 2 Details of the procedures performed immediately before and during the first surgery (guided bone regeneration-maxillary sinus augmentation).
A: Rehydration of the MCBPA with PRGF-2 and UA-ADRCs; B: Preparation of the right maxillary sinus with a lateral external window after atraumatic extraction of tooth # 14 (the Schneiderian membrane was elevated); C: Filling of the right sinus cavity with loosely packed MCBPA/PRGF-2/UA-ADRCs; D: Achievement of primary closure without tension on the right side using horizontal mattress as well as a continuous half-hitch sutures. MCBPA: Mineralized cancellous bone particulate allograft; PRGF-2: Fraction 2 of plasma rich in growth factors; UA-ADRCs: Unmodified autologous adipose-derived regenerative cells.
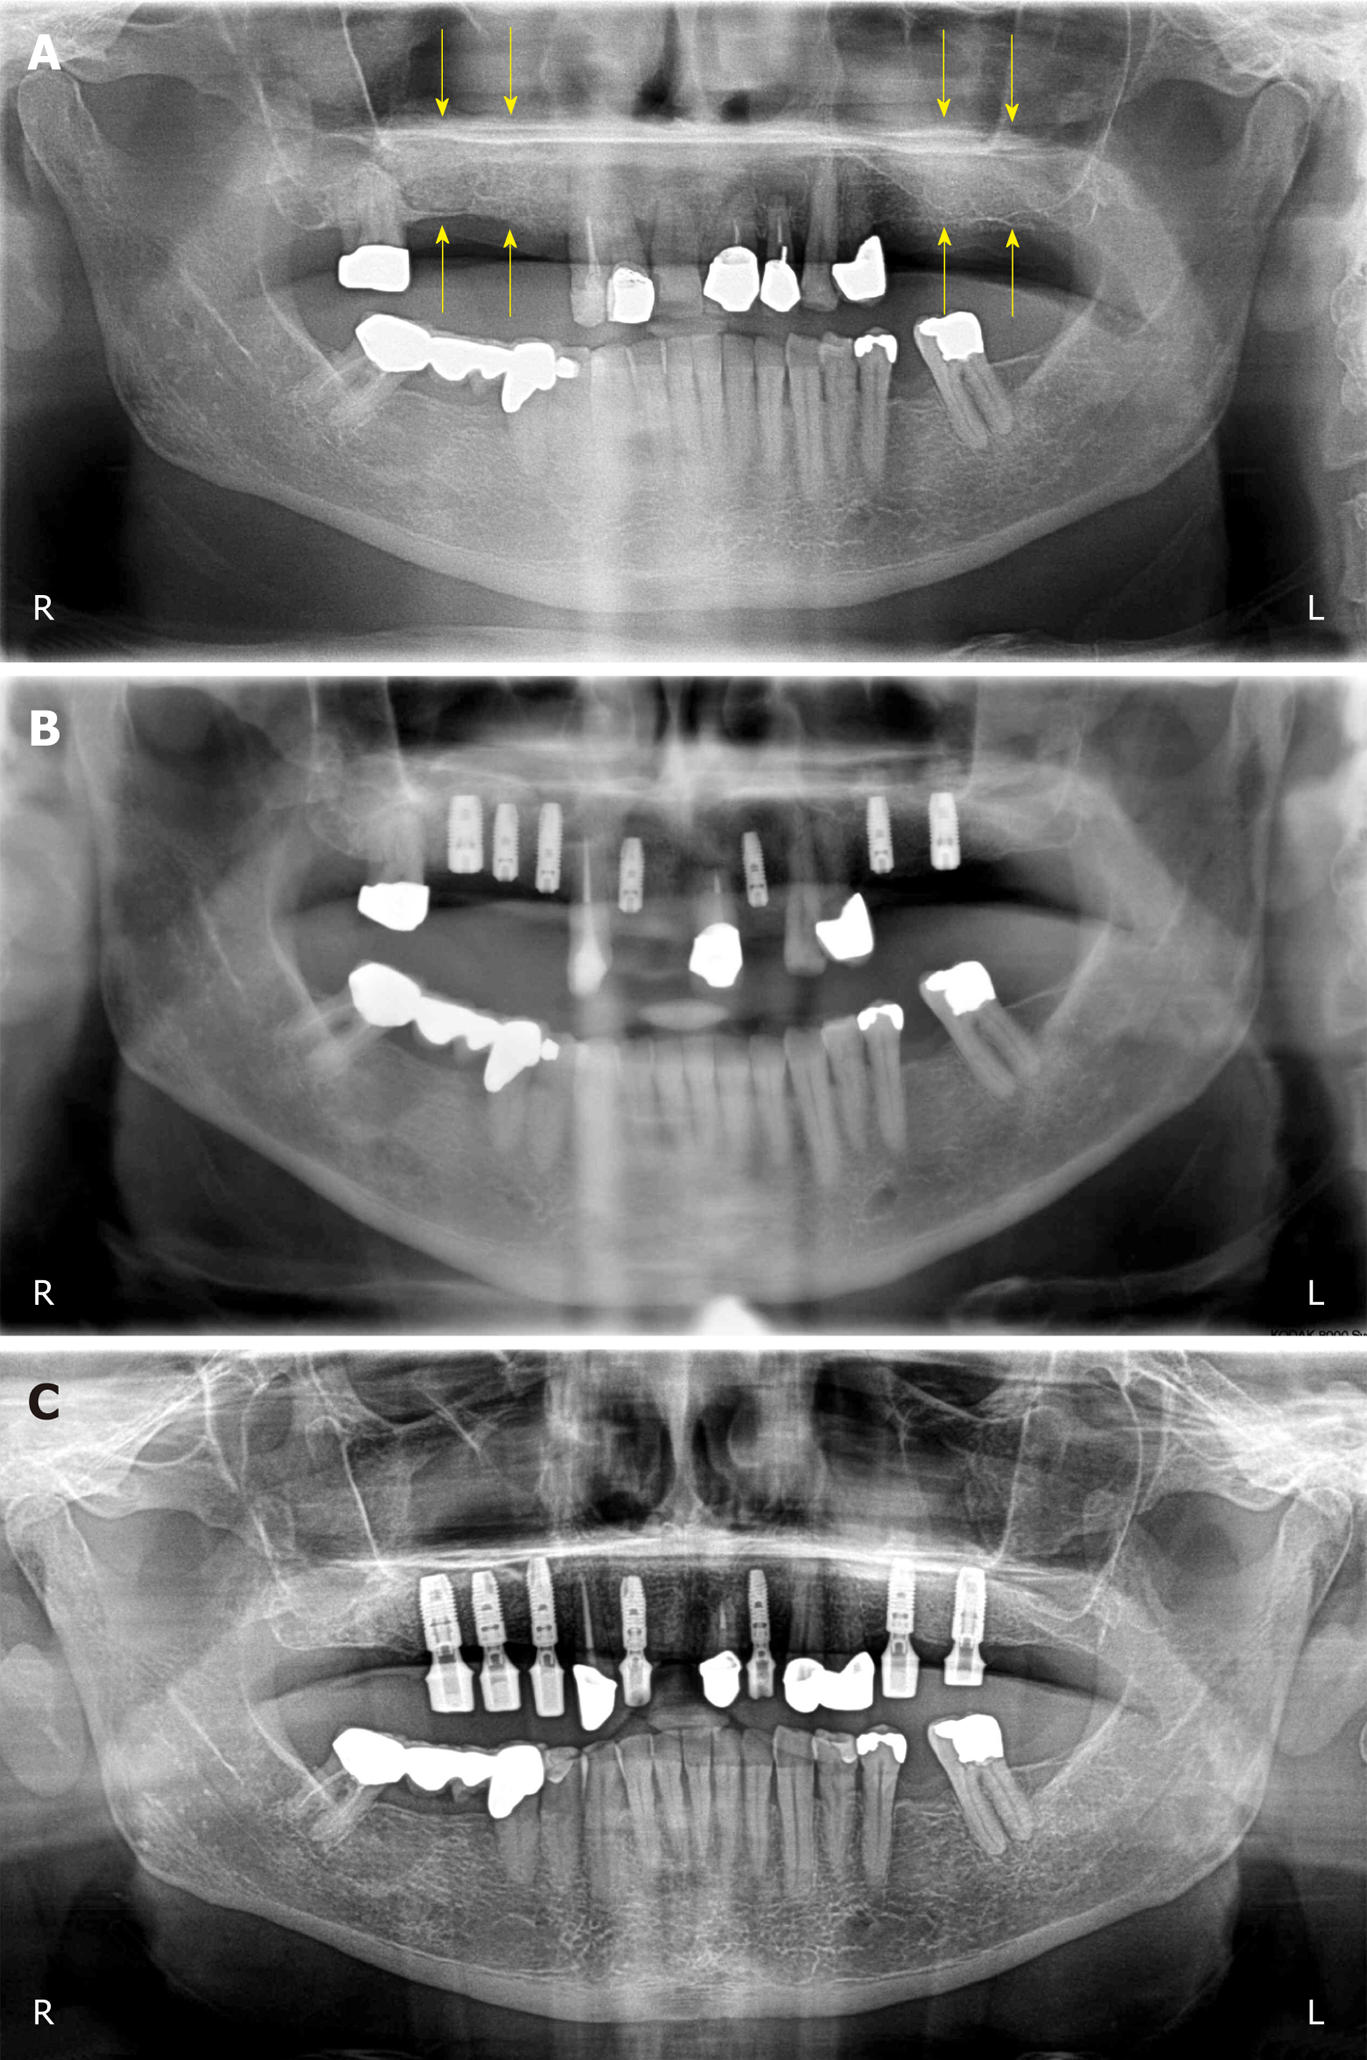
Figure 3 Clinical findings.
A: Panoramic radiograph taken immediately after the first surgery (GBR-MSA). The yellow arrows indicate the restored bone height of the edentulous posterior maxilla on both sides; B: Panoramic radiograph taken after the third surgery (placement of implants at 34 wk after GBR-MSA); C: Panoramic radiograph taken at 32 mo after the first treatment. R: Right; L: Left.
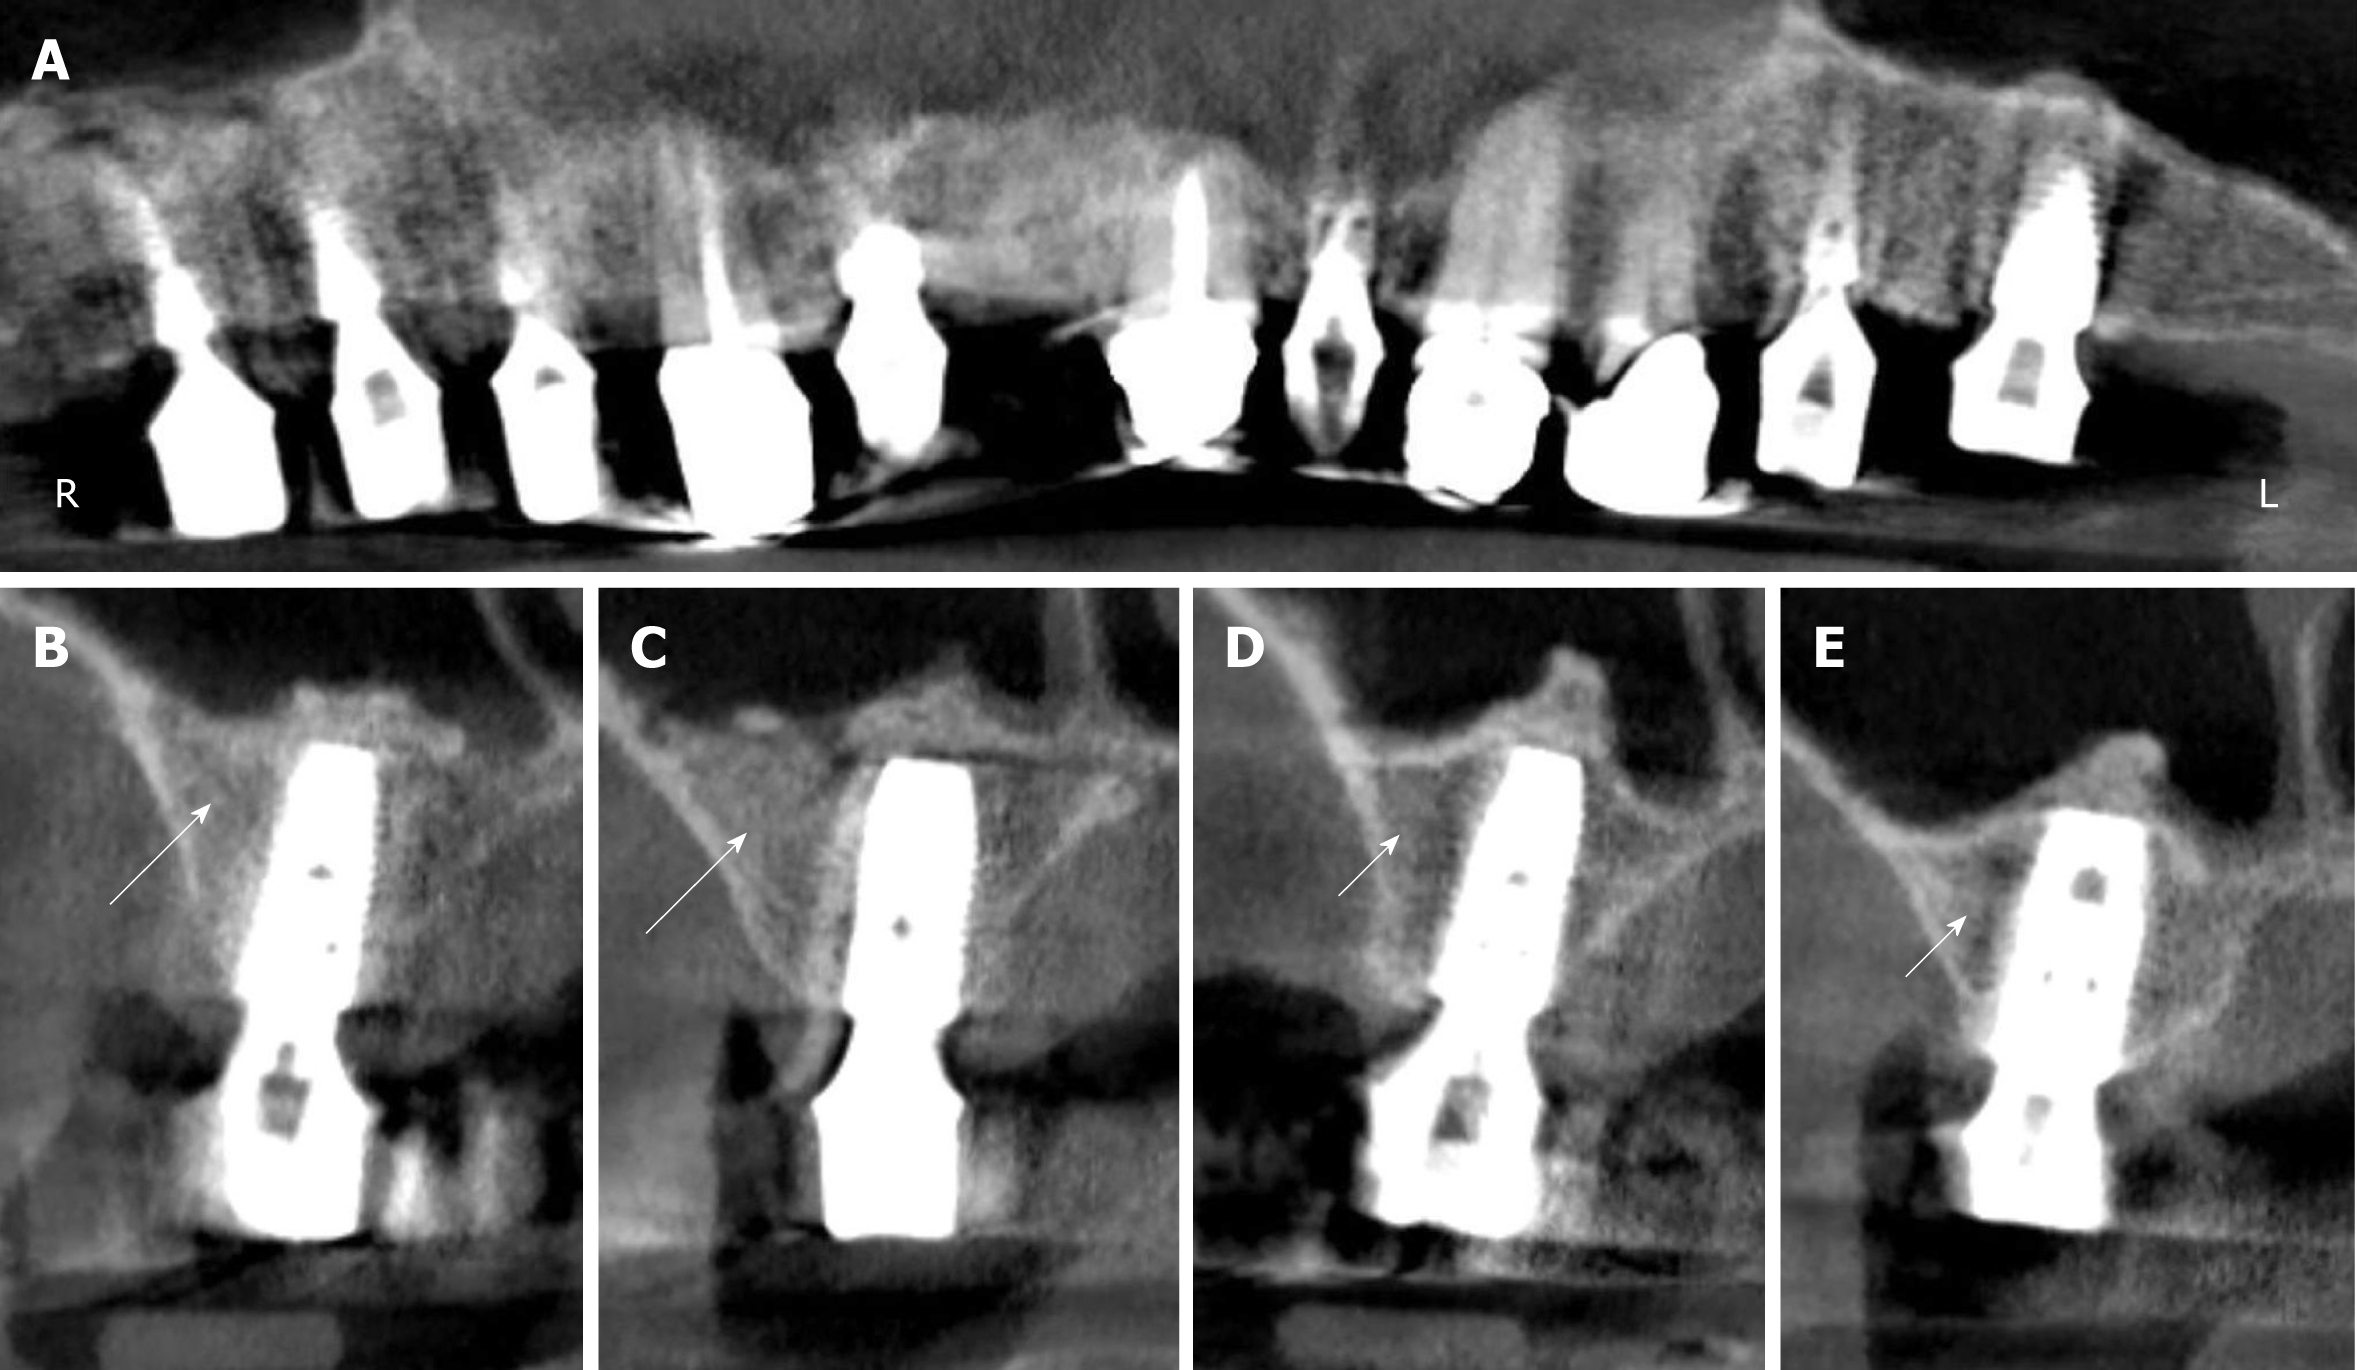
Figure 4 Digital volume tomography radiographs taken after the fourth surgery (1 year after the placement of implants and 20 mo after guided bone regeneration-maxillary sinus augmentation).
A: Panoramic view; B-E: Detailed view on selected regions 15 (B), 16 (C), 25 (D), and 26 (E). With the application of unmodified autologous adipose-derived regenerative cells (UA-ADRCs) the bone around the implants in regions 15 and 16 appeared larger in area and denser (arrows in B, C) than without the application of UA-ADRCs in regions 25 and 26 (arrowheads in D, E).
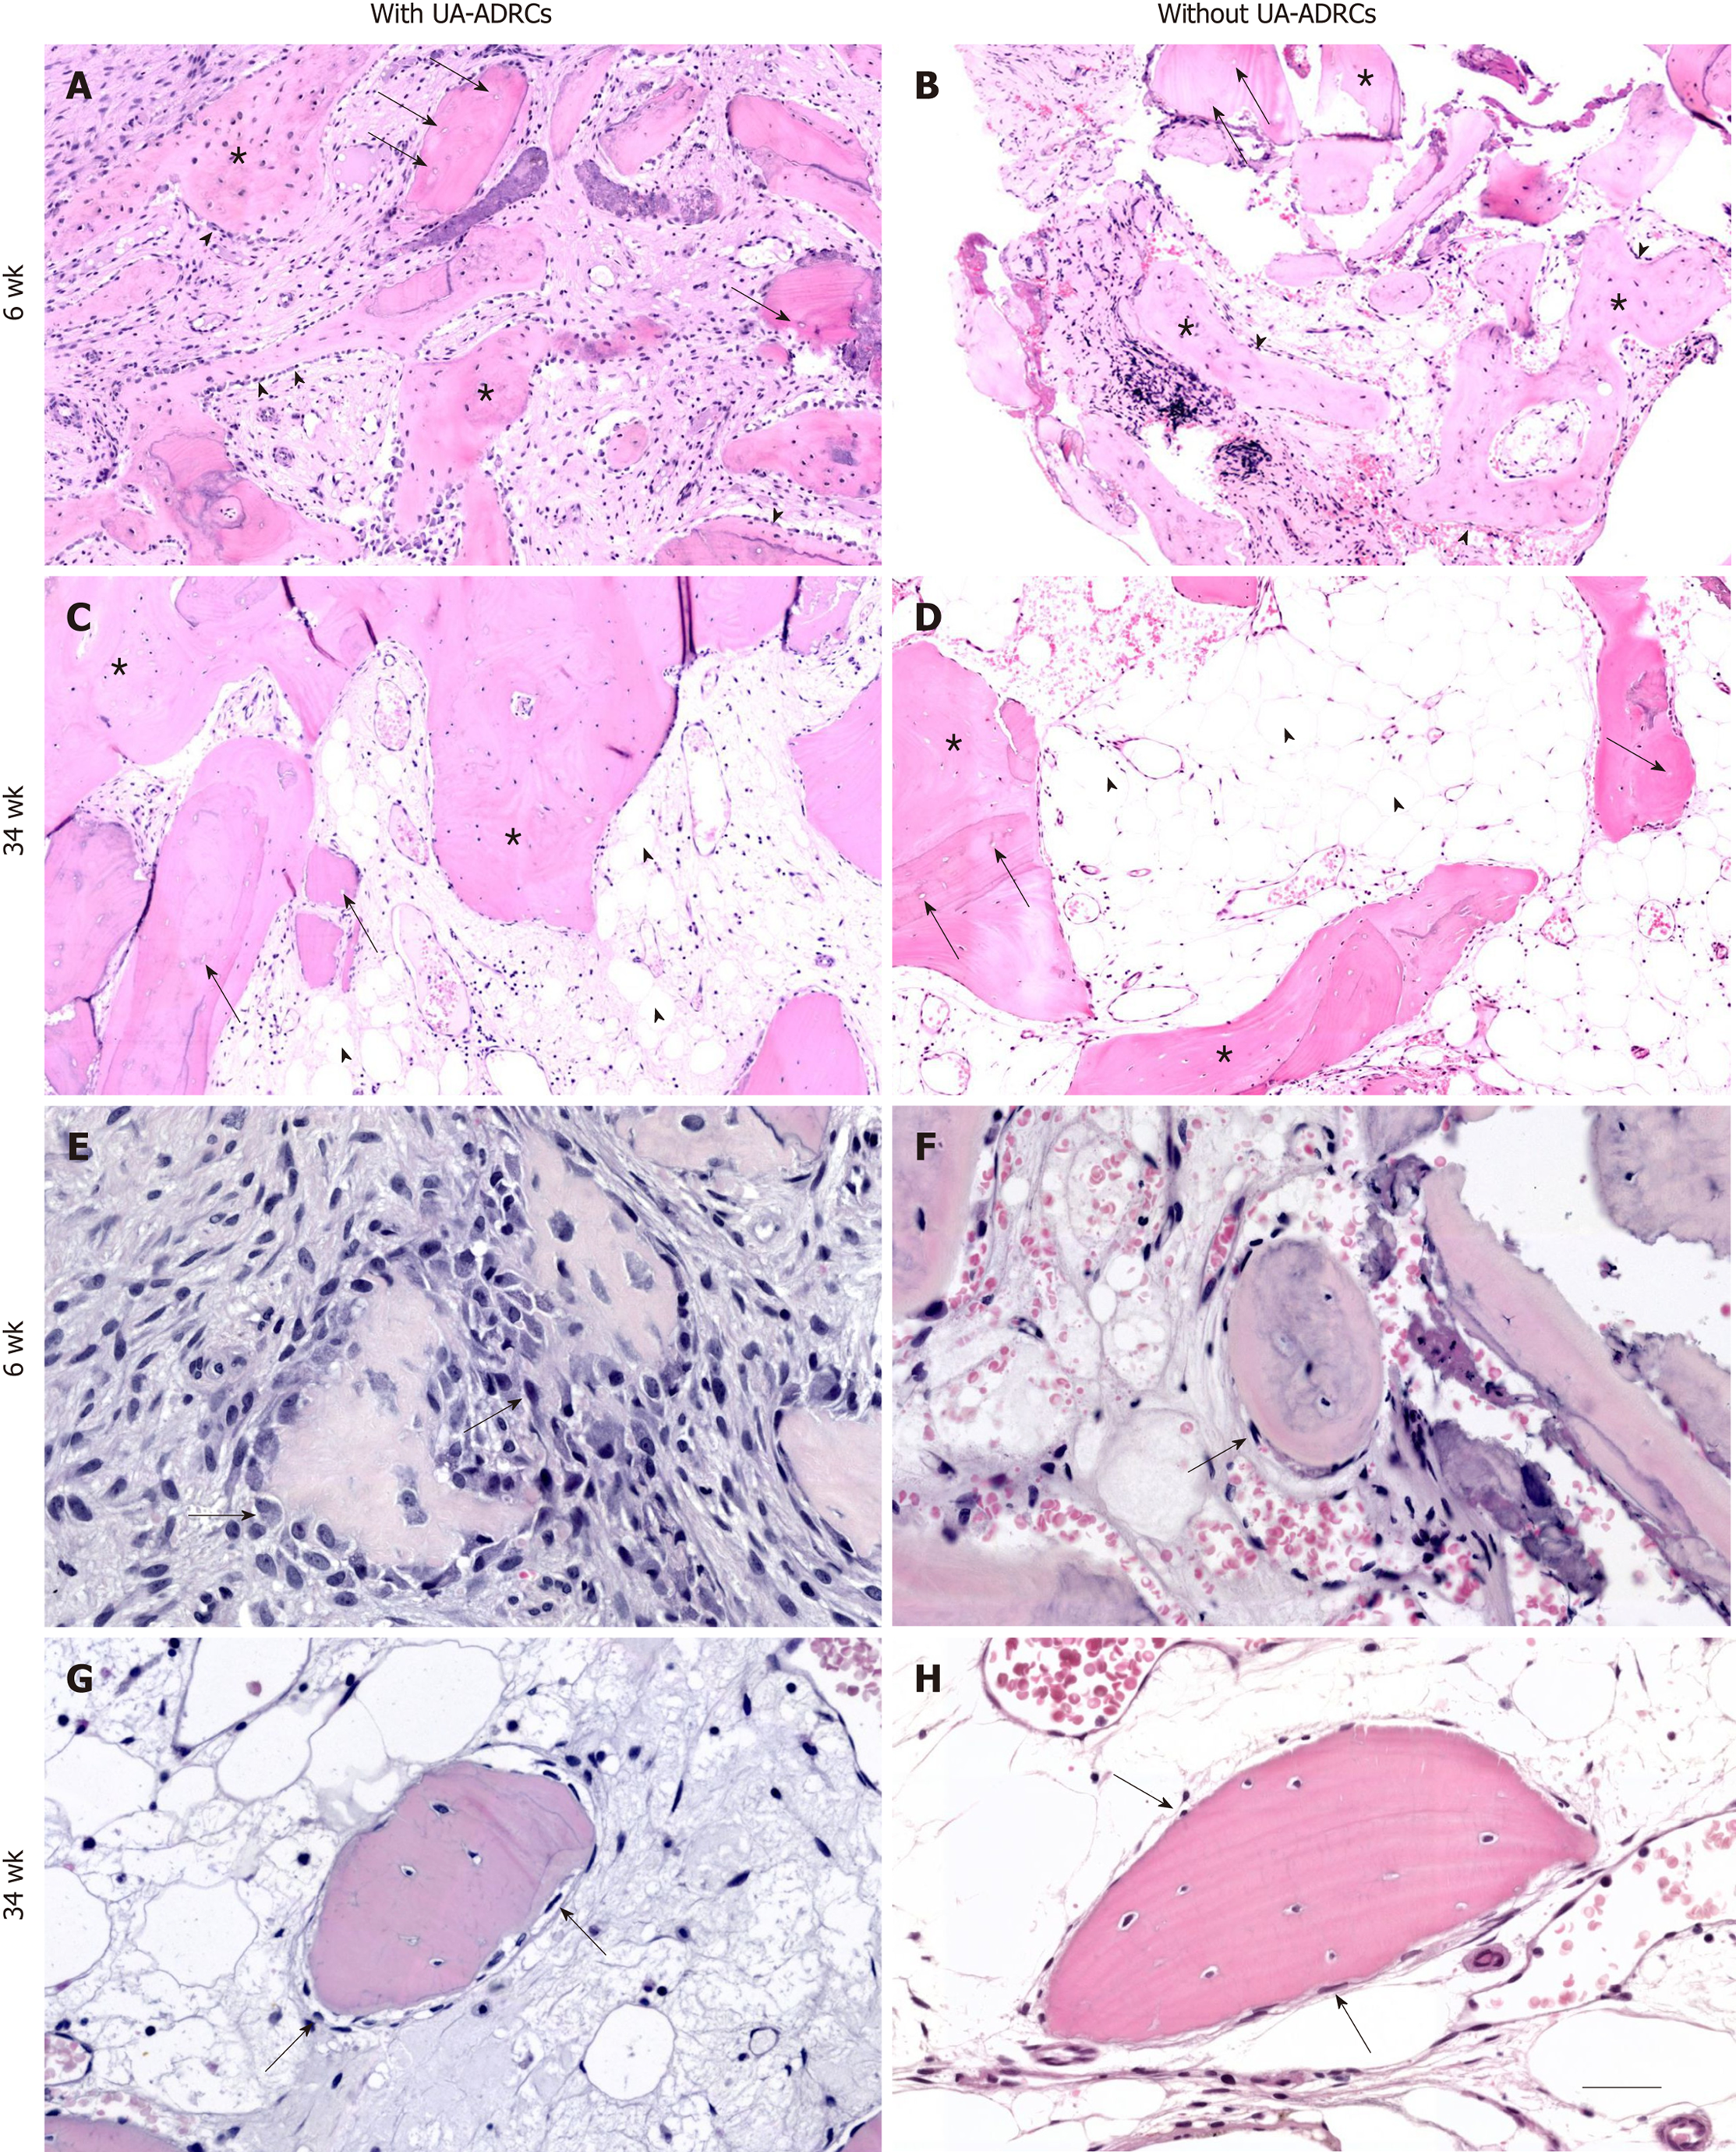
Figure 5 Histological findings.
Representative photomicrographs of 3 µm thick paraffin sections stained with hematoxylin and eosin of biopsies that were collected at 6 wk (A, B, E, F) or 34 wk (C, D, G, H) after guided bone regeneration maxillary sinus augmentation with the application of UA-ADRCs (A, C, E, G) or without UA-ADRCs (B, D, F, H). In A-D the asterisks indicate newly formed bone and the arrows indicate empty osteocyte lacunae in allogeneic fragments. Furthermore, in A and B the arrowheads point to osteoblasts with underlying osteoid, while in C and D the arrowheads indicate adipocytes. In E-H the arrows indicate cells on the surface of newly formed bone. The scale bar in H represents 150 µm in A-D and 75 µm in E-H. UA-ADRCs: Unmodified autologous adipose-derived regenerative cells.
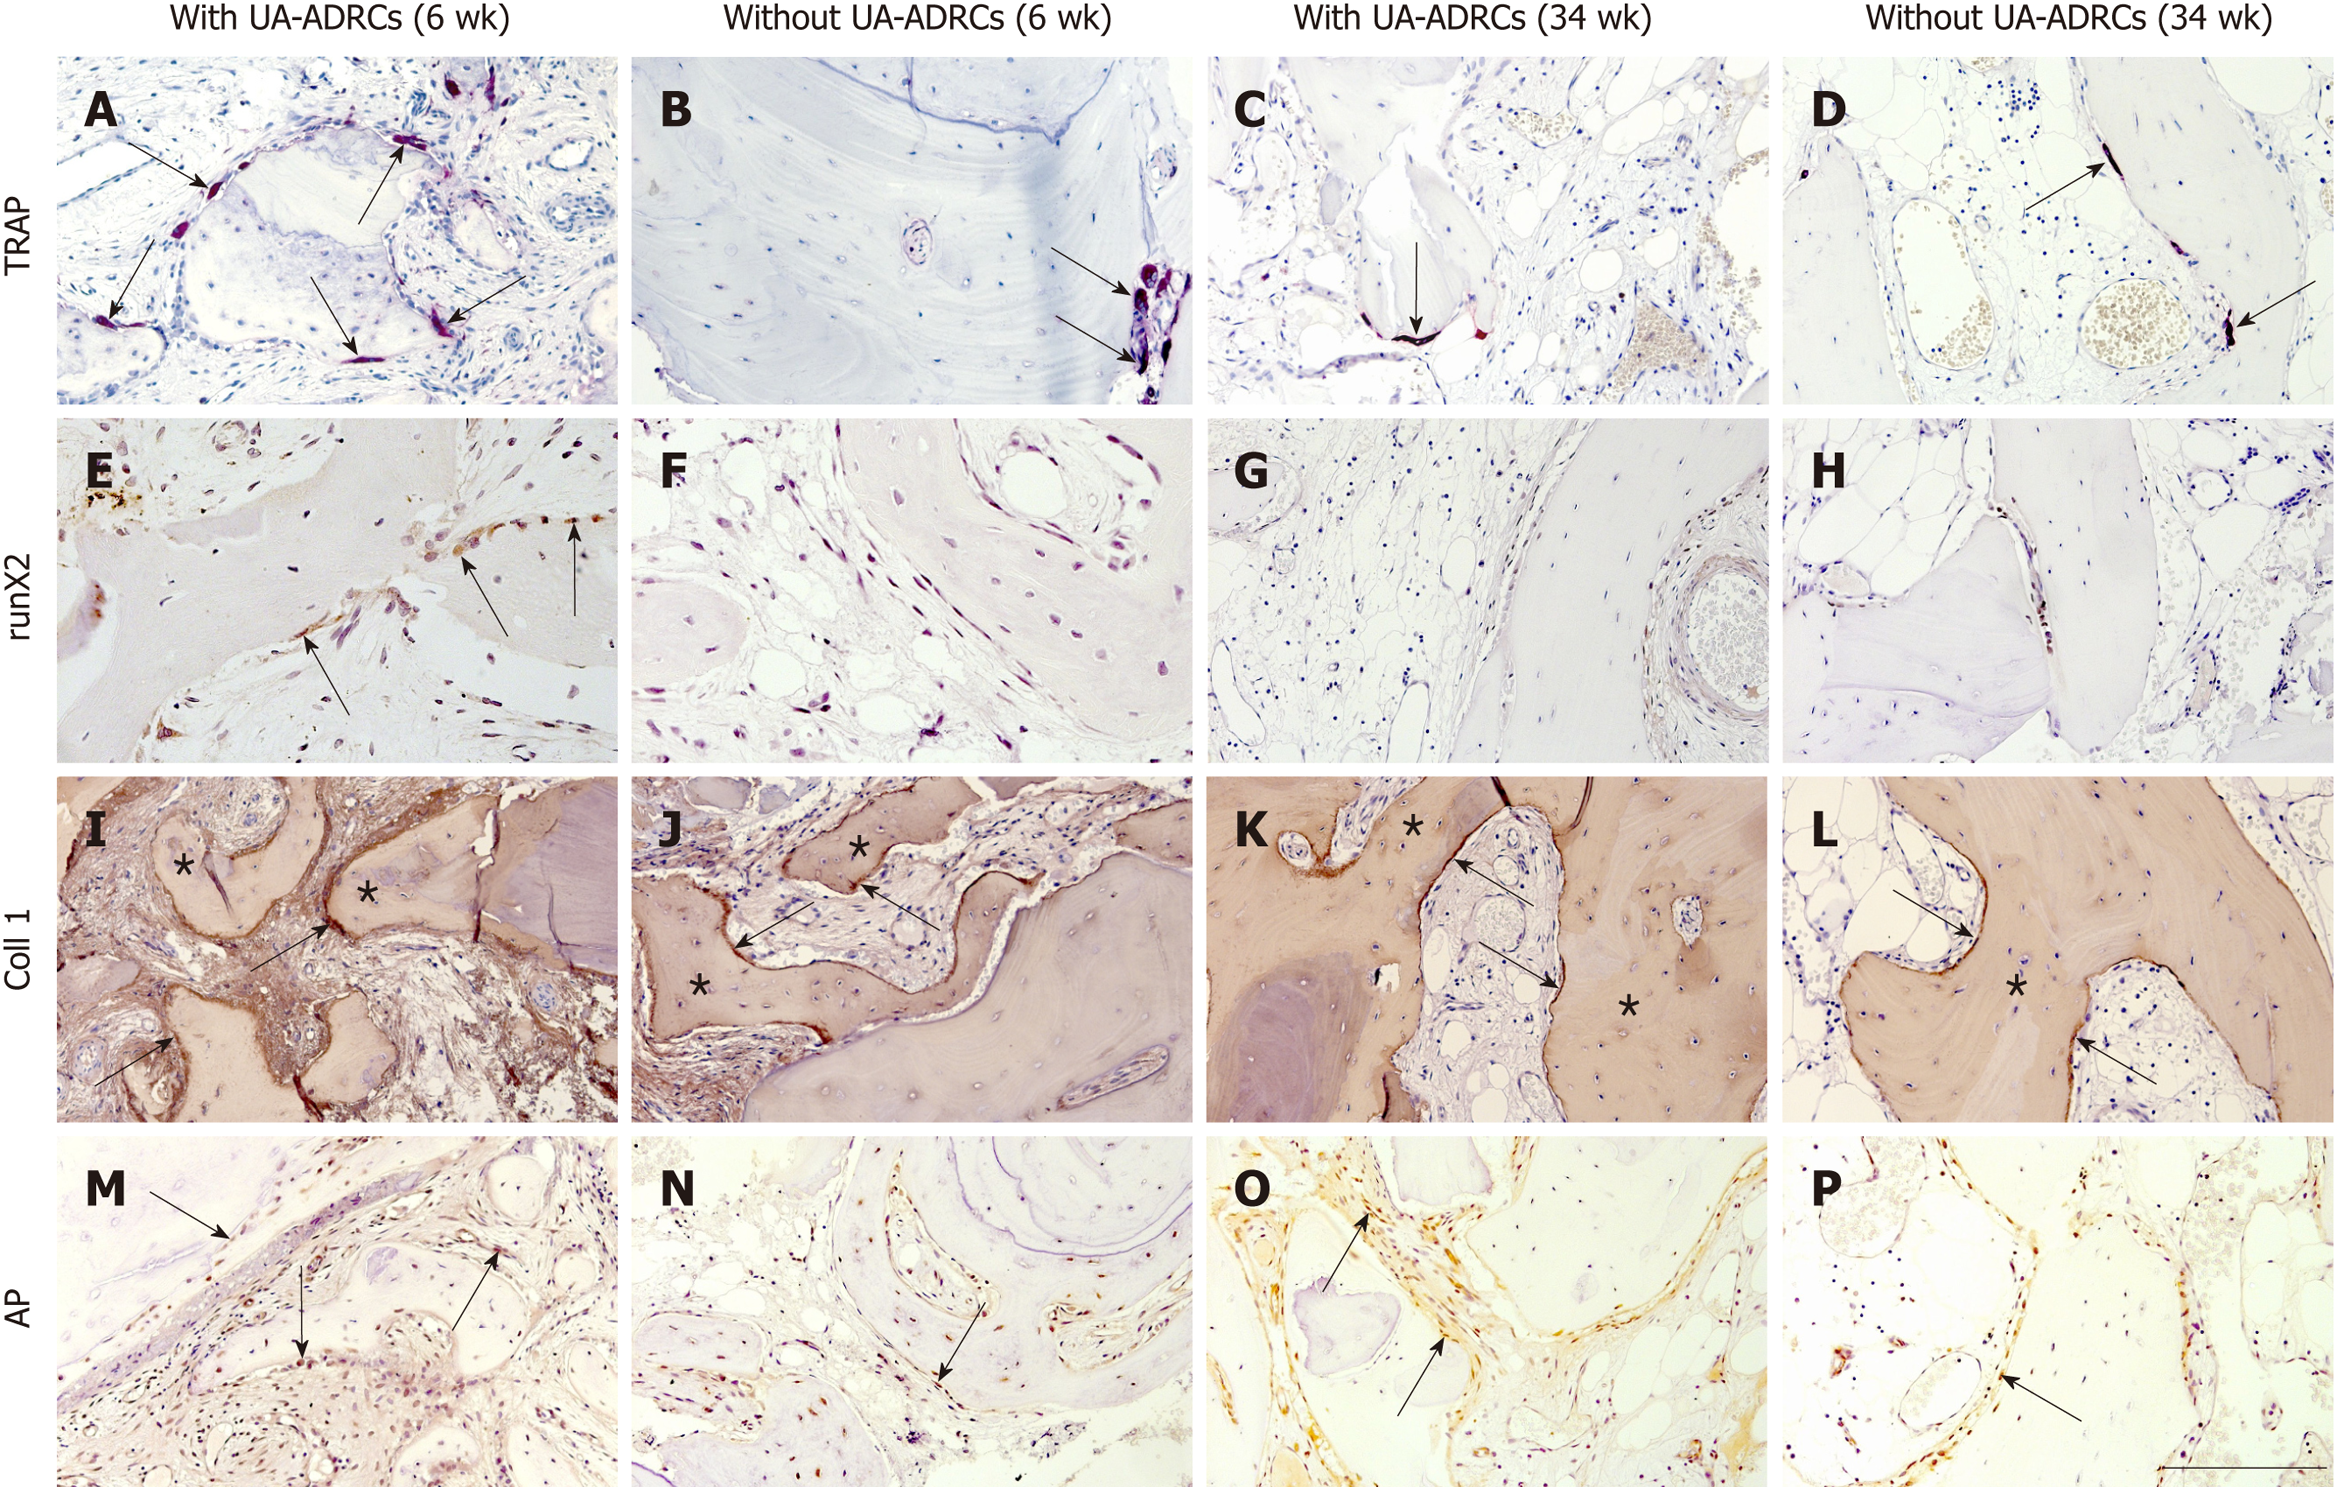
Figure 6 Histological findings.
Representative photomicrographs of histochemical detection of tartrate-resistant acid phosphatase (TRAP) (A-D) as well as of immunohistochemical detection of Runt-related transcription factor 2 (runX2) (E-H), collagen 1 (Coll 1) (I-L), and alkaline phosphatase (AP) (M-P) in 3 µm thick paraffin sections of biopsies that were collected at 6 wk (A, B, E, F, I, J, M, N) or 34 wk (C, D, G, H, K, L, O, P) after GBR-MSA with the application of UA-ADRCs (A, C, E, G, I, K, M, O) or without UA-ADRCs (B, D, F, H, J, L, N, P). In A-D the arrows point to osteoclasts, in E to osteoblasts, in I-L to type I collagen in osteoid seams, and in M-P to AP immunostaining found in osteoblasts, osteoblast-like cells, and fibroblasts in the intertrabecular connective tissue. Furthermore, in I-L the asterisks indicate type I collagen in the matrix of newly formed bone trabeculae. The scale bar in P represents 200 µm in A-D and I-P, and 100 µm in E-H. UA-ADRCs: Unmodified autologous adipose-derived regenerative cells.
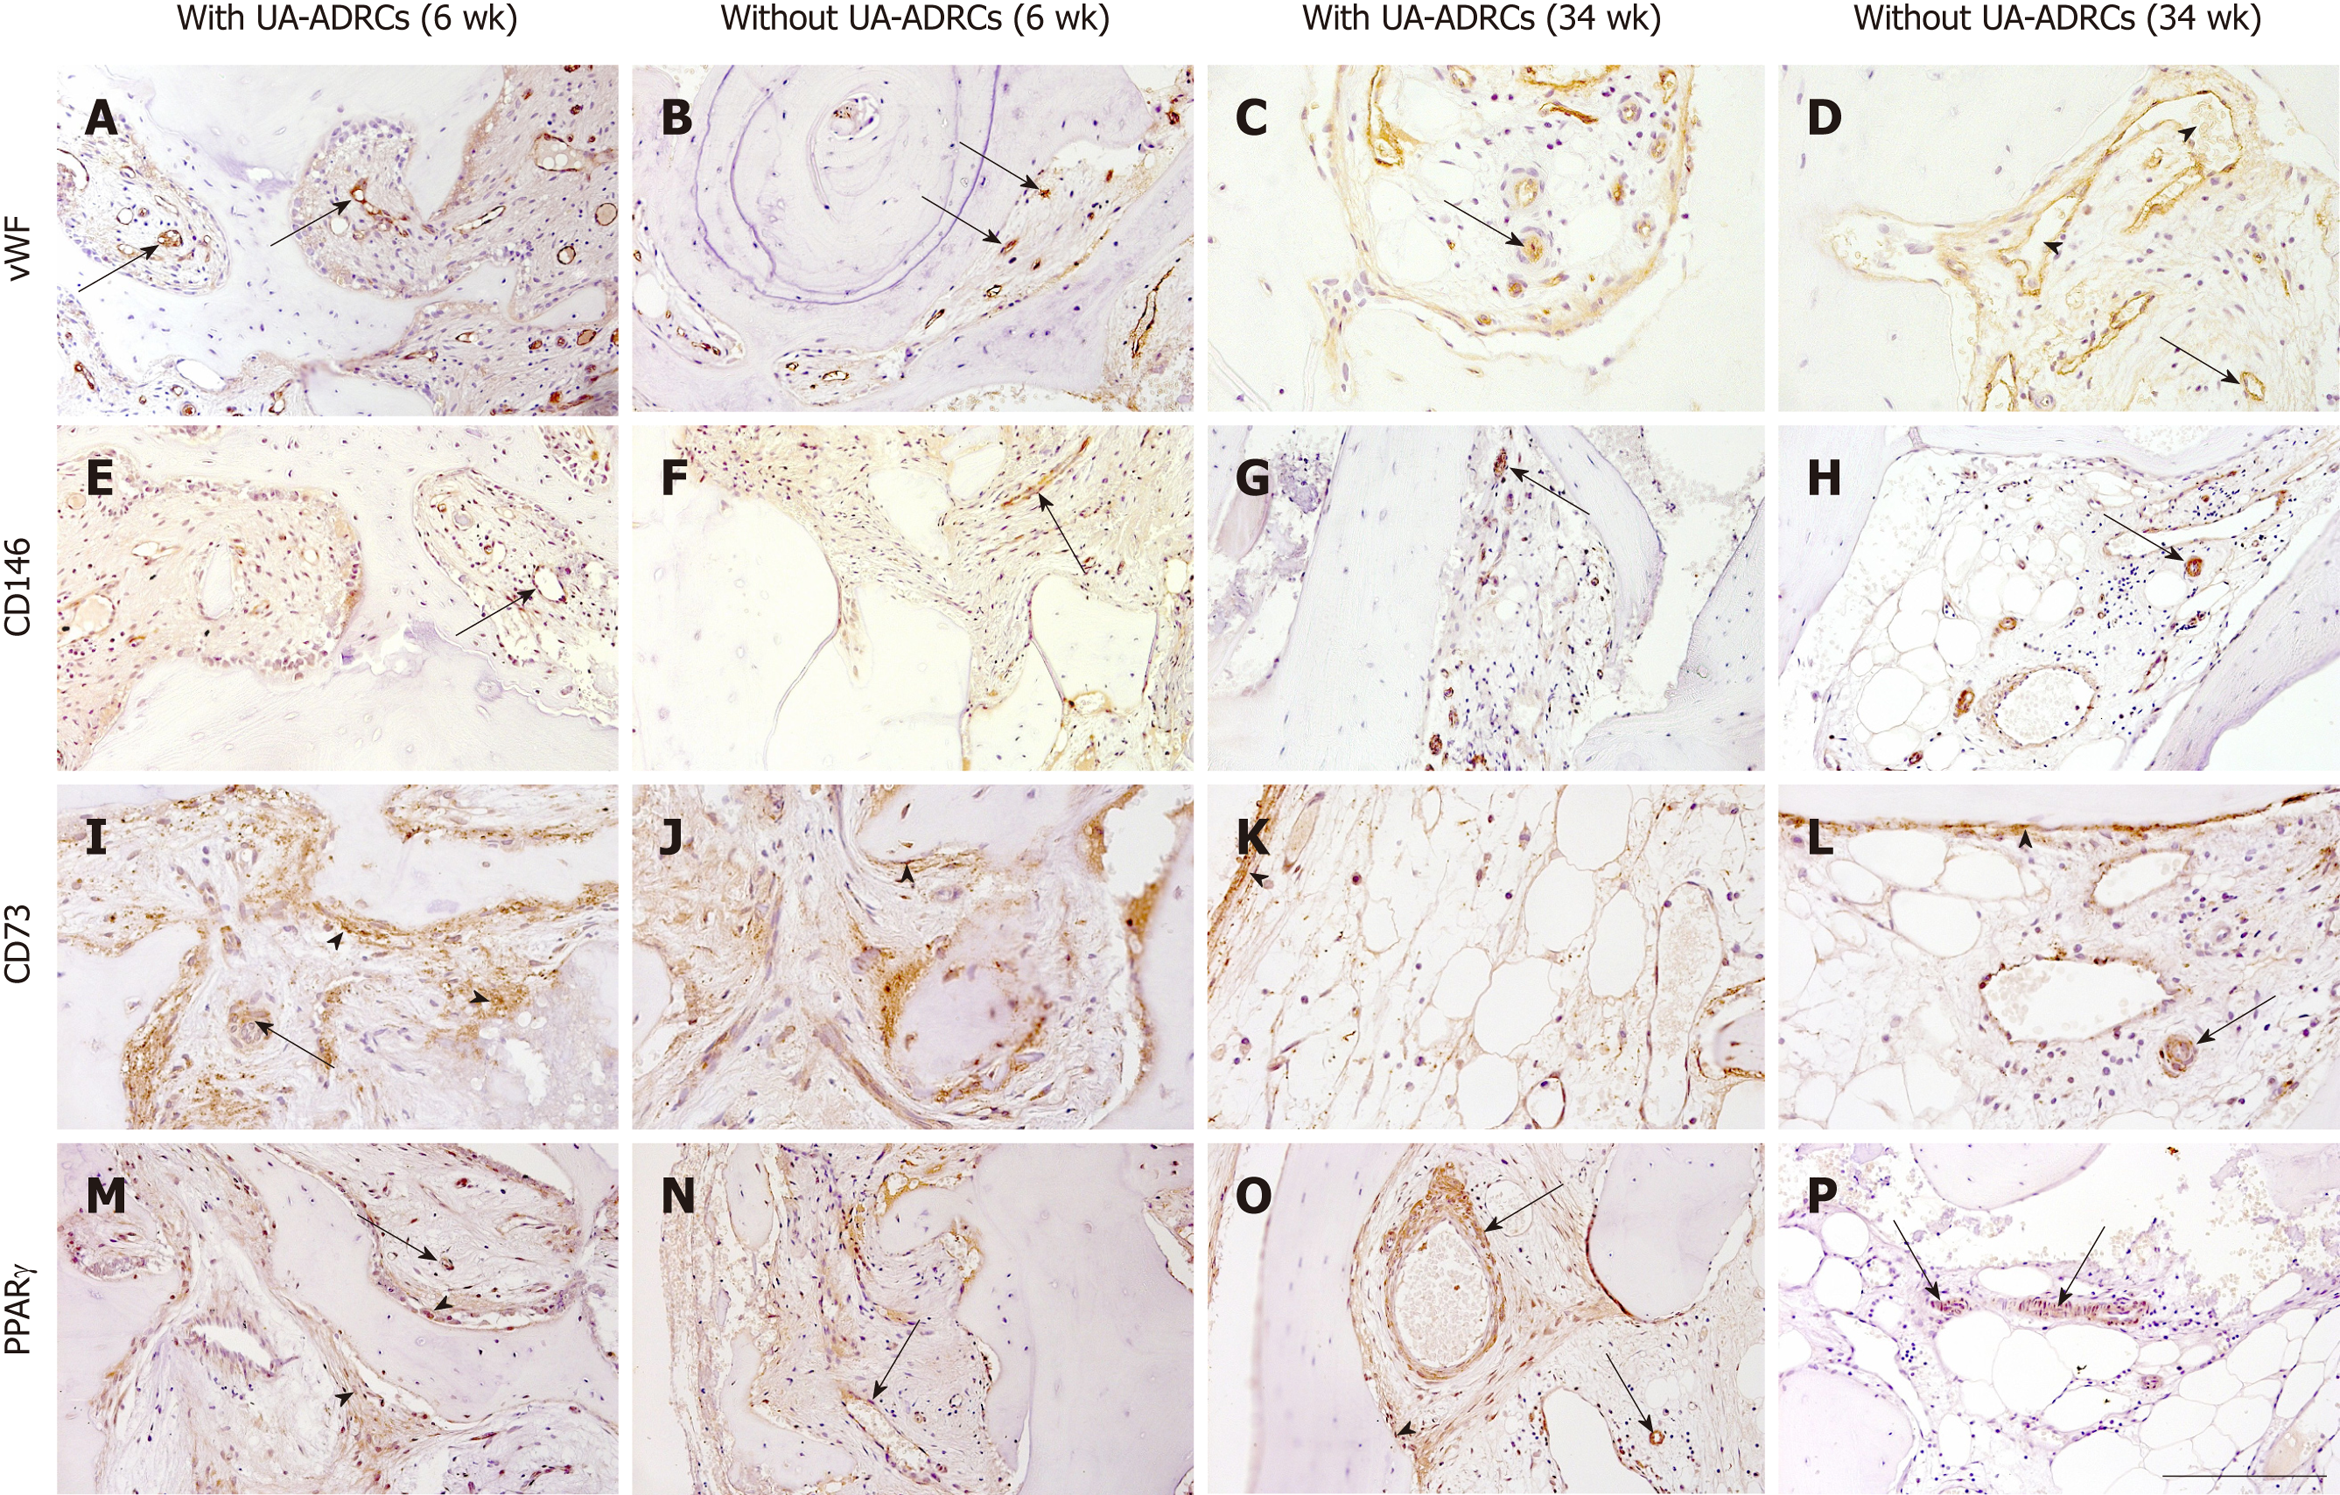
Figure 7 Histological findings.
Representative photomicrographs of immunohistochemical detection of factor VIII/von Willebrand factor (vWF) (A-D), CD146 (E-H), CD73 (I-L), and peroxisome proliferator-activated receptor gamma (PPARγ) (M-P) in 3 µm thick paraffin sections of biopsies that were collected at 6 wk (A, B, E, F, I, J, M, N) or 34 wk (C, D, G, H, K, L, O, P) after GBR-MSA with the application of UA-ADRCs (A, C, E, G, I, K, M, O) or without UA-ADRCs (B, D, F, H, J, L, N, P). In all panels the arrows point to vessels. Furthermore, the arrowheads indicate sinusoidal vessels in D, and fibroblasts and osteoblasts in I-L, M, and O. The scale bar in P represents 200 µm in A-D and I-P, and 100 µm in E-H. GBR-MSA: Guided bone regeneration maxillary sinus augmentation; UA-ADRCs: Unmodified autologous adipose-derived regenerative cells.
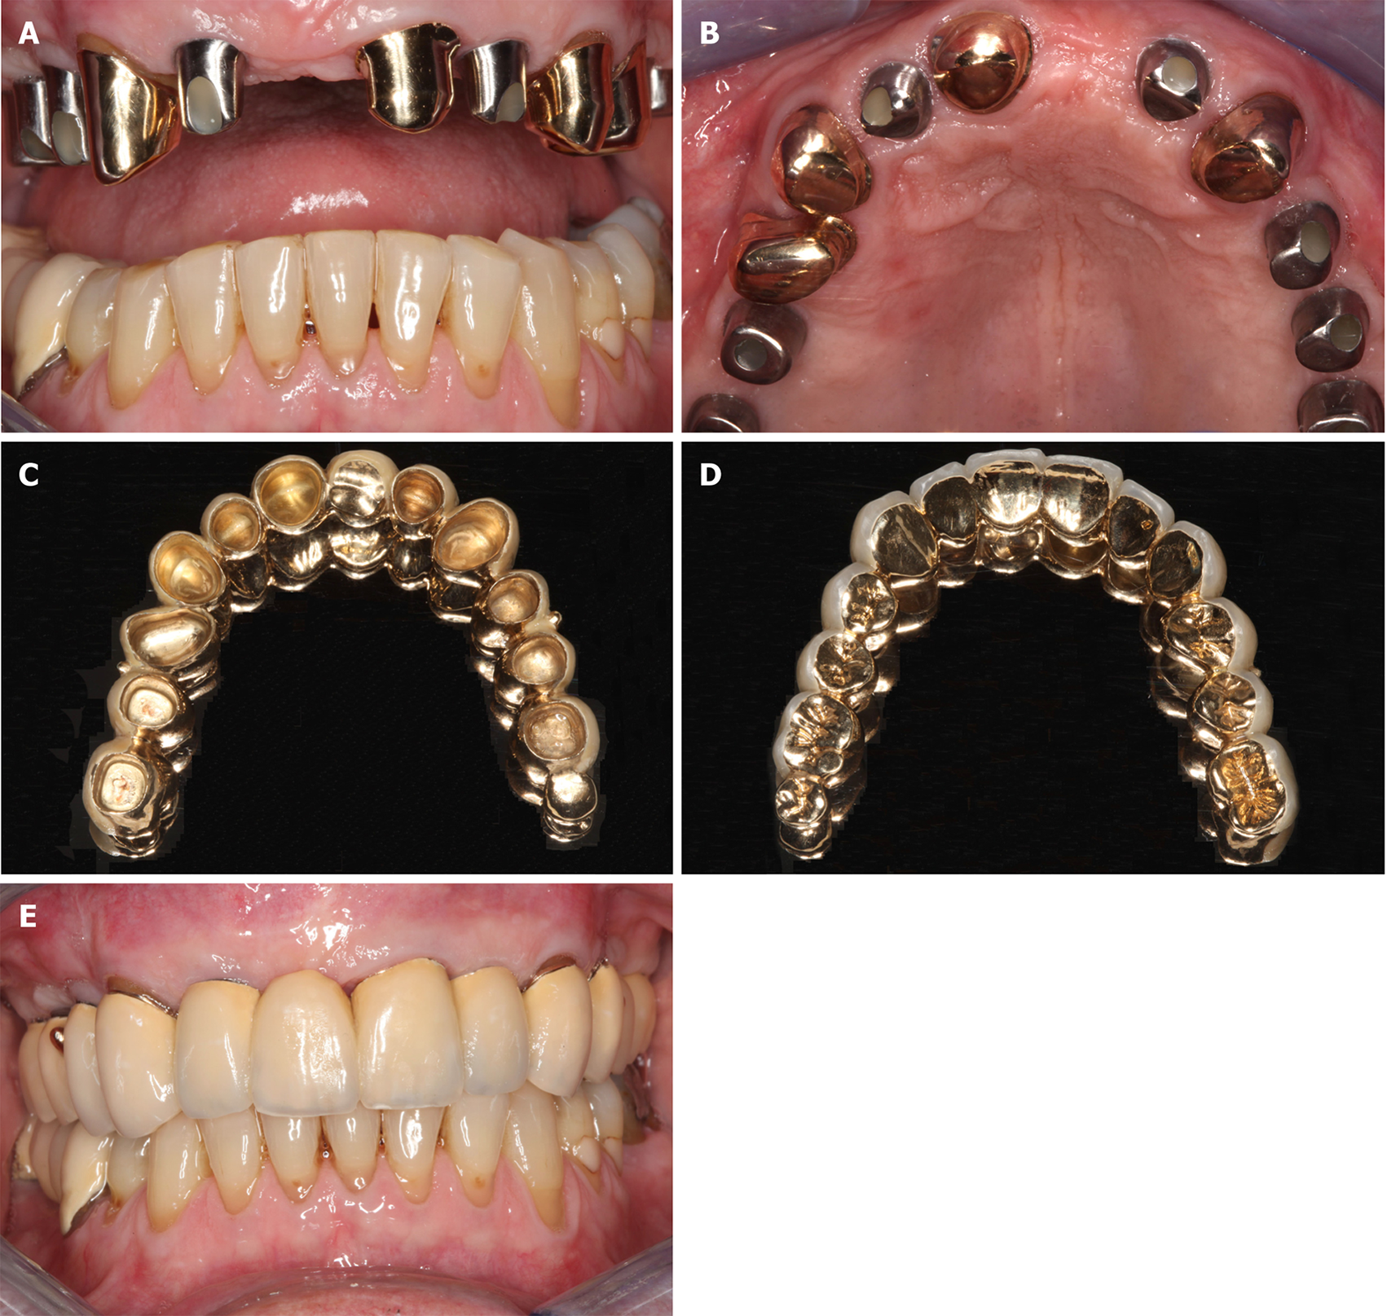
Figure 8 Documentation of clinical outcome.
A, B: Intraoral ventral (A) and occlusal (B) views on the healing abutments in regions 12, 14, 15, 16, 22, 25, and 26 after the fourth treatment (1 year after the placement of implants and 20 mo after guided bone regeneration maxillary sinus augmentation). Note that the teeth # 13, 21, 23, and 24 are crowned; C, D: External (C) and internal (D) view of the prosthetic telescopic bridge; E: Intraoral view of the final prosthetic reconstruction.
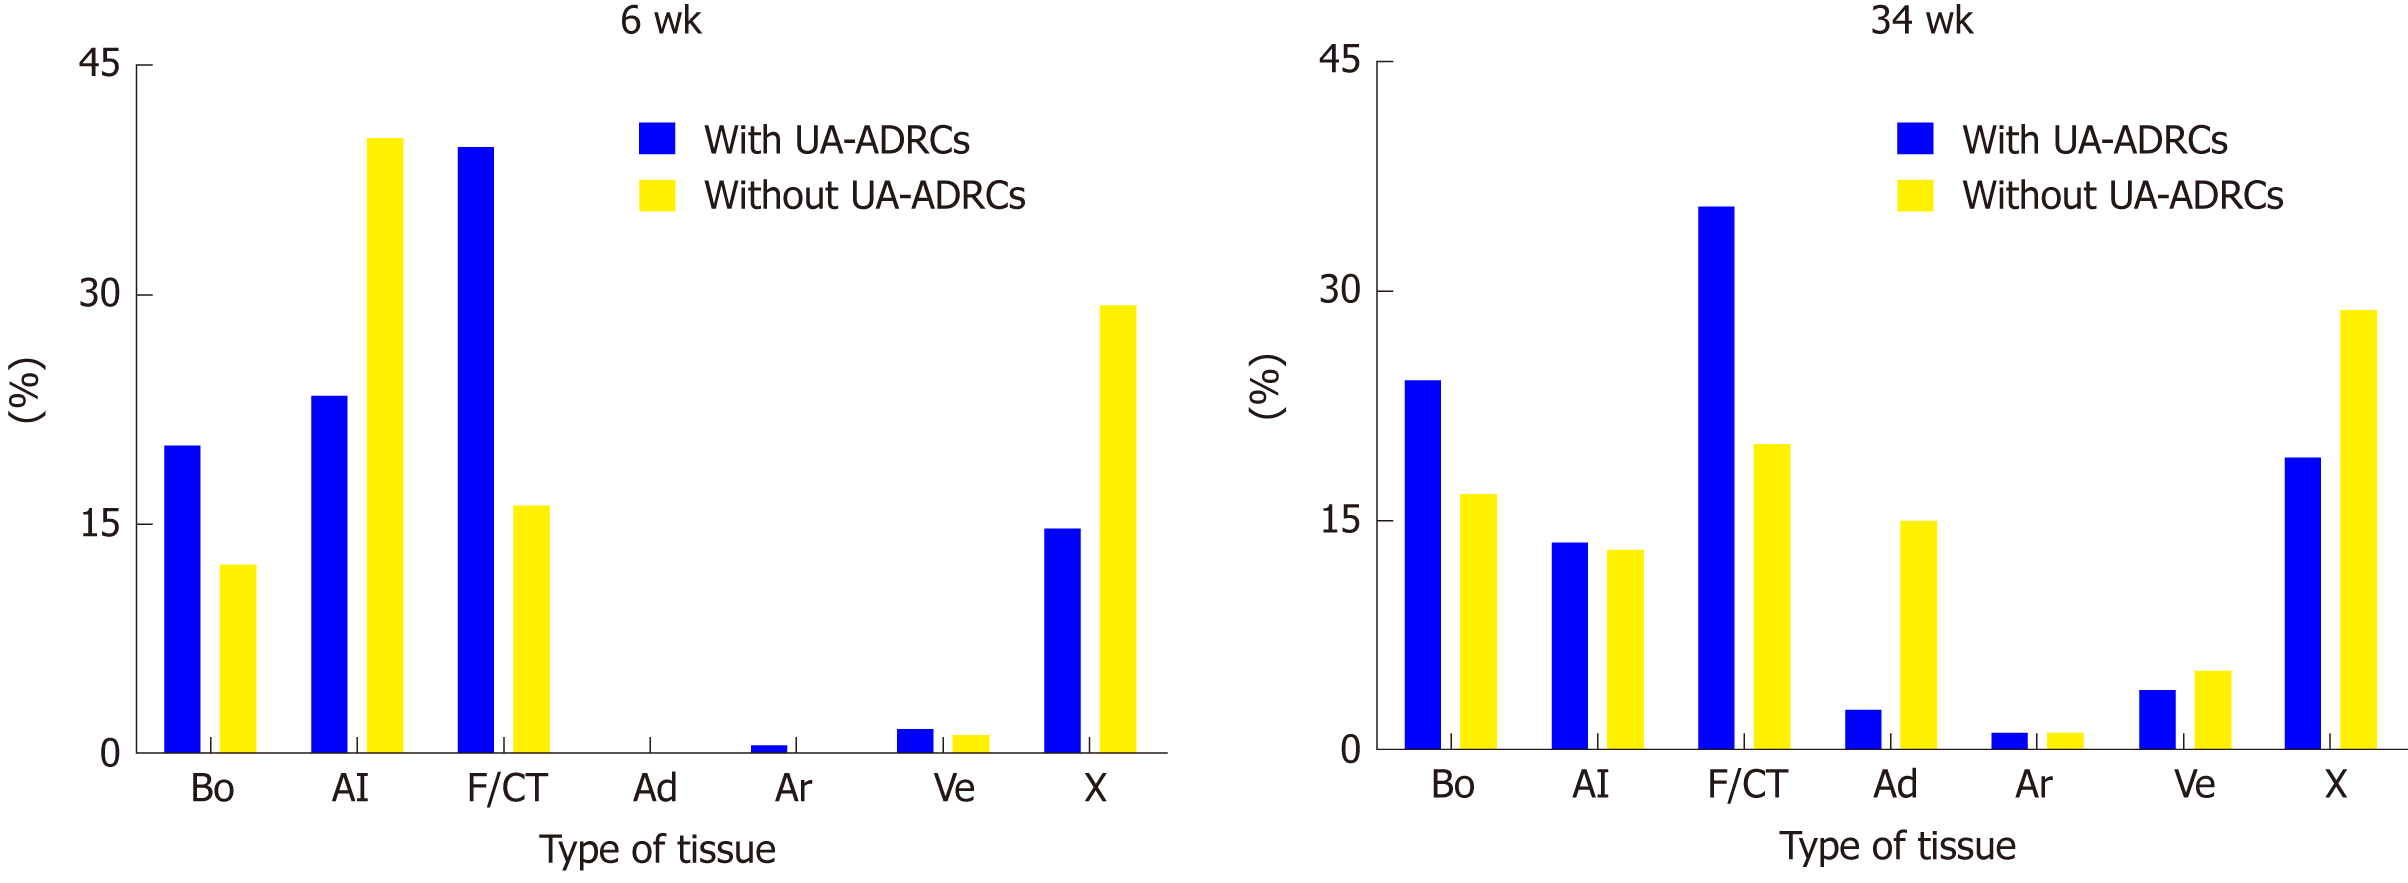
Figure 9 Results of histomorphometric analyses.
Relative amounts (area/area) of bone (Bo), allograft (Al), fibrin and connective tissue (F/CT), adipocytes (Ad), arteries (Ar), veins (Ve) and artifacts (X) in 3 µm thick paraffin sections stained with hematoxylin and eosin stain of biopsies that were collected at 6 wk (on the left) or 34 wk (on the right) after guided bone regeneration maxillary sinus augmentation with the application of unmodified autologous adipose-derived regenerative cells (UA-ADRCs) or without UA-ADRCs. UA-ADRCs: Unmodified autologous adipose-derived regenerative cells.
- Citation: Solakoglu Ö, Götz W, Kiessling MC, Alt C, Schmitz C, Alt EU. Improved guided bone regeneration by combined application of unmodified, fresh autologous adipose derived regenerative cells and plasma rich in growth factors: A first-in-human case report and literature review. World J Stem Cells 2019; 11(2): 124-146
- URL: https://www.wjgnet.com/1948-0210/full/v11/i2/124.htm
- DOI: https://dx.doi.org/10.4252/wjsc.v11.i2.124


